

Abstract
Disruption of circadian rhythm is believed to play a critical role in cancer development. To gain further insights into the roles of circadian genes in chronic myeloid leukemia (CML), we analyzed peripheral blood from 53 healthy individuals and 35 CML patients for the expression of the nine circadian genes. The expression levels of hPER1, hPER2, hPER3, hCRY1, hCRY2 and hBMAL1 were significantly impaired in both chronic phase and blastic crisis of CML cases compared with those in healthy individuals (P < 0.001). Methylation studies in the promoter areas of these six genes revealed that only the CpG sites of the hPER3 gene were methylated in all of the CML patients, and the methylated CpG frequencies differed significantly in patients at blastic crisis (8.24 ± 0.73) or at chronic phase (4.48 ± 0.48). The CpG sites of the hPER2 gene were also methylated in 40% of the CML patients. No mutation was found within the coding region of hPER3 in CML cases. Our results suggest that the downregulated hPER3 expression in CML is correlated with the inactivation of hPER3 by methylation. (Cancer Sci 2006; 97: 1298–1307)
Circadian rhythm is present in all eukaryotic and some prokaryotic life forms. These organisms exhibit daily rhythmic changes in various physiological processes, such as gene expression, metabolism and behavior.( 1 , 2 , 3 , 4 , 5 , 6 ) In mammals, the central pacemaker is located at the suprachiasmatic nuclei (SCN) of the anterior hypothalamus and the SCN clock is entrained to the 24 h day by the daily light–dark cycle through the retina‐to‐SCN neural pathways.( 7 ) Recently, mammalian peripheral oscillators in body cells similar to those operating in the SCN have been found, and these peripheral circadian rhythms are possibly driven or synchronized by the SCN.( 3 , 8 ) All known circadian oscillators use transcriptional–translational feedback loops that rely on positive and negative elements in oscillators. Therefore, the strong daily cycling of clock gene mRNA,( 9 , 10 ) clock proteins,( 11 , 12 ) and clock‐controlled gene RNA and proteins,( 13 , 14 ) is characteristic of circadian systems. To date, at least nine mammalian core circadian genes have been identified: Period1 (Per1), Period2 (Per2), Period3 (Per3), Clock, Cryptochrome1 (Cry1), Cryptochrome2 (Cry2), Bmal1, Casein kinase 1ɛ (CK1ɛ) and Timless (TIM).( 1 , 2 , 3 , 4 , 5 , 6 , 8 , 15 ) Circadian genes and the proteins produced by these genes constitute the molecular components of the circadian oscillator and generate circadian rhythms.( 16 ) The negative feedback loop of circadian oscillators was proposed to involve the dynamic regulation of Per1, Per2, Per3, Cry1 and Cry2 genes.
Among these circadian genes, the period (PER) genes occupy a predominant position in the current model of the autoregulatory transcriptional–translational feedback loops.( 1 , 2 , 3 , 4 , 5 , 6 , 8 , 15 ) Recent studies have shown that mice deficient in mPer2 are cancer prone (salivary gland hyperplasia and lymphoma) and display deregulated temporal expression of genes involved in cell cycle regulation, such as c‐Myc, Cyclin D1, Cyclin A and Mdm‐2. ( 17 ) The results revealed that Per2 is an essential circadian gene and it is associated with proliferation control in mammals. In mPer1 –/– mCry2 –/– double mutants, an age‐dependent decay of the circadian clock both at the behavioral and molecular levels was observed.( 18 ) In addition, mPer1 has been suggested to play a role in synchronizing the circadian clock to environmental stimuli.( 19 , 20 )
Compared to the Per1 and Per2 genes, fewer studies have been carried out to demonstrate the specific functional role of Per3 in the circadian system. Mouse Per3 RNA levels have been shown to oscillate in the SCN and eyes but are not altered acutely by light exposure at different times during subjective night in SCN.( 20 ) In mPer3 targeted disrupted mice, the mPer1, mPer2, mCry1 and Bmal1 RNA rhythms in the SCN did not differ from those in wild‐type mice.( 21 ) In Per1/Per3 and Per2/Per3 double‐mutant mice, the behavioral rhythms of these mice were similar to the rhythms of mice with disruption of Per1 and Per2 alone, respectively.( 21 ) Although the mPer3 gene seems to play a less critical role in the generation of circadian oscillation in mice, it appears that it is involved in the process of adjusting the phase of the oscillator.( 20 ) In humans, the exact functions of PER3 remain unknown.
Disruption of circadian rhythms has a profound influence on human health and has been associated with cancer.( 22 , 23 , 24 , 25 ) Because asynchrony of cell proliferation between normal and malignant tissues is commonly observed, it may imply that maintaining the circadian clock is important in tumor suppression. In the present study, we explore the possible roles of circadian genes in the development of human chronic myeloid leukemia (CML).
Materials and Methods
Samples and patients. Peripheral blood (PB) samples were collected from healthy adults and CML patients from July 1999 through August 2003. In order to rule out the bias of time, collection of all PB samples was carried out between 8:00 AM and 11:00 AM. All of the PB samples were processed within 1 h of collection. Ammonium chloride lysis buffer (150 mM NH4Cl, 10 mM KHCO3, 0.1 mM ethylenediaminetetracetic acid) was used to deplete red blood cells (RBC) from PB. Total RNA and genomic DNA were extracted from total leukocytes by standard procedures, as described previously.( 26 , 27 ) Patients who were included in the chronic‐phase group carried less than 30% of blast cells in the bone marrow (10.39 ± 1.39%, n = 19) and those who were included in the blastic crisis group carried over 30% of blast cells in the bone marrow (44.89 ± 6.66%, n = 16). This study was approved by the Institute Review Board of the Kaohsiung Medical University Hospital.
Real‐time quantitative reverse transcription–polymerase chain reaction analysis. The cDNA sequences of the nine circadian genes were evaluated, and the specific forward and reverse primers and TaqMan probe were designed using Primer Express software version 1.5 (Applied Biosystems, Foster City CA, USA). Probes designed by the software were synthesized and labeled with appropriate fluorescent dyes (Applied Biosystems). Sequences of the forward and reverse primers and probe are listed in Table 1. Expression of glyceraldehyde‐3‐phosphate dehydrogenase (GAPDH) was also examined by real‐time reverse transcription–polymerase chain reaction (RT‐PCR) as the RNA internal control. The amount of circadian gene was normalized to the endogenous reference GAPDH to obtain the relative threshold cycle (ΔCT), and then related to the ΔCT of healthy adult cases to obtain the relative expression level (2−ΔΔCT) of circadian genes.
Table 1.
Oligonucleotide primers and probes for real‐time quantitative reverse transcription–polymerase chain reaction analysis of the nine circadian genes
| Gene | GenBank accession no. | Amplicon size (bp) | Direction | Sequence | Location |
|---|---|---|---|---|---|
| PER1 | AF022991 | 102 | F | 5′‐CAT CAC GTC TGA GTA CAC ACT TCA GA‐3′ | 808–833 |
| P | 5′‐CGA ATC GTC TAC ATT TC‐3′ | 875–891 | |||
| R | 5′‐AGG ACG GCT GCC TGC TC‐3′ | 893–909 | |||
| PER2 | NM_003894 | 98 | F | 5′‐TCC AGA TAC CTT TAG CCT GAT GA‐3′ | 353–375 |
| P | 5′‐CCA TCT ACA AGT GGC TGC‐3′ | 396–413 | |||
| R | 5′‐TTT GTG TGT GTC CAC TTT CGA‐3′ | 429–449 | |||
| PER3 | NM_016831 | 94 | F | 5′‐ACA AAC AGA ACC ACA AGG CA‐3′ | 1893–1912 |
| P | 5′‐CTT ACA AGC TGG TTT GC‐3′ | 1927–1943 | |||
| R | 5′‐CGT CCA TTT GTT GGC ATT T‐3′ | 1986–1968 | |||
| CRY1 | NM_004075 | 91 | F | 5′‐AGA ACA GAT CCC AAT GGA GAC T‐3′ | 1847–1868 |
| P | 5′‐TAT CAG GCG TTA TTT GCC TGT‐3′ | 1830–1830 | |||
| R | 5′‐GTG CAT TCC AGG GAT CAT AGA‐3′ | 1917–1937 | |||
| CRY2 | XM_051030 | 86 | F | 5′‐CCT CCT CAG TCG GGA TCA A‐3′ | 231–249 |
| P | 5′‐CGA TGG AGG TTC CTA C‐3′ | 251–266 | |||
| R | 5′‐GCG GGA GTT CAG TTT CCT TA‐3′ | 297–316 | |||
| CLOCK | AF011568 | 107 | F | 5′‐CAA CGC ACA CAT AGG CCA T‐3′ | 1069–1087 |
| P | 5′‐CAG GTT AGC TAC ACC TCA G‐3′ | 1122–1140 | |||
| R | 5′‐TTG GGT TCT TCA ACA GTG CA‐3′ | 1156–1175 | |||
| BMAL1 | D89722 | 97 | F | 5′‐CAT GCA ACG CAA TGT CCA G‐3′ | 318–336 |
| P | 5′‐CTG TGC TAA GGA TGG CT‐3′ | 354–370 | |||
| R | 5′‐GTG TAT GGA TTG GTG GCA CCT‐3′ | 394–414 | |||
| CKI∈ | NM_152221 | 110 | F | 5′‐AGG TCC TCT GCA AAG GCT ATC C‐3′ | 945–966 |
| P | 5′‐CGA ATT CTC AAC ATA CCT CAA‐3′ | 970–990 | |||
| R | 5′‐GCG GAA GAG CTG ACG TAG GTA A‐3′ | 1033–1054 | |||
| TIM | NM_003920 | 97 | F | 5′‐CAG CAC CAC CAG GAC AAG C‐3′ | 353–371 |
| P | 5′‐CTG ATG GTG AAC TTG ACA C‐3′ | 395–413 | |||
| R | 5′‐GCA GAT TGC CAA AAC AGA GCA‐3′ | 423–443 |
F, forward; P, probe; R, reverse.
Reverse transcription was carried out in a final volume of 25 µL containing 2 µg RNA, 0.5 µg random primers (10‐mers), 2 mM dNTPs, 25 IU RNasin (Promega, Madison, WI, USA), 50 mM Tris‐HCl (pH 8.3), 75 mM KCl, 3 mM MgCl2 and 200 IU Moloney Murine Leukemia Virus reverse transcriptase (Promega). The reaction was first denatured for 5 min at 70°C and incubated at 37°C for 60 min, then stopped by heat inactivation at 95°C for 5 min
Real‐time quantitative PCR was carried out in an ABI 7700 Sequence Detector (Applied Biosystems) using the TaqMan Universal PCR Master Mix protocol (Applied Biosystems). All reactions were carried out in a 25‐µL final volume containing 400 nM each primer, 200 nM probe and 12.5 µL 2× TaqMan Universal PCR Master Mix. The PCR cycling parameters were set as follows: 95°C for 10 min followed by 40 cycles of PCR reactions at 95°C for 20 s and 60°C for 1 min.
To determine the interassay precision, four replicates of cDNA of each sample were run on four separate days. Intra‐assay (within‐run) precision was determined by calculating mean, standard deviation (SD) and coefficient of variance (CV) of the CT values for each sample and for each set of primers and probe on each day.
Methylation‐specific PCR. Bisulfite treatment of genomic DNA was carried out using the CpGenome DNA modification kit (Chemicon International, Temecula, CA, USA) according to the manufacturer's instructions. Briefly, genomic DNA (1 µg in a volume of 100 µL) was denatured in 0.2 M NaOH at 37°C for 10 min and incubated with 3 M sodium bisulfite at 50°C for 16 h. After bisulfate treatment, DNA was desulfonated, ethanol‐precipitated, washed, and resuspended in 50 µL of water and used immediately or stored at −20°C until use.
Bisulfite‐modified DNA was amplified by PCR using primer sets designed specific for the promoter regions of hPER1, hPER2, hPER3, hCRY1, hCRY2 and BMAL1, as listed in Table 2. PCR was carried out in a 50‐µL final volume containing 200 nM each primer, 200 µM each dNTP, 1.5 mM MgCl2, 2 IU Taq DNA polymerase (Promega) and 1× PCR buffer. The amplification procedure was carried out as follows: 95°C for 10 min followed by 40 cycles of PCR reactions at 95°C for 1 min, ∼55°C−65°C [depending on the melting temperature (Tm) of each primer set] for 30 s and 72°C for 30 s. The PCR products were analyzed by agarose gel electrophoresis and visualized by ethidium bromide staining with a 100‐bp ladder as a reference.
Table 2.
Oligonucleotide primers used for methylation‐specific polymerase chain reaction for the promoter regions of hPER1, hPER2, hPER3, hCRY1 and hCRY2
| Gene | Location | Annealing temperature (°C) |
|---|---|---|
| PER1 | ||
| PER2‐M (amplicon size, 298 bp; location, −1879 to −1582) | ||
| Forward: 5′‐ATT TAG GTT TAC GTG CGT TC‐3′ | −1879 to −1860 | 56 |
| Reverse: 5′‐CGA CTC AAA AAC GAA AAT CG‐3′ | −1582 to −1601 | |
| PER1‐U (amplicon size, 318 bp; location, −1889 to −1572) | ||
| Forward: 5′‐TAG TAT TAG TAT TTA GGT TTA TGT GTG TTT‐3′ | −1889 to −1860 | 56 |
| Reverse: 5′‐AAC AAC AAT CCA ACT CAA AAA CAA AAA TCA‐3′ | −1572 to −1601 | |
| PER2 | ||
| PER2‐M (amplicon size, 140 bp; location, −178 to −39) | ||
| Forward: 5′‐GCG GTT TCG TTG CGG TTT AT‐3′ | −178 to −159 | 62 |
| Reverse: 5′‐GCC GAC GCC GTT TCA AAC CG‐3′ | −39 to −58 | |
| PER2‐U (amplicon size, 160 bp; location, −188 to −29) | ||
| Forward: 5′‐GTG GTG TGG TGT GGT TTT GTT GTG GTT TAT‐3′ | −188 to −159 | 58 |
| Reverse: 5′‐ACA CCC CCA CAC CAA CAC CAT TTC AAA CCA‐3′ | −29 to −58 | |
| PER3 | ||
| PER3‐M (amplicon size, 182 bp; location, −281 to −453) | ||
| Forward: 5′‐CGG GAG TTT TGG GTA TTC GC‐3′ | −453 to −444 | 56 |
| Reverse: 5′‐CGA CCC GAC TAA CTA AAA CG‐3′ | −281 to −301 | |
| PER3‐U (amplicon size, 207, location, −269 to −465) | ||
| Forward: 5′‐TGG GTG GTT GGG TGG GAG TTT TGG GTA TTT GT‐3′ | −465 to −444 | 56 |
| Reverse: 5′‐AAT CCA ACA CCA ACA ACC CAA CTA ACT AAA ACA‐3′ | −269 to −301 | |
| CRY1 | ||
| CRY1‐M (amplicon size, 166 bp; location, −420 to −255) | ||
| Forward: 5′‐TCG TTT TGT TTT TAG GGG TC‐3′ | −420 to −401 | 56 |
| Reverse: 5′‐GCA ACC GCC TAA AAA CGA CG‐3′ | −255 to −274 | |
| CRY1‐U (amplicon size, 187 bp; location, −432 to −246) | ||
| Forward: 5′‐ATT TTG GGT GGG TTG TTT TGT TTT TAG GGG TT‐3′ | −432 to −401 | 65 |
| Reverse: 5′‐ACA CCC ACC ACA ACC ACC TAA AAA CAA CA‐3′ | −246 to −274 | |
| CRY2 | ||
| CRY2‐M (amplicon size, 150 bp; location, −308 to −159) | ||
| Forward: 5′‐GTT TAT TTT CGG TAT TTC GC‐3′ | −308 to −289 | 55 |
| Reverse: 5′‐TAA CGA TTA ACC CAA AAA CG‐3′ | −159 to −178 | |
| CRY2‐U (amplicon size, 171 bp; location, −318 to −148) | ||
| Forward: 5′‐TTG AGA TTT GGT TTA TTT TTG GTA TTT TGT‐3′ | −318 to −289 | 56 |
| Reverse: 5′‐TAC CTT CCA CCT AAC AAT TAA CCC AAA AAC A‐3′ | −149 to −178 | |
| BMAL1 | ||
| BMAL1‐M (amplicon size, 138 bp; location, 30–167) | ||
| Forward: 5′‐GGA GGT GTT TGT TTA TTC GC‐3′ | 30 to 39 | 58 |
| Reverse: 5′‐AAA TAC GCG AAA TCG CGT CG‐3′ | 153 to 167 | |
| BMAL1‐U (amplicon size, 161 bp; location, 18–178) | ||
| Forward: 5′‐TAG GTT AGG GAT GGA GGT GTT TGT TTA TTT GT‐3′ | 18 to 39 | 60 |
| Reverse: 5′‐AAC CCC CAA CAA AAT ACA CAA AAT CAC ATC A‐3′ | 153 to 178 | |
The locations indicated are base numbers corresponding to the transcriptional start sites of the circadian genes.
CpG methylase (SssI)‐treated and sodium bisulfite‐modified genomic DNA was used as a positive control for methylation‐specific primers M (PER1‐M, PER2‐M, PER3‐M, CRY1‐M, CRY2‐M, BMAL1‐M), as CpG methylase methylates all cytosines within the double‐stranded dinucleotide CG. DNA samples from healthy individuals that were negative for the M primer set and positive for the U primer set (PER1‐U, PER2‐U, PER3‐U, CRY1‐U, CRY2‐U, BMAL1‐U) were used as positive controls for U primers. To ensure the specificity of M and U primer sets for bisulfite‐modified DNA, amplification using unmodified genomic DNA samples from healthy individuals and CML patients was also carried out.
To calculate the numbers of methylated CpG sites, direct sequencing using both forward and reverse primers was carried out for each sample. DNA sequencing was performed using an ABI Prism 310 Genetic Analyzer and BigDye Terminator Cycle Sequencing Kits Version 1.1 (Applied Biosystems) and the manufacturer's protocols were followed for the reactions.
Analysis of hPER3 mutation. Polymerase chain reaction was carried out using primers for amplification of the 21 exons of hPER3 as listed in Table 3. PCR was carried out in a 25‐µL final volume containing 200 nM each primer, 200 µM each dNTP, 3.5 mM MgCl2, 2 IU Taq DNA polymerase (Promega), and 1× PCR buffer. The amplification procedure was as follows: 35 cycles of PCR reactions at 95°C for 1 min, 58–65°C (depending on the Tm of each primer set) for 1 min and 72°C for 2 min. Direct sequencing of the PCR products of each amplicon was carried out using an ABI Prism 310 Genetic Analyzer and BigDye Terminator Cycle Sequencing Kit Version 1.1 (Applied Biosystems) and the manufacturer's protocols were followed for the reactions.
Table 3.
Oligonucleotide primers for amplification of the human PER3 gene
| Region | Forward primer (5′→3′) | Location | Reverse primer (5′→3′) | Location | Size (bp) | Annealing temperature (°C) |
|---|---|---|---|---|---|---|
| Promoter | tgtcacccttgtctcctccc | 506–525 | catctcgaggtctccgcg | 740–757 | 252 | 58 |
| Exon 1 | aagtgagcgagaagcaggct | 691–710 | gatttaggtccccctttccct | 939–959 | 269 | 60 |
| Exon 2 | tgttccctaagccgcaaga | 1311–1329 | ggtgcattcgtaggatgaaatttc | 1480–1503 | 253 | 60 |
| Exon 3 | agatactgttgtcactggactacctgtt | 2550–2577 | cacccaggttgatatggcaaa | 2730–2750 | 201 | 60 |
| Exon 4 | actggtcatgttagagatccagaaga | 3826–3851 | catctgaacattggtcctgttacct | 4122–4146 | 321 | 60 |
| Exon 5 | gagggagtgactgaccaggc | 9800–9819 | ccactgttgctggcttcca | 9903–9921 | 122 | 60 |
| Exon 6 | gtagggtgcgtcaggaccag | 14358–14377 | tgattgctgacatttctgcatct | 14566–14588 | 231 | 60 |
| Exon 7 | aatatgttaagtggttagttaggtgga | 16912–16938 | tcaaataggcaaatggacagat | 17171–17192 | 281 | 60 |
| Exon 8 | acctgatgagtatgccacctgtg | 18882–18904 | tgcctctctggttaaaggttgc | 19111–19132 | 251 | 60 |
| Exon 9 | aggacatttgtaatcagtatctgtgttaa | 19506–19534 | gctaaggaatattatttgatacaagagatg | 19757–19786 | 281 | 60 |
| Exon 10 | tgactcagtctctcactgggc | 24740–27760 | tgtgaagtgaatttactgagcattaa | 24925–24950 | 211 | 60 |
| Exon 11 | agccagcaattctggacttgtt | 25731–25752 | cattcagaaccgaggtagtacagaaa | 25939–25964 | 234 | 58 |
| Exon 12 | tatcattcctttccctaagatgacct | 26296–26321 | cagagagtgacagcccatgga | 26497–26517 | 222 | 56 |
| Exon 13 | aattgcacatccctttattctgtttc | 35134–35159 | agtctctacagtggcagtgtatgctt | 35340–35365 | 232 | 60 |
| Exon 14 | gcacaattagggaacaggtaagaat | 35942–35966 | aggtaatatgaaaccagaattttatgc | 36241–36266 | 287 | 60 |
| Exon 15 | agtttctcttacaccaccagctg | 36324–36346 | cgagcgaatggtattcatgact | 36584–36605 | 282 | 60 |
| Exon 16 | tatgtcttcttccacctcagcc | 42337–42358 | tcctagtccttagatacagtttgtaacattta | 42626–42657 | 321 | 58 |
| Exon 17–1 | ctctacctttatccttccaggagat | 42975–42999 | cgacaacagaggacagacagg | 43396–43416 | 442 | 60 |
| Exon 17–2 | cccttttccttacttggatactttt | 43347–43371 | actttagtaagatattcactttctcacttga | 43717–43747 | 401 | 56 |
| Exon 18 | ctgtattttgtgataagaagattaaagtgtc | 45656–45686 | ggcattggagtttgaaacattagt | 46055–46078 | 423 | 56 |
| Exon 19 | gactgtccgaggcaagagtc | 51546–51565 | ggcagaagaatcgcttgaac | 51971–51989 | 444 | 65 |
| Exon 20 | gctattcctagatgacgggaaa | 52802–52824 | ctacctggccaaaatacatgagt | 53055–53077 | 276 | 60 |
| Exon 21 | tttagaaacatgtgaccagcctt | 58458–58480 | gtctgtgtaacacgtcttggaaag | 58660–58683 | 226 | 58 |
The locations indicated are base numbers according to the human PER3 gene sequence (GenBank accession number NT_021937, region 1971241.2032500).
Subcloning of methylation‐specific PCR products. Bisulfite‐modifed DNA was amplified by PCR using a universal primer set designed for detection of both methylated and unmethylated promoter regions of hPER3 as follows: PER3‐MU (forward), 5′‐GTT AAG GGC GGG GGT AGT AGG T‐3′ (−520 to −510 to the transcriptional start site of the hPER3 gene); and PER3‐MU (reverse), 5′‐CTC GCT CGA CTT TCA AAA CTC‐3′ (−200 to −220 to the transcriptional start site of the human hPER3 gene). The amplification area corresponded to −220 to −520 to the transcriptional start site of the hPER3 gene. PCR was carried out as described for methylation‐specific PCR. Cloning reactions were used the TOPO TA cloning kit version K2 (Invitrogen, Groningen, the Netherlands). Briefly, PER3‐MU products were first purified before the addition of 3′ A‐overhangs by incubation in 1 IU Taq and 2.5 mM dATP at 72°C for 10 min. They were then put on ice. PCR products with A‐overhangs were incubated with vectors at room temperature for 30 min and then put on ice. The reaction mixture was added to TOPO‐competent cells and incubated on ice for 20 min and then at 42°C for 30 s to heat shock the competent cells. They were then put on ice immediately. The mixture was added to 250 µL SOC (2% bacto‐tryptone, 0.5% bacto‐yeast extract, 0.05% NaCl, and 20 mM glucose) medium and shaken horizontally at 37°C for 1 h. After shaking, the mixture was plated out on agar plates containing X‐gal and 50 µg/mL ampicillin. After overnight incubation, the plasmid DNA was extracted from competent cells using QIApre Spin Miniprep Kit (Qiagen, Hilden, Germany) and digested with EcoRI to examine whether the plasmid DNA contained the correct insert. The plasmid DNA containing the correct insert was sequenced using SP6, T7 or PER3‐MU primers on an ABI prism 310 Genetic Analyzer.
Tissue culture and demethylation studies. K562 cells were maintained in RPMI‐1640 medium (Gibco, Carlsbad, CA, USA) supplemented with 10% heat‐inactivated fetal calf serum (Gibco), 100 IU/mL penicillin (Gibco) and 100 µg/mL streptomycin (Gibco), and grown at 37°C with 5% CO2. Cells were plated at 106 cells/100‐mm dish and treated the next day with 5‐aza‐2′‐deoxycytidine (Sigma, St Louis, MO, USA) at a final concentration of 10−6 M, and/or Trichostatin A (Sigma) at a final concentration of 10−7 M for 5 days. The treated cells were harvested after 1, 2, 3, 4 and 5 days of treatment for real‐time quantitative RT‐PCR and methylation‐specific PCR analysis as described above.
Statistics. Comparisons were made with the t‐test using SPSS for Windows Release 9.0 (SPSS, Chicago, IL, USA). P‐values <0.01 was regarded as being significantly different.
Results
Determination of circadian gene expression level by real‐time quantitative RT‐PCR. To investigate whether the expression of the nine circadian genes was downregulated in CML patients, we analyzed PB from 53 healthy individuals and 35 CML patients (19 in blastic crisis and 16 in chronic phase) using real‐time quantitative RT‐PCR. The results showed that the expression levels of the hPER1, hPER2, hPER3, hCRY1, hCRY2 and hBMAL1 genes in CML patients were significantly impaired compared with those in healthy individuals. Furthermore, the degrees of downregulated expression of these six genes were correlated to these CML patients’ clinical phases, that is, blastic crisis < chronic phase < healthy individuals (Table 4).
Table 4.
The expression levels of the nine circadian genes were determined by real‐time quantitative reverse trasncription–polymerase chain reaction
| Variable | Healthy individuals | CML | |
|---|---|---|---|
| Chronic phase | Blastic phase | ||
| n | 53 | 19 | 16 |
| PER1 | |||
| ΔCT (PER1‐GAPDH) | 4.19 ± 0.36 | 7.48 ± 0.67 † | 9.95 ± 0.70 † |
| Relative expression | 1 | 1/9.7 | 1/27.0 |
| PER2 | |||
| ΔCT (PER2‐GAPDH) | 4.39 ± 0.18 | 6.79 ± 0.47 † | 8.87 ± 1.02 † |
| Relative expression | 1 | 1/5.3 | 1/22.3 |
| PER3 | |||
| ΔCT (PER3‐GAPDH) | 7.16 ± 0.27 | 12.34 ± 0.87 † | 19.60 ± 1.26 † |
| Relative expression | 1 | 1/36.2 | 1/5544.7 |
| CRY1 | |||
| ΔCT (CRY1‐GAPDH) | 6.75 ± 0.26 | 9.33 ± 0.56 † | 12.15 ± 1.60 † |
| Relative expression | 1 | 1/6.0 | 1/42.2 |
| CRY2 | |||
| ΔCT (CRY2‐GAPDH) | 3.67 ± 0.33 | 6.79 ± 0.53 † | 7.80 ± 0.90 † |
| Relative expression | 1 | 1/8.7 | 1/17.6 |
| CLOCK | |||
| ΔCT (CLOCK‐GAPDH) | 9.38 ± 0.89 | 10.57 ± 1.26 | 13.65 ± 1.52 |
| Relative expression | 1 | 1/2.3 | 1/19.3 |
| BMAL1 | |||
| ΔCT (BMAL1‐GAPDH) | 2.12 ± 0.20 | 3.73 ± 0.44 † | 5.00 ± 0.62 † |
| Relative expression | 1 | 1/3.1 | 1/7.4 |
| CK1ɛ | |||
| ΔCT (CK1ɛ‐GAPDH) | 4.49 ± 0.19 | 2.69 ± 0.80 | 4.46 ± 0.63 |
| Relative expression | 1 | 1/0.29 | 1/0.98 |
| TIM | |||
| ΔCT (TIM‐GAPDH) | 6.89 ± 0.29 | 5.07 ± 0.84 | 7.36 ± 0.63 |
| Relative expression | 1 | 1/0.28 | 1/1.38 |
P < 0.001 compared with normal. Results are the mean ± SE. The level of circadian gene was normalized to the endogenous reference glyceraldehyde‐3‐phosphate dehydrogenase (GAPDH) to obtain the normalized circadian gene expression (ΔCT) value for each sample. The ΔCT of chronic myeloid leukemia cases was first related to the ΔCT of healthy individuals to obtain the relative threshold cycle (ΔΔCT) and then the relative expression levels (2−ΔΔCT) were calculated.
hPER3, but not hPER2 or hCRY1, was methylated at the promoter region in CML. To elucidate the possible mechanism for the downregulation of hPER1, hPER2, hPER3, hCRY1, hCRY2 and hBMAL1 in CML, we first analyzed the methylation status of the promoter area of these six genes. For each gene, we designed two pairs of methylation‐specific primers designated M and U to discriminate between methylated and unmethylated alleles and to discriminate between sodium bisulfite‐modified and unmodified DNA. The M and U primer sets were specific for methylated and unmethylated alleles, respectively; both primer sets were specific for bisulfite‐modified DNA but not for unmodified genomic DNA (Fig. 1). The results of methylation‐specific PCR demonstrated that CML patients were positive for all of the six U primers at both chronic phase and blastic crisis, but were only positive for PER2‐M and PER3‐M, not for PER1‐M, CRY1‐M, CRY2‐M or BMAL1‐M (Fig. 1). The CpG sites at the promoter area of the hPER3 gene were methylated in all of the CML cases, whereas the hPER2 gene was methylated in only 40% (14/35) of CML cases and most of the PER2‐M methylation‐specific PCR results were weak positive. As the promoter of the hPER3 gene was methylated in all of the CML cases, we further investigated the association between the downregulation and methylation status of the hPER3 gene. In Fig. 2, we show three representative cases with hPER3 expression levels higher at chronic phase and lower at blastic crisis (Fig. 2a). The methylation‐specific PCR results demonstrated that patients 1 and 2 were positive for PER3‐M and PER3‐U at both chronic phase and blastic crisis, whereas patient 3, with lower hPER expression levels, was positive for PER3‐M at both chronic phase and blastic crisis, and for PER3‐U at chronic phase, but negative for PER3‐U at blastic crises (Fig. 2b). The PER3‐U primer set covers 29 CpG sites and the PER3‐M primer set covers 25 CpG sites. PCR products of these primer sets were direct sequenced to calculate the number of methylated CpG sites (examples in Fig. 3). As shown in Table 5, no methylation was observed in normal individuals, whereas methylation was observed in all CML cases. Furthermore, the methylated CpG frequencies of the PER3 gene did differ in patients at blastic crisis and at chronic phase of CML (CpG, 8.24 ± 0.73 vs 4.48 ± 0.48, P < 0.001; T/CpG, 10.47 ± 0.67 vs 14.67 ± 0.46, P < 0.001). Figure 4 shows the allelic patterns of CpG island methylation of chronic phase and blastic crisis in a representative CML case (patient 3 in Fig. 2). In this representative case, clones from chronic phase were methylated at only some of the CpG sites (Fig. 4a), whereas clones from blastic crisis were methylated at most CpG sites (Fig. 4b). Interestingly, we found that two CML cases with nearly undetectable hPER3 expression were strongly positive for PER3‐M but negative for PER3‐U (Fig. 4c). The allelic patterns of CpG site methylation in these two patients also showed that most of the clones were fully methylated at all of the CpG sites (Fig. 4d).
Figure 1.
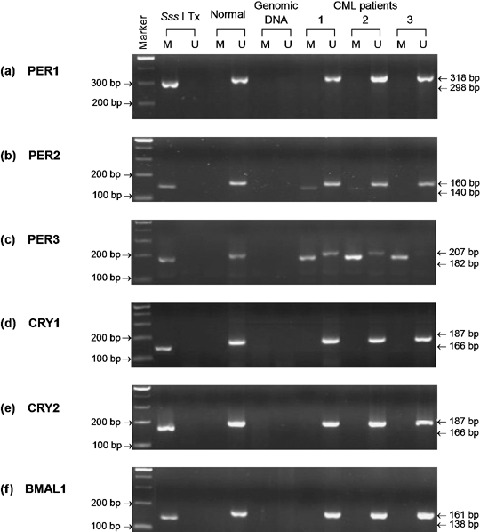
Methylation‐specific PCR of hPER1, hPER2, hPER3, hCRY1, hCRY2 and hBMAL1 genes. Methylation‐specific PCR of hPER1 (a), hPER2 (b), hPER3 (c), hCRY1 (d), hCRY2 (e), and hBMAL1 (f). Sss I Tx is Sss I‐treated, bisulphite‐modified DNA of a normal individual. This DNA sample was used as a positive control for methyltaion‐specific primers. Normal is bisulphite‐modifed DNA of the same normal individual as in lane Sss I Tx. Genomic DNA is unmodified genomic DNA of a CML patient. M and U indicate methylation‐specific PCR using Methylation‐specific and Unmethylation‐specific primer sets, respectively. CP and BC indicate chronic phase and blastic crisis of CML, respectively. Marker represents the 100‐bp ladder DNA marker.
Figure 2.

hPER3 gene expression and methylation‐specific PCR. (a) hPER3 gene expression levels of three representative CML cases as measured by real‐time quantitative RT‐PCR. In the same CML patient, hPER3 expression level was higher at chronic phase and was lower at blastic crisis. (b) Methylation‐specific PCR of PER3. M and U indicate methylation‐specific PCR using PER3‐M and PER3‐U primer sets, respectively. CP and BC indicate chronic phase and blastic crisis of CML, respectively. Marker represents the 100‐bp ladder DNA marker. Patients 1, 2, and 3 correspond to the same patients in (a).
Figure 3.

Examples of methylation analysis of CpG islands at the promoter area of hPER3 gene. The sequence shown corresponds to the ‐336~‐389 to the transcriptional start site of hPER3 gene. (a) The cytosines remains intact in the Sss I‐treated, sodium bisulphate‐modified DNA. (b) All the cytosines convert to thymines in a PER3‐U positive case. (c) A CML patient showed significantly reduced expression of hPER3 with all the Cs in CpG dinucleotides remains as C in the sodium bisulphate‐modified DNA. (d) and (e) CML patients showed different levels of reduced hPER3 expression, and their modified DNA showed some methylated CpG sites C and some partially methylated C/T.
Table 5.
hPER3 gene expression levels and methylated CpG frequencies at the promoter area in healthy individuals and CML patients. hPER3 gene expression was determined by real‐time quantitative RT‐PCR. The amount of hPER3 was normalized to the endogenous reference GAPDH to obtain the ΔCT value for each sample. The normalized hPER3 expression (ΔCT) of CML cases was first related to the ΔCT of healthy individuals to obtain the relative threshold cycle (ΔΔCT) and then the relative expression levels (2−ΔΔCT) were calculated. In methylation study, all the normal cases are positive for the unmethylation‐specific PCR and all the CML cases are positive for methylation‐specific PCR. The number of CpG and T/Cp G were calculated from direct sequencing results of PER3‐M or PER3‐U PCR products of bisulfite‐modified DNA
| n | Real‐time quantitative RT‐PCR | Methylation study | |||||
|---|---|---|---|---|---|---|---|
| ΔCT(PER3‐GAPDH) | ΔΔCT(CML‐Normal) | Relative Expression | Methylation rate | No. of CpG | No. of T/Cp G | ||
| Healthy individuals | 53 | 7.16 ± 0.27* | 1 | 0/53 (0%) | 0 | 0 | |
| CML | |||||||
| Blastic crisis | 19 | 19.60 ± 1.26 † | 12.44 | 1/5544.7 | 19/19 (100%) | 8.24 ± 0.73 ‡ | 10.47 ± 0.67 ‡ |
| Chronic phase | 16 | 12.34 ± 087 † | 5.18 | 1/36.20 | 16/16 (100%) | 4.48 ± 0.48 | 14.67 ± 0.46 |
Results are the mean ± SE.
P < 0.001 when compared with healthy individuals.
P < 0.001 when compared with chronic phase.
Figure 4.

Allelic patterns of CpG sites methylation at the promoter area of hPER3 gene. Methylation of the hPER3 CpG island located between positions ‐269 and ‐465 corresponding to the transcriptional starting site was examined by genomic bisulfite sequence analysis. Ten clones were randomly selected and sequenced. Methylated CpG sites are marked as filled circles (•) and unmethylated sites as open circles (○). (a) The allelic patterns of chronic phase of patient 3 in Fig. 3. (b) The allelic patterns of blastic crisis of patient 3 in Fig. 3. (c) Methylation‐specific PCR of two CML cases (patient 4 and patient 5) with nearly undetectable hPER3 expression. They are positive for PER3‐M but are negative for PER3‐U primer sets. M and U indicate methylation‐specific PCR using PER3‐M and PER3‐U primer sets, respectively. (d) The allelic patterns of CpG sites methylation of hPER3 gene of patient 5.
hPER3 expression was not downregulated by mutations within the coding region of hPER3 in CML. To investigate whether the genetic aberration is also a possible mechanism responsible for the downregulation of hPER3 in CML, we carried out mutational analysis on the coding region of hPER3 using PCR and direct sequencing. However, no mutation was found in any of the CML cases (data not shown). The results of gene mutational analysis suggested that mutations in the coding regions were not responsible for the downregulation of hPER3 gene expression in CML.
Demethylation‐associated reactivation of hPER3 expression in CML cell line K562. As reversibility is a hallmark of epigenetic transcriptional repression, demethylation studies were carried out. We treated hypermethylated CML cells (K562) with 5‐aza‐2′‐deoxycytidine and/or Trichostatin A to attempt demethylation of the hPER3 gene over a 5‐day exposure period. As shown in Fig. 5a, hPER3 expression was increased after a 2‐day incubation with 1 µM 5‐aza‐2′‐deoxycytidine, 100 nM Trichostatin A, or combined treatment and persisted to 5 days after treatment, as determined by real‐time quantitative RT‐PCR. Methylation‐specific PCR results also showed a time‐dependent decrease in the intensities of PER3‐M PCR products and a increase of intensities of PER3‐U PCR products (Fig. 5b). However, the increase in hPER3 expression was insignificant and was not restored to the levels of normal healthy individuals. The results demonstrated that 5‐aza‐2′‐deoxycytidine, Trichostatin A, or combined treatment partially reactivate PER3 expression in K562 cells.
Figure 5.

Demethylation studies using K562 cells treated with 5‐aza‐2′‐deoxycytidine and/or Trichostatin A. 106 cells were treated with 1 µM 5‐aza‐2′‐deoxycytidine or/and 100 nM Trichostatin A for 1, 2, 3, 4, and 5 days respectively then harvested for hPER3 expression and methylation‐specific PCR analysis. (a) hPER3 gene expression levels in K562 cells were increased after 5‐aza‐2′‐deoxycytidine, Trichostatin A, and combined treatments for two days and persisted for 5 days as determined by real‐time quantitative RT‐PCR. Data are presented as folds increased compared to untreated K562 cells. Each data point was calculated from 3 duplicate studies. (b) Methylation‐specific PCR of PER3‐M and PER3‐U of K562 cells after 5‐aza‐2′‐deoxycytidine treatment. PER3‐M PCR products showed a time‐dependent decrease of intensities and PER3‐U PCR products showed a slight increase of intensities. Marker represents the 100‐bp ladder DNA marker.
Discussion
In the present study, we analyzed the expression levels of the nine circadian genes. We found that only six genes (hPER1, hPER2, hPER3, hCRY1, hCRY2 and hBMAL1) were expressed at lower levels in cells from CML patients compared with those from healthy individuals (Table 1). In addition, the downregulated expression of these six genes in cells from CML patients was also correlated with the patients’ clinical phases, that is, blastic crisis < chronic phase < normal. These results suggested that the disturbance of circadian gene expression may play a role in the development of human CML.
CpG methylation has been shown to inactivate promoter function, leading to abolishment of gene expression.( 28 ) In human hematological malignancies, aberrant methylation of normally unmethylated CpG islands is associated with transcriptional inactivation of defined tumor suppressor genes, such as DAP‐kinase and SOCS1 (suppressor of cytokine signaling‐1) in acute myeloid leukemia,( 29 ) Kruppel‐like factor 4 (KLF4) gene and early growth response 3 (EGR3) gene in adult T‐cell leukemia,( 30 ) SOCS‐1, p16 and E‐cadherin in multiple myeloma,( 31 ) SOCS1 in CML,( 32 ) and p21 (CIP1/WAF1/SDI1) in acute lymphoblastic leukemia.( 33 ) Interestingly, our results showed that among the six downregulated circadian genes in CML patients, promoter CpG‐site hypermethylation was found only in hPER2 and hPER3 (Fig. 1). In addition, there was a strong association between the methylation frequency of hPER3 and the clinical phases of CML (Table 5). Because no genetic alterations were found within the coding regions of the hPER3 genes in any of the CML patients, our data suggested that mutation or deletion was irrelevant to the downregulation of hPER3. Instead, CpG‐site methylation at the promoter area contributed to the hPER3 gene downregulation in CML patients. Furthermore, the promoter CpG‐site hypermethylation of hPER3 found in CML patients was absent in normal individuals, suggesting that it may be useful as a cancer‐specific marker. Therefore, we suggest that downregulation of the hPER3 gene in CML is partly due to promoter methylation, or as a result of deregulation of other circadian proteins, or disruption of the signal transduction pathway or the cell cycle influencing hPER3 expression. It was reported that mice deficient in the mPer2 gene were cancer prone, and these mice showed a markedly increased rate of tumor development, with the author suggesting that mPer2 is a tumor suppressor gene.( 17 ) In the present study we found that only 40% of the CML cases were hypermethylated at the promoter CpG site of hPER2 and the methylation‐specific PCR results were quite weak. Taken together, we suggest that hPER3 inactivation may play a more important role in the development of CML.
As the hallmark of epigenetic transcriptional suppression is reversibility, we attempted to reverse the hypermethylated status of the CML cells K562 by treatment with 5‐aza‐2′‐deoxycytidine and/or Trichostatin A. In all of the three different treatments, increased hPER3 gene expression was observed after 2 days and carried on for at least 5 days. Decreased intensities of PER3‐M PCR products and slightly increased intensities of PER3‐U PCR products were also observed. Results from our demethylation studies of K562 cells have demonstrated that the loss of hPER3 gene expression is caused mainly by CpG‐site methylation at the promoter area. In a previous study, it was demonstrated that transcription from densely methylated promoters can only be partially restored by 5‐aza‐2′‐deoxycytidine treatment but can be enhanced by cotreatment with an inhibitor of histone deacetylase;( 34 ) the same phenomenon was also observed in the present study. Our results also provided evidence for the theory that another mechanism, such as deacetylation change, also plays some role in the inactivation of CpG islands at the promoter area.
The PER1, PER2 and PER3 genes belong to the same Period gene family. PER1 and PER2 are important in regulating the circadian clock,( 3 , 17 , 25 ) but the exact role of PER3 has not been well described. It has been suggested that the three mPer genes have distinct functions in the SCN circadian clock,( 35 , 36 ) and mPer1 and mPer2, but not mPer3, play critical roles within the core circadian feedback loop. However, a recent study has shown that the hPER1, hPER2, hPER3 and hDec1 genes are expressed in a similar circadian manner in human PB mononuclear cells, with the peak level occurring during the habitual time of activity,( 37 ) suggesting that the oscillation of hPER3 may also be an essential factor in maintaining circadian rhythm. Besides, downregulation of the hPER1, hPER2 and hPER3 genes has also been observed in breast cancer in a recent study.( 38 ) The fact that human CML patients exhibit decreased hPER3 levels by methylation of the CpG sites at the promoter, and the methylation frequencies are correlated with patients’ clinical phases, demonstrates the possibility that deregulation of multiple molecular pathways plays a role in the development of CML, caused by tissue‐specific hPER3 inactivation. In addition, our other studies showed that hPER3 expression declined both in acute myeloid leukemia and acute lymphoid leukemia patients (data not shown), suggesting that hPER3 is important in regulating and maintaining the circadian clock. It is also reasonable to hypothesize that deregulation of hPER3 is crucial in the development of leukemia, but its defined significance remains to be clarified.
It is believed that the t(9,22) chromosomal aberration is the initiating event in human CML. The t(9,22) translocation gives rise to fusion of the ABL and BCR genes and synthesis of a chimeric BCR–ABL p210 protein with deregulated tyrosine kinase activity. We assumed that the function of the PER1, PER2, PER3, CRY1, CRY2 and BMAL1 genes is located upstream of the activity of BCR–ABL. Therefore, when PER3 in chronic phase is further downregulated, the inhibition of BCR–ABL is weakened and thus allows the disease to further progress to blastic crisis. Genetic alteration (point mutations and chromosomal deletions) and epigentic alteration (aberrant methylation of the CpG islands in the promoter region) are considered to be the two major types of events involved in systemic gene inactivation. A recent study showed that structural variation of PER3 exon 18 is associated with increased risk of breast cancer among premenopausal women,( 39 ) suggesting genetic alteration as a possible reason for the altered PER3 function. However, hypermethylation of the gene promoter leading to abnormal silencing of transcription is also seen commonly in cancers.( 25 ) Evidence that the methylation frequency of CpG sites in the promoter region of PER3 is significantly higher in patients at blastic crisis compared with those in chronic phase supports the possible role of methylation in the downregulation of PER3 expression. Recently, Cardone et al. showed that the circadian clock may be controlled by sumoylation of BMAL1.( 40 ) Whether the sumoylation of BMAL1, or another circadian gene, plays a role in the disturbance of CML circadian rhythm needs to be studied further.
In conclusion, we have examined the expression of nine circadian genes in CML patients. Our data indicated that the expression of hPER1, hPER2, hPER3, hCRY1, hCRY2 and hBMAL1 was downregulated in CML, which correlated with the patients’ clinical phases. The downregulated expression of hPER1, hCRY1, hCRY2 and hBMAL1 was not owing to CpG‐site methylation at the promoter area. Further investigations will be made to clarify the mechanism responsible for the downregulated expression of these four genes. However, the downregulation was due predominantly to methylation of the hPER3 promoter and less significantly to other factors, such as deacetylation. The methylation frequencies were also correlated with the patients’ clinical phases. Therefore, we suggest that the downregulation of hPER3 may disrupt the circadian rhythm of leukemic cells and result in different circadian clock regulation compared with normal cells. Recently, it was shown that the circadian clock controls the expression of cell cycle‐related genes.( 41 ) The temporal expression of genes involved in cell cycle regulation and tumor suppression was also shown to be deregulated in mPer2 mutant mice.( 17 ) According to these results, we also suggest that downregulation of the circadian genes in CML may result in deregulation of the cell cycle, favoring proliferation of CML cells, and downregulation of the circadian genes may play a role in the development of CML by benefiting the survival and proliferation of tumor cells.
Acknowledgments
This study was supported by grants NSC92‐2314‐B‐037‐033, NSC93‐2314‐B‐037‐035 and NSC94‐2314‐B‐037‐005 from the National Science Council, Taiwan, and an internal grant from Kaohsiung Medical University Hospital, Taiwan.
References
- 1. Young MW, Kay SA. Time zones: a comparative genetics of circadian clocks. Nat Rev Genet 2001; 2: 702–15. [DOI] [PubMed] [Google Scholar]
- 2. Strayer CA, Kay SA. The ins and outs of circadian regulated gene expression. Curr Opin Plant Biol 1999; 2: 114–20. [DOI] [PubMed] [Google Scholar]
- 3. Reppert SM, Weaver DR. Coordination of circadian timing in mammals. Nature 2002; 418: 935–41. [DOI] [PubMed] [Google Scholar]
- 4. Roennebery T, Merrow M. Circadian clock–from genes to complex behavior. Reprod Nutr Dev 1999; 39: 277–94. [DOI] [PubMed] [Google Scholar]
- 5. Allada R, Emery P, Takahashi JS, Rosbash M. Stopping time: the genetics of fly and mouse circadian clocks. Annu Rev Neurosci 2001; 24: 1091–119. [DOI] [PubMed] [Google Scholar]
- 6. Wager‐Smith K, Kay SA. Circadian rhythm genetics: from flies to mice to humans. Nat Genet 2000; 26: 23–7. [DOI] [PubMed] [Google Scholar]
- 7. Weaver DR. The suprachiasmatic nucleus: a 25‐year retrospective. J Biol Rhythms 1998; 13: 100–12. [DOI] [PubMed] [Google Scholar]
- 8. Balsalobre A. Clock genes in mammalian peripheral tissues. Cell Tissue Res 2002; 309: 193–9. [DOI] [PubMed] [Google Scholar]
- 9. Sun ZS, Albrecht U, Zhuchenke O, Bailey J, Eichele G, Lee CC. RIGUI, a putative mammalian ortholog of the Drosophila period gene. Cell 1997; 90: 1003–11. [DOI] [PubMed] [Google Scholar]
- 10. Tei H, Okamura H, Shigeyoshi Y et al. Circadian oscillation of a mammalian homologue of the Drosophila period gene. Nature 1997; 389: 512–16. [DOI] [PubMed] [Google Scholar]
- 11. Myers M, Wager‐Smith K, Rothenfluh‐Hilfiker A, Young M. Light‐induced degradation of TIMELESS and entrainment of the Drosophila circadian clock. Science 1996; 271: 1736–40. [DOI] [PubMed] [Google Scholar]
- 12. Garcau N, Liu Y, Loros JJ, Dunlap JC. Alternative initiation of translation and time‐specific phosphorylation yield multiple forms of the essential clock protein FREQUENCY. Cell 1997; 89: 469–76. [DOI] [PubMed] [Google Scholar]
- 13. Dunlap JC. Common treads in eukaryotic circadian systems. Curr Opin Genet Dev 1998; 8: 400–6. [DOI] [PubMed] [Google Scholar]
- 14. Loros JJ. Time at the end of the millennium: the Neurospora clock. Curr Opin Microbiol 1998; 1: 698–706. [DOI] [PubMed] [Google Scholar]
- 15. Morse D, Sassone‐Corsi P. Time after time: input to and output from the mammalian circadian oscillators. Trends Neurosci 2002; 25: 632–27. [DOI] [PubMed] [Google Scholar]
- 16. Gekakis N, Staknis D, Nguyen HB et al. Role of the CLOCK protein in the mammalian circadian mechanism. Science 1998; 280: 1564–9. [DOI] [PubMed] [Google Scholar]
- 17. Fu L, Pelicano H, Liu J, Huang P, Lee CC. The circadian gene Period2 plays an important role in tumor suppression and DNA damage response in vivo . Cell 2002; 111: 41–50. [DOI] [PubMed] [Google Scholar]
- 18. Oster H, Baeriswyl S, Horst van der GTJ, Albercht U. Loss of circadian rhythmicity in aging mPer1−/–mCry2−/– mutant mice. Genes Dev 2003; 17: 1366–79. [DOI] [PMC free article] [PubMed] [Google Scholar]
- 19. Zylka MJ, Shearman LP, Weaver DR, Reppert SM. Three period homologs in mammals: differential light responses in the suprachiasmatic circadian clock and oscillating transcripts outside of brain. Neuron 1998; 20: 1103–10. [DOI] [PubMed] [Google Scholar]
- 20. Field MD, Maywood ES, O’Brien JA, Weaver DR, Reppert SM, Hastings MH. Analysis of clock proteins in mouse SCN demonstrates phylogenetic divergence of the circadian clockwork and resetting mechanisms. Neuron 2000; 25: 437–47. [DOI] [PubMed] [Google Scholar]
- 21. Shearman LP, Jin X, Lee C, Reppert SM, Weaver DR. Targeted disruption of the mPer3 gene: subtle effects on circadian clock function. Mol Cell Biol 2000; 20: 6269–75. [DOI] [PMC free article] [PubMed] [Google Scholar]
- 22. Urs A. Functional genomics of sleep and circadian rhythm invited review: Regulation of mammalian circadian clock genes. J Appl Physiol 2002; 92: 1348–55. [DOI] [PubMed] [Google Scholar]
- 23. Hastings MH, Reddy AB, Maywood ES. A clockwork web: circadian timing in brain and periphery, in health and disease. Nat Rev Neurosci 2003; 4: 649–461. [DOI] [PubMed] [Google Scholar]
- 24. Cermakian N, Boivin DB. A molecular perspective of human circadian rhythm disorders. Brain Res Brain Res Rev 2003; 42: 204–20. [DOI] [PubMed] [Google Scholar]
- 25. Fu L, Lee CC. The circadian clock: pacemaker and tumour suppressor. Nat Rev Cancer 2003; 3: 350–61. [DOI] [PubMed] [Google Scholar]
- 26. Liu TC, Lin SF, Chen TP, Liu HW, Chang JG. Mutation analysis of the ras gene in myelocytic leukemia by polymerase chain reaction and oligonucleotide probes. J Formos Med Assoc 1991; 90: 825–30. [PubMed] [Google Scholar]
- 27. Lin SF, Liu TC, Chen TP, Chiou SS, Liu HW, Chang JG. Diagnosis of thalassaemia by non‐isotope detection of α/β and δ/β mRNA ratio. Br J Haematol 1994; 87: 133–8. [DOI] [PubMed] [Google Scholar]
- 28. Esteller M. CpG island hypermethylation and tumor suppressor genes: a booming present, a brighter future. Oncogene 2003; 21: 5427–70. [DOI] [PubMed] [Google Scholar]
- 29. Ekmekci CG, Gutierrez MI, Siraj AK, Ozbek U, Bhatia K. Aberrant methylation of multiple tumor suppressor genes in acute myeloid leukemia. Am J Hematol 2004; 77: 233–40. [DOI] [PubMed] [Google Scholar]
- 30. Yasunaga J, Taniguchi Y, Nosaka K et al. Identification of aberrantly methylated genes in association with adult T‐cell leukemia. Cancer Res 2004; 64: 6002–9. [DOI] [PubMed] [Google Scholar]
- 31. Galm O, Wilop S, Reichelt J et al. DNA methylation changes in multiple myeloma. Leukemia 2004; 18: 1687–92. [DOI] [PubMed] [Google Scholar]
- 32. Liu TC, Lin SF, Chang JG, Yang MY, Hung SY, Chang CS. Epigenetic alteration of the SOCS1 gene in chronic myeloid leukaemia. Br J Haematol 2003; 123: 654–61. [DOI] [PubMed] [Google Scholar]
- 33. Roman‐Gomez J, Castillejo JA, Jimenez A et al. 5′‐CpG island hypermethylation is associated with transcriptional silencing of the p21 CIP1/WAF1/SDI1 gene and confers poor prognosis in acute lymphoblastic leukemia. Blood 2002; 99: 2291–6. [DOI] [PubMed] [Google Scholar]
- 34. Cameron EE, Bachman KE, Myohanen S, Herman JG, Baylin SB. Synergy of demethylation and histone deacetylase inhibition in the re‐expression of genes silenced in cancer. Nat Genet 1999; 21: 103–7. [DOI] [PubMed] [Google Scholar]
- 35. Bae K, Jin X, Maywood ES, Hastings MH, Reppert SM, Weaver DR. Differential functions of mPer1, mPer2, and mPer3 in the SCN circadian clock. Neuron 2001; 30: 525–36. [DOI] [PubMed] [Google Scholar]
- 36. Shearman LP, Zylka MJ, Weaver DR, Kolakowski LF, Reppert SM. Two period homologs: Circadian expression and photic regulation in the suprachiasmatic nuclei. Neuron 1997; 19: 1261–9. [DOI] [PubMed] [Google Scholar]
- 37. Boivin DB, James FO, Wu A, Cho‐Park PF, Xiong H, Sun ZS. Circadian clock genes oscillate in human peripheral blood mononuclear cells. Blood 2003; 102: 4143–5. [DOI] [PubMed] [Google Scholar]
- 38. Chen ST, Choo KB, Hou MF, Yeh KT, Kuo SJ, Chang JG. Deregulated expression of the PER1, PER2 and PER3 genes in breast cancers. Carcinogenesis 2005; 26: 1241–6. [DOI] [PubMed] [Google Scholar]
- 39. Zhu Y, Brown HN, Zhang Y, Stevens RG, Zheng T. Period3 structural variation: a circadian biomarker associated with breast cancer in young women. Cancer Epidemiol Biomarkers Prev 2005; 14: 268–70. [PubMed] [Google Scholar]
- 40. Cardone L, Hirayama J, Giordano F, Tamaru T, Palvimo JJ, Sassone‐Corsi P. Circadian clock control by sumoylation of BMAL1. Science 2005; 309: 1390–4. [DOI] [PubMed] [Google Scholar]
- 41. Matsuo T, Yamaguchi S, Mitsui S, Emi A, Shimoda F, Okamura H. Control mechanism of the circadian clock for timing of cell division in vivo . Science 2003; 302: 255–9. [DOI] [PubMed] [Google Scholar]