

Abstract
Using a newly developed assay of telomerase reverse transcriptase (hTERT) mRNA in serum by real‐time RT‐PCR, we previously reported this assay to be superior to other tumor markers for hepatoma. In this study, we aimed to clarify its clinical significance as a biomarker for lung cancer. In 112 patients with lung tumor and 80 individuals without cancer, we measured serum hTERT mRNA and epidermal growth factor receptor (EGFR) mRNA levels, using a quantitative one‐step real‐time RT‐PCR assay. We examined its sensitivity and specificity in lung cancer diagnosis, its clinical significance in comparison with other tumor markers, and its correlation with the clinical parameters using multivariate analyses and correlation relative tests. The copy number of serum hTERT mRNA was independently correlated with tumor size, tumor number, presence of metastasis and recurrence, and smoking (all P < 0.05). EGFR mRNA correlated with tumor number and clinical stage (both P < 0.05). The sensitivity and specificity in lung cancer diagnosis were 89.0% and 72.7% for hTERT mRNA, and 71.3% and 80.0% for EGFR mRNA, respectively. hTERT mRNA was superior to other tumor markers in lung cancer diagnosis. For both mRNAs, serum levels were significantly correlated with levels in lung cancer tissues (both P < 0.05). The copy number of hTERT mRNA significantly decreased after the surgical treatment. The data suggest that hTERT mRNA, especially when combined with EGFR mRNA, is a novel and excellent biomarker for pulmonary malignancies to diagnose and assess the clinical stage. (Cancer Sci 2006; 97: 1366–1373)
Abbreviations:
- ADC
adenocarcinoma
- CEA
carcinoembryonic antigen
- CYFRA (21–1)
cytokeratin 19 fragment
- EGFR
epidermal growth factor receptor
- hTERT
human telomerase reverse transcriptase
- LCLC
large cell lung cancer
- NSCLC
non‐small‐cell lung cancer
- RT‐PCR
reverse transcription polymerase chain reaction
- ROC
receiver operator characteristic
- SCC
squamous cell carcinoma
- SCCA
squamous cell carcinoma related antigen
- SCLC
small‐cell lung cancer; SLX, sialyl Lewis X‐i antigen; TPA, tissue polypeptide antigen.
Lung cancer is the leading cause of malignancy‐related mortality( 1 ) with little change in the survival rates over the past two decades.( 2 ) NSCLC now accounts for about three‐quarters of all cases of lung cancer( 3 ) and most patients continue to die of progressive metastatic disease despite the development of new therapeutic strategies and advances in surgical treatment. Serum tumor markers are non‐invasive diagnostic tools for malignant tumors and they are commonly used for the screening of cancer and as an indicator of the treatment effect. In SCLC, neuron‐specific enolase and pro‐gastrin‐releasing peptide are effective markers. In NSCLC, CEA, SCCA, and CYFRA 21‐1 are commonly used for screening, and at least one marker among CEA, SCCA and CYFRA is positive in approximately 70% of patients with NSCLC.( 4 ) According to the histological category, the positive rates of CEA and CYFRA are high in patients with ADC, and the positive rates of CYFRA and SCCA are high in patients with SCC. Although the standard diagnostic procedures such as X‐ray examinations, conventional tumor markers, and bronchial lavage are important for the detection of lung cancer, they are not still sensitive enough to detect lung cancer at an early clinical stage.
Tyrosine kinase activity of EGFR promotes tumor cell proliferation, cell survival, angiogenesis, invasion, and metastasis, and its specific inhibition by gefitinib, a synthetic anilinoquinazoline, has been demonstrated.( 5 ) The EGFR is expressed in 20–80% of tissue specimens of NSCLC( 6 ) but its expression has been observed in a progressive type of SCLC.( 7 ) In this sense, EGFR may be a potential molecule for diagnosis or good target that determines responsiveness to EGFR‐targeted therapies.( 8 )
Telomerase enzyme complex has two major subunits and the expression is mainly regulated by a catalytic subunit, hTERT.( 9 ) As many kinds of mRNAs are found in the plasma and serum of healthy individuals and cancer patients,( 10 ) it has been suggested that the detection of cancer‐related gene expression in the serum is very useful for the diagnosis and follow‐up of patients. hTERT mRNA was detected in the serum of 40% of breast cancer patients, but not in normal controls or in two patients with benign breast disease, demonstrating that it can be detectable.( 11 ) Some groups have reported that cell‐free circulating hTERT mRNA in plasma can be detected in 12% of patients with lung cancer,( 12 ) thus suggesting that hTERT mRNA detected in blood may be applicable for lung cancer as a diagnostic vehicle.
We previously reported that the method for detecting tumor‐derived hTERT mRNA in serum was sensitive for the early detection of hepatocellular carcinoma in patients whose α‐fetoprotein levels were low.( 13 ) Furthermore, we developed a one‐step real‐time RT‐PCR assay, which is a quantitative method for measuring RNAs in the sera. The introduction of the newly developed assay into hepatocellular carcinoma diagnosis may be able to prove that hTERT mRNA is superior to conventional tumor markers previously used in several large‐scale studies.( 14 ) There is no evidence for the specificity of this commercial antibody, thus suggesting that we may face limitations in protein‐based assay. The present study demonstrates the clinical usefulness of hTERT mRNA, especially combined with EGFR mRNA, as a novel tumor marker in primary lung cancer, viewed in the light of early detection and diagnosis. This method would be useful for patients with lung cancer in whom drugs targeting EGFR are thought to be effective.
Materials and Methods
Patients and sample collection. One hundred and twelve consecutive patients with lung tumor (98 with NSCLC, five with SCLC, one with LCLC, and eight with benign tumor) who were admitted to the National Hospital Organization Yonago Medical Center between July 2003 and December 2004 were enrolled in this study (1A, 1B). The mean age of patients was 69 years (range: 30–90 years). The patients were diagnosed based on serological examinations, chest X‐rays (helical) computed tomography, chest and brain magnetic resonance imaging, cytological examinations, and transbronchial, percutaneous, and thoracoscopic lung biopsies, and the final diagnosis was made pathologically using surgically resected specimens. The clinicopathological findings evaluated included patient demographics, diagnosis, clinical stage (IA–IV), tumor size, tumor number, tumor markers including CEA, SCCA, CYFRA, neuron‐specific enolase, pro‐gastrin‐releasing peptide, TPA and SLX, history of smoking (estimated by Pack‐Year index), and presence of metastasis or recurrence.
Table 1A.
Statistical analysis of comparison of tumor markers with clinical parameters in lung cancer patients
| Clinical parameter | n | hTERT mRNA | EGFR mRNA | CEA | SCCA | CYFRA |
|---|---|---|---|---|---|---|
| Age | ||||||
| Mean: 63 years | NS | NS | NS | NS | NS | |
| Range: 30–90) | ||||||
| Sex | ||||||
| Male | 70 | NS | NS | NS | NS | NS |
| Female | 34 | |||||
| Smoking | ||||||
| Present | 57 | 0.031 | NS | 0.049 | NS | NS |
| Absent | 47 | |||||
| No. tumors | ||||||
| 1 | 67 | 0.022 | 0.046 | NS | 0.007 | NS |
| 2 | 18 | |||||
| ≥3 | 17 | |||||
| Unknown | 2 | |||||
| No. occupied segments | ||||||
| 1 | 70 | 0.027 | NS | 0.031 | NS | NS |
| 2 | 19 | |||||
| ≥3 | 10 | |||||
| Unknown | 5 | |||||
| Diagnosis | ||||||
| ADC | 83 | NS | NS | NS | NS | NS |
| SCC | 15 | |||||
| Other | 6 | |||||
| Size of tumor | ||||||
| <2 cm | 30 | 0.002 | NS | 0.011 | NS | 0.019 |
| 2–3 cm | 35 | |||||
| >3 cm | 38 | |||||
| Unknown | 1 | |||||
| Metastasis | ||||||
| Present | 45 | 0.026 | NS | 0.005 | NS | NS |
| Absent | 57 | |||||
| Unknown | 2 | |||||
| Successive onset | ||||||
| Present | 38 | 0.032 | NS | NS | 0.034 | 0.01 |
| Absent | 59 | |||||
| Unknown | 7 | |||||
| Staging (K–W test) | ||||||
| IA, IB | 23, 16 | NS | 0.031 | NS | NS | 0.021 |
| IIA, II B | 6, 15 | |||||
| III A, III B | 31, 5 | |||||
| IV | 8 | |||||
hTERT mRNA, independently correlated with smoke, tumor size, tumor number, metastasis, and recurrence. K‐W test, Kruskal–Wallis test; NS, not significant.
Table 1B.
Positive rate and mean level of each biomarker according to clinical parameters of lung cancer patients
| Parameter | hTERT mRNA | EGFR mRNA | CEA | SCCA | CYFRA | |||||
|---|---|---|---|---|---|---|---|---|---|---|
| PR | Mean ± SE | PR | Mean ± SE | PR | Mean ± SE | PR | Mean ± SE | PR | Mean ± SE | |
| Age (years) | ||||||||||
| 30–39 | 100 | 5.20 | 100 | 3.93 | 0 | 2.8 | 0 | 1.0 | 100 | 3.7 |
| 40–49 | 60.0 | 5.13 ± 0.93 | 20.0 | 3.34 ± 1.68 | 60.0 | 48.0 ± 39.3 | 50.0 | 6.25 ± 5.26 | 60.0 | 3.30 ± 1.60 |
| 50–59 | 100 | 5.04 ± 0.58 | 60.0 | 1.09 ± 0.37 | 40.0 | 8.10 ± 2.75 | 60.0 | 1.76 ± 0.53 | 60.0 | 1.94 ± 0.26 |
| 60–69 | 68.0 | 4.20 ± 0.33 | 52.0 | 4.84 ± 0.89 | 44.4 | 69.1 ± 33.5 | 22.7 | 1.34 ± 0.30 | 68.0 | 7.92 ± 2.33 |
| 70–79 | 73.3 | 5.05 ± 0.43 | 60.0 | 3.82 ± 0.66 | 34.4 | 11.2 ± 3.77 | 31.8 | 1.49 ± 0.32 | 73.3 | 5.46 ± 1.02 |
| 80–89 | 100 | 6.33 ± 0.85 | 25.0 | 2.57 ± 0.52 | 22.2 | 5.72 ± 2.82 | 12.5 | 0.80 ± 0.13 | 87.5 | 4.04 ± 1.21 |
| 90+ | 100 | 5.39 | 0 | 2.42 | 100 | 50.2 | 0 | 0.5 | 100 | 9.0 |
| Sex | ||||||||||
| Female | 76.9 | 5.32 ± 0.41 | 65.4 | 4.24 ± 0.62 | 34.6 | 36.3 ± 18.7 | 11.5 | 2.01 ± 1.19 | 53.8 | 4.22 ± 1.31 |
| Male | 77.1 | 4.97 ± 0.28 | 38.6 | 4.80 ± 0.61 | 42.6 | 30.8 ± 15.2 | 33.3 | 1.50 ± 0.21 | 72.5 | 6.50 ± 1.16 |
| Smoking | ||||||||||
| Present | 74.3 | 5.03 ± 0.26 | 34.4 | 3.98 ± 0.61 | 39.5 | 29.8 ± 20.8 | 43.8 | 1.75 ± 0.29 | 71.4 | 5.37 ± 1.03 |
| Absent | 74.4 | 4.80 ± 0.40 | 66.7 | 4.43 ± 0.57 | 38.1 | 35.2 ± 12.8 | 22.6 | 1.55 ± 0.69 | 70.0 | 6.10 ± 1.44 |
| No. tumors | ||||||||||
| 1 | 82.9 | 4.27 ± 0.45 | 43.6 | 3.08 ± 1.04 | 31.8 | 7.86 ± 1.84 | 23.7 | 1.06 ± 0.11 | 65.9 | 4.30 ± 0.73 |
| 2 | 90.0 | 5.05 ± 0.44 | 70.0 | 2.67 ± 0.69 | 58.3 | 137.9 ± 71.4 | 33.3 | 1.32 ± 0.27 | 81.8 | 7.98 ± 3.03 |
| ≥3 | 56.5 | 5.21 ± 0.36 | 52.6 | 3.44 ± 0.58 | 41.7 | 25.3 ± 9.86 | 37.5 | 3.23 ± 1.36 | 71.4 | 7.63 ± 2.35 |
| No. segments | ||||||||||
| 1 | 75.0 | 5.44 ± 0.30 | 25.0 | 2.95 ± 0.51 | 11.1 | 4.59 ± 1.41 | 22.2 | 1.06 ± 0.11 | 44.4 | 3.22 ± 1.22 |
| 2 | 71.4 | 4.10 ± 0.33 | 53.8 | 4.50 ± 1.02 | 37.5 | 57.8 ± 49.4 | 33.3 | 1.32 ± 0.75 | 80.0 | 4.53 ± 1.21 |
| ≥3 | 57.1 | 4.35 ± 0.97 | 66.7 | 3.12 ± 1.10 | 10.0 | 3.36 ± 1.28 | 37.5 | 3.23 ± 1.36 | 44.4 | 3.88 ± 1.89 |
| Diagnosis | ||||||||||
| ADC | 87.2 | 5.05 ± 0.27 | 51.8 | 4.07 ± 0.48 | 41.9 | 25.5 ± 8.65 | 23.4 | 1.50 ± 0.46 | 67.8 | 4.43 ± 0.72 |
| SCC | 50.0 | 4.40 ± 0.61 | 33.3 | 3.18 ± 1.00 | 23.5 | 13.7 ± 7.96 | 46.7 | 2.19 ± 0.56 | 75.0 | 9.77 ± 3.06 |
| Other | 33.3 | 3.92 ± 0.98 | – | 66.7 | 311.4 ± 245.8 | 33.3 | 1.23 ± 0.38 | 66.7 | 23.6 ± 13.7 | |
| Size of tumor | ||||||||||
| <2 cm | 73.7 | 4.58 ± 2.19 | 44.4 | 4.19 ± 1.04 | 15.8 | 5.05 ± 1.73 | 21.4 | 0.92 ± 0.15 | 61.1 | 3.06 ± 0.70 |
| 2–3 cm | 81.0 | 5.01 ± 0.44 | 47.4 | 3.23 ± 0.69 | 36.4 | 17.2 ± 9.35 | 35.3 | 2.67 ± 1.27 | 50.0 | 3.29 ± 0.63 |
| >3 cm | 73.5 | 5.03 ± 0.36 | 54.8 | 3.81 ± 0.58 | 51.3 | 54.7 ± 23.4 | 25.0 | 1.42 ± 0.23 | 81.6 | 8.33 ± 1.64 |
| Metastasis | ||||||||||
| Present | 66.2 | 5.09 ± 0.40 | 36.8 | 4.21 ± 0.59 | 38.8 | 32.6 ± 11.9 | 28.6 | 1.65 ± 0.37 | 69.7 | 5.75 ± 0.90 |
| Absent | 23.5 | 4.49 ± 0.31 | 21.2 | 3.09 ± 0.58 | 64.7 | 9.26 ± 4.02 | 32.1 | 1.63 ± 0.64 | 67.9 | 5.18 ± 1.51 |
| Successive onset | ||||||||||
| Present | 70.3 | 4.51 ± 0.35 | 35.0 | 5.07 ± 0.78 | 85.2 | 48.6 ± 17.4 | 42.9 | 1.86 ± 0.44 | 63.3 | 6.21 ± 1.08 |
| Absent | 53.3 | 5.50 ± 0.29 | 35.3 | 3.91 ± 0.59 | 27.9 | 25.3 ± 18.5 | 22.5 | 1.10 ± 0.11 | 60.5 | 4.10 ± 0.72 |
| Staging | ||||||||||
| 1A | 77.8 | 6.62 ± 0.69 | 50.0 | 3.20 ± 0.56 | 40.0 | 6.27 ± 2.04 | 0 | 0.74 ± 0.11 | 50.0 | 1.79 ± 0.24 |
| 1B | 77.8 | 4.72 ± 0.60 | 44.4 | 4.33 ± 1.23 | 18.2 | 7.65 ± 4.33 | 12.5 | 1.56 ± 0.78 | 88.9 | 5.59 ± 1.49 |
| 2A | 66.7 | 2.76 ± 1.41 | 33.3 | 9.29 ± 3.03 | 33.3 | 4.53 ± 1.24 | 66.7 | 2.05 ± 0.35 | 33.3 | 4.30 ± 2.50 |
| 2B | 66.7 | 2.52 ± 1.40 | 44.4 | 4.46 ± 1.01 | 28.9 | 58.5 ± 48.7 | 12.5 | 1.48 ± 0.54 | 75.0 | 4.00 ± 1.87 |
| 3A | 76.9 | 5.31 ± 0.54 | 15.4 | 4.48 ± 1.21 | 60.0 | 69.0 ± 31.5 | 25.0 | 1.43 ± 0.51 | 80.0 | 11.6 ± 3.52 |
| 3B | 100 | 5.47 ± 0.75 | 75.0 | 6.39 ± 1.16 | 50.0 | 8.10 ± 3.71 | 50.0 | 1.83 ± 1.05 | 100 | 12.6 ± 10.6 |
| 4 | 66.7 | 3.64 ± 1.82 | 0 | 1.62 ± 0.82 | 33.3 | 3.23 ± 1.19 | 50.0 | 2.60 ± 1.80 | 100 | 6.60 ± 1.70 |
PR, positive rate (%), which was evaluated from predictive cutoff value.
Eighty healthy individuals (39 men, 41 women; mean age 60 years, range 22–90 years) served as controls, recruited from healthy volunteers and outpatients without lung diseases. To examine any change in the gene expression in serum before and a month after surgical treatment in the same patients and to examine its significance as a tumor marker, we quantified hTERT mRNA and EGFR mRNA expression in nine patients with lung cancer before and after treatment.
Informed consent was obtained from each patient and the study protocols followed the ethical guidelines of the 1975 Declaration of Helsinki and were approved by the human research committee of Tottori University (approval no. 138, no. 138–1, 2001).
All specimens were processed within 3 h after blood withdrawal. The centrifugation of collected blood and harvesting serum samples were performed using three steps of centrifugation (800 g , 1000 g , and 1500 g ) to decrease lymphocytes to a minimum as previously described.( 14 ) To study whether hTERT mRNA and EGFR mRNA in serum are originated and released from pulmonary malignancies, we harvested the surgically resected lung tumorous tissues specimens and sera in 23 patients with lung cancer for hTERT mRNA, and nine patients (39.1%) with strong expression for EGFR mRNA in serum of 23 patients were examined.
RNA extraction and real‐time quantitative RT‐PCR. RNA was extracted with DNase treatment from serum as reported previously.( 11 , 13 ) RNAs from lung cancer tissues were extracted using TRIzol Reagent according to manufacturer's instructions (Invitrogen, Carlsbad, CA, USA). The primers used in the experiment were as reported previously for hTERT mRNA (the primers do not target for some splice variants),( 13 ) and as follows for EGFR: forward, AACTGTGAGGTGGTCCTTGG, and reverse, GTTGAGGGCAATGAGGACAT (the amplified target corresponds to a tyrosine kinase phosphorylation site of EGFR and the primers are designed in the sequences without any mutations).( 15 )
RNA from 200 µL of serum was dissolved in 200 µL of water. The quantitative RT‐PCR was performed using 1 µL of RNA extract and 2 µL of SYBR Green I (Roche, Basel, Switzerland) in a one‐step RT‐PCR kit (Qiagen, Tokyo, Japan). The RT‐PCR condition was performed as described previously.( 14 ) The dynamic ranges of real‐time PCR analysis for hTERT mRNA and EGFR mRNA were more than approximately 5–10 copies in this assay and we were able to exclude the possibility of false negativity in serum samples from patients and controls.
Control hTERT mRNA for standardization was generated using T7 RNA polymerase in pLIXN‐hTERT cDNA kindly provided from Dr H. Tahara (Hiroshima University, Japan) and control EGFR mRNA was similarly generated using pCRII‐TOPO‐EGFR (Invitrogen, Tokyo, Japan) retrofitted from pME18SFL3‐EGFR purchased as FLJ cDNA clone commercially (Toyobo, Tokyo, Japan). The PCR yielded products of 131 bp for hTERT and of 114 bp for EGFR, respectively (data not shown). The RT‐PCR assay was repeated twice and the quantification was confirmed by using LightCycler (Roche, Basel, Switzerland) with reproducibility.
Immunohistochemistry. For the immunohistochemical analyses, we chose 10 patients (seven patients with ADC and three patients with SCC) with positive mRNAs or tumor markers who underwent surgical treatment.
Resected lung tissue specimens fixed in 4% paraformaldehyde were processed as described previously.( 16 ) Monoclonal antibodies used in this study were as follows: anti‐hTERT (Santa Cruz Biotechnology, Santa Cruz, CA, USA), anti‐EGFR (Santa Cruz Biotechnology), anti‐CEA (Sigma, St Louis, MO, USA), anti‐SCCA (Sigma), and anti‐CYFRA (Sigma). As a negative control, the staining procedure was performed with the primary antibody omitted. The expression degree of hTERT, EGFR, CYFRA and CEA was estimated by percentage score, intensity score and overall score. Percentage score was classified as follows: 0, <10%; 1, 10–25%; 2, 26–50%; 3, 51–75%; 4, >76%. Intensity score was classified as follows: 0, no staining; 1, light brown; 2, brown; 3, dark brown. Overall score was calculated as percentage score multiplied by intensity score.
Statistical analysis. The stratified categories in each clinical parameter were evaluated by t‐test, a multivariate analysis, Kruskal–Wallis test, or Friedman test (in case of more than three groups in the category). Sensitivity and specificity were calculated by SPSS 13.0. Sensitivity was evaluated as the mean of confidence intervals of the area under the curve. The significant difference of tumor markers was assessed by multivariate analysis, and the correlations among hTERT mRNA, EGFR mRNA, conventional tumor markers, and clinical parameters were calculated by Pearson's relative test. To assess the accuracy of diagnostic tests, the matched data regarding age sets with and without malignancies for CEA, SCCA, CYFRA, EGFR mRNA, hTERT mRNA and both mRNAs were analyzed using ROC curve analysis. Less than or more than a predictive cutoff value was evaluated as the nearest point from left upper corner of ROC curve analysis and the quantitative changes of hTERT mRNA and EGFR mRNA before and 1 month after surgical treatment were analyzed using the Wilcoxon test and paired t‐test.
Results
mRNA quantification and clinical parameters. In each quantitative assay, a strong linear relation was demonstrated between copy number and PCR cycles using RNA controls for concentration (r ≥ 0.99 for hTERT mRNA, Fig. 1A; r = 1.0 for EGFR mRNA, Fig. 1B). The mean ± SE copy numbers in lung cancer patients and normal individuals were 4.93 ± 1.92 copies/0.2 mL and 2.24 ± 1.40 copies/0.2 mL for hTERT mRNA and 2.46 ± 1.25 copies/0.2 mL and 1.23 ± 1.55 copies/0.2 mL for EGFR mRNA, respectively. The copy numbers of hTERT mRNA and EGFR mRNA were significantly higher in the lung cancer patients than in the healthy individuals (both P < 0.01). Pearson's relative test or t‐test to clinical parameters denoted that the hTERT mRNA level was significantly associated with presence of hepatitis virus in cancer patients (P = 0.024; positive cases 5.11 ± 0.23, negative cases 3.72 ± 0.48), TPA (P < 0.05), SCCA (P < 0.05), and the number of tumors (P < 0.001). EGFR mRNA was significantly associated with the number of occupied lobular segments (P < 0.05), presence of metastasis (P < 0.05), tumor occurrence after the second onset (P < 0.01), and clinical staging (P < 0.01) (1A, 1B).
Figure 1.
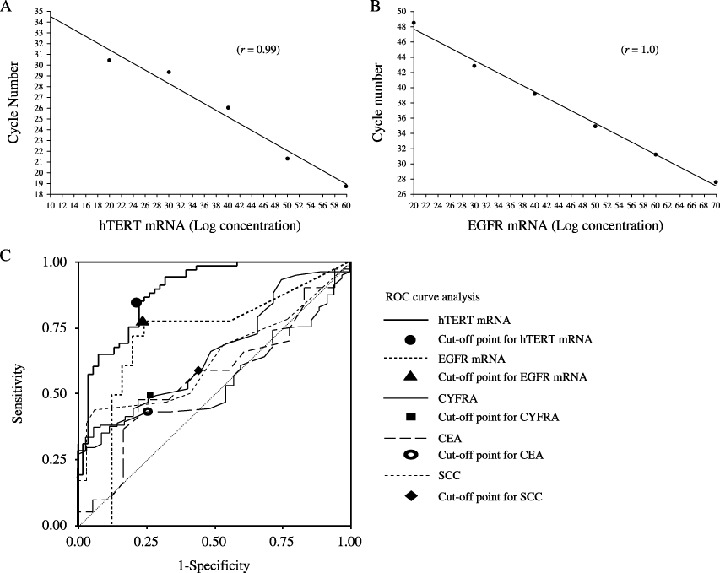
hTERT mRNA and EGFR mRNA expression. Quantitative assays for hTERT mRNA and (B) EGFR mRNA. In each, a strong linear relationship was demonstrated between copy number and PCR cycles using RNA controls for concentration. The dynamic ranges of real‐time PCR analysis for hTERT mRNA and EGFR mRNA were more than 5–10 copies in this assay and we were able to exclude the possibility of false negativity in serum samples from patients and controls. (C) ROC curve analysis of hTERT mRNA and EGFR mRNA expression. The curves shown were obtained by processing quantified raw data with SPSS 13.0 and the sensitivity and specificity values were calculated as the mean of confidence intervals of area under the curves. Each line has a cutoff point with the shortest distance to each curve from the upper‐left corner on the graph.
Statistical analysis and ROC curve analysis. To examine the sensitivity and specificity of tumor markers for diagnosis of lung cancer, an ROC curve analysis was performed (Fig. 1C). The sensitivity for lung cancer was 40.1% for CEA, 58.9% for SCCA, 48.8% for CYFRA, 71.3% for EGFR mRNA, and 89.0% for hTERT mRNA (Table 2). The specificity was 74.4% for CEA, 58.3% for SCCA, 74.2% for CYFRA, 80.0% for EGFR mRNA and 72.7% for hTERT mRNA.( 17 ) The positive predictive value and negative predictive value of hTERT mRNA were the highest of the tumor markers examined (Table 2). Predictive cutoff values were 3.6 copies/0.2 mL for hTERT mRNA, 2.61 copies/0.2 mL for EGFR mRNA, 1.3 ng/mL for CEA, 1.5 ng/mL for SCCA, and 2.8 ng/mL for CYFRA (Table 2). By multivariate analysis, t‐test, and Friedman test, clinicopathological findings showed significant relationships to hTERT and EGFR expression in the serum (1A, 1B). Smoking (P < 0.05), tumor size (P < 0.01), number of tumors (P < 0.01), presence or absence of metastasis (P < 0.01), and successive onset (P < 0.05) were significantly associated with hTERT mRNA expression.
Table 2.
Sensitivity and specificity of each tumor marker for lung cancer
| Tumor marker | Sensitivity | Specificity | P‐value | PPV | NPV | Predictive cutoff value (logarithmic value) |
|---|---|---|---|---|---|---|
| hTERT mRNA | 89.0 | 72.7 | 0.002 | 84.3 | 80.3 | 3.60 × 10x copies |
| EGFR mRNA | 71.3 | 80.0 | 0.013 | 77.0 | 70.6 | 2.61 × 10x copies |
| CYFRA | 48.8 | 74.2 | 0.016 | 65.0 | 50.0 | 1.3 ng/mL |
| SCCA | 58.9 | 58.3 | 0.032 | 20.7 | 87.5 | 1.5 ng/mL |
| CEA | 40.1 | 74.4 | 0.376 | 65.0 | 39.1 | 2.8 ng/mL |
Regarding a diagnostic assessment in sensitivity and specificity, hTERT mRNA is identified as the most effective tumor marker. EGFR mRNA is an applicable biomarker due to the high specificity. PPV, positive predictive value; NPV, negative predictive value.
In a comparison of hTERT‐negative patients (less than the predictive cutoff value) with hTERT‐positive patients (more than the predictive cutoff value), hTERT‐negative patients were significantly correlated only with a pathological diagnosis (ADC) of the other clinical factors by Kruskal–Wallis test (P = 0.02, respectively).
The number of tumors and clinical staging were significantly correlated with EGFR mRNA expression (both P < 0.05). In lung cancer, all tumor markers showed no significant relations with pathological diagnosis. CEA level showed a significant correlation with the number of occupied segments, tumor size, presence of metastasis, and smoking (all P < 0.05).( 18 ) SCCA level was correlated with the number of tumors and successive onset (all P < 0.05). The CYFRA level was correlated with tumor size, successive onset and clinical staging (all P < 0.05). Taken together, the combination of hTERT and EGFR mRNA levels is superior to the any of the other tested serum markers used in isolation.
Immunohistochemistry. The expression of hTERT, EGFR, SCCA, and CYFRA was also examined at protein levels (Fig. 2). hTERT protein was not very highly expressed; however, it was diffusely stained in the cytoplasm of cancer cells and its expression was stronger in tumorous lesions than in normal adjacent areas (Fig. 2a). EGFR protein was also expressed in the cytoplasm (Fig. 2b), and it tended to be expressed more strongly in SCC than in ADC. hTERT protein expressed more strongly in ADC than in SCC and the overall score tended to correlate with serum mRNA level in each patient (Table 3). However, the relationship between mRNA expression and pathological type of cancer was not statistically significant. The expression levels of CYFRA (Fig. 2c) and CEA (Fig. 2d) were high in lung cancer tissues.
Figure 2.
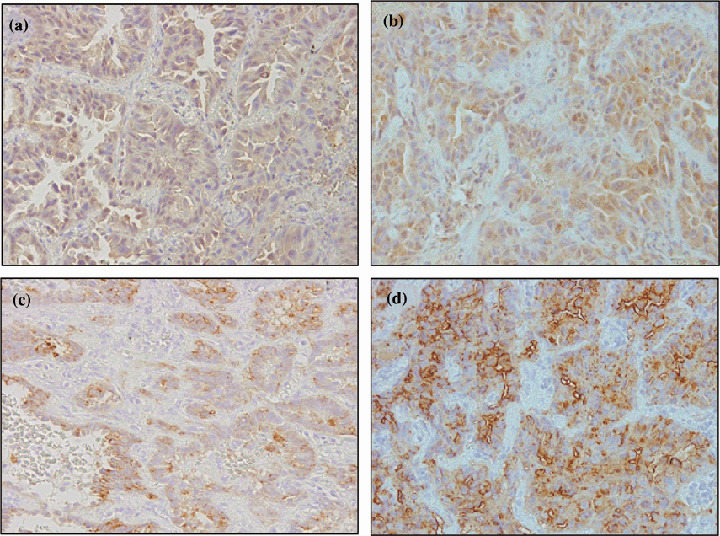
Immunohistochemistry of biomarker expression. Representative immunohistochemistry in cancerous portion and non‐cancerous portion of the lung in a patient with ADC with respective biomarker expression (original magnification ×200). Nuclear and cytoplasmic immunoreactivity were measured using the appropriate antibody to detect the expression of (a) hTERT, (b) EGFR, (c) CYFRA, and (d) CEA.
Table 3.
Degree of expression of hTERT, EGFR, CYFRA and CEA in serum estimated by percentage score, intensity score and overall score in positive patients
| Patient | hTERT expression | EGFR expression | CEA expression | CYFRA expression | ||||||||
|---|---|---|---|---|---|---|---|---|---|---|---|---|
| PS | IS | OS | PS | IS | OS | PS | IS | OS | PS | IS | OS | |
| ADC 1 | 3 | 2 | 6 | 2 | 2 | 4 | 4 | 1 | 4 | 4 | 2 | 8 |
| ADC 2 | 3 | 2 | 6 | 1 | 2 | 2 | 2 | 3 | 6 | 3 | 2 | 6 |
| ADC 3 | 4 | 1 | 4 | 4 | 2 | 8 | 3 | 3 | 9 | 4 | 3 | 12 |
| ADC 4 | 4 | 2 | 8 | 4 | 2 | 8 | 4 | 3 | 12 | 4 | 3 | 12 |
| ADC 5 | 3 | 2 | 6 | 4 | 1 | 4 | 4 | 2 | 8 | 4 | 2 | 8 |
| ADC 6 | 1 | 1 | 1 | 4 | 1 | 4 | 2 | 3 | 6 | 2 | 1 | 2 |
| ADC 7 | 4 | 1 | 4 | 4 | 2 | 8 | 4 | 1 | 4 | 3 | 2 | 6 |
| SCC 1 | 1 | 1 | 1 | 2 | 3 | 6 | 3 | 3 | 9 | 0 | 3 | 0 |
| SCC 2 | 1 | 1 | 1 | 4 | 2 | 8 | 4 | 2 | 8 | 0 | 2 | 0 |
| SCC 3 | 2 | 1 | 2 | 4 | 2 | 8 | 3 | 1 | 3 | 0 | 0 | 0 |
| Average | 3.9 | 6.0 | 6.7 | 5.4 | ||||||||
PS, percentage score: 0, <10%; 1, 10–25%; 2, 26–50%; 3, 51–75%; 4, >76%. IS, intensity score: 0, no staining; 1, light brown; 2, brown; 3, dark brown. OS, overall score: 0–3, negative; 4–6, weak positive; >6, strong positive. Overall score = (percentage score) × (intensity score).
Correlation of hTERT mRNA and EGFR mRNA detection in paired serum and tumor tissue samples. The copy number of hTERT mRNA in serum was significantly related to that in cancer tissue (P < 0.05; Fig. 3A), and that of EGFR mRNA in the serum was significantly related to that in the cancer tissue (P < 0.01; Fig. 3B). These data suggest that both RNAs in the serum are derived from lung cancer tissue specimens.
Figure 3.
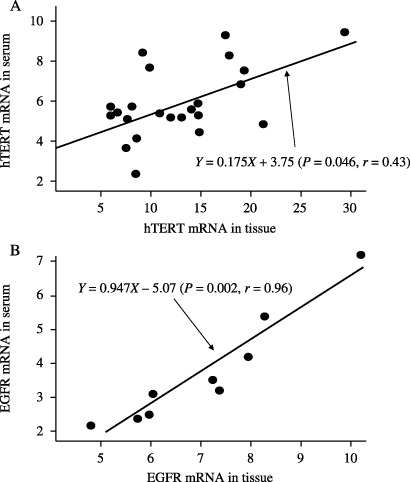
Correlation between hTERT and EGFR mRNA levels in serum and in lung cancer tissue. (A) hTERT mRNA levels in serum and in lung cancer tissue in 23 patients: P < 0.01 by paired t‐test; P = 0.021 by non‐parametric Spearman's test. (B) EGFR mRNA levels in serum and in lung cancer tissues in 9 patients: P < 0.01 by paired t‐test; P = 0.002 by non‐parametric Spearman's test. Only patients positive for mRNA in the tissue specimens were included in this analysis. Positive was defined as above the predictive cutoff values for the mRNA in the study population. The data were evaluated by a logarithm of quantification.
Evaluation of serum hTERT quantification as a tumor biomarker. Compared with pretreatment, a quantitative decrease of hTERT mRNA a month after surgical treatment was demonstrated (Fig. 4A), thus suggesting that hTERT mRNA is a useful biomarker that could be applicable in cancer patients. Although EGFR mRNA tended to decrease after the treatment, this decrease was not statistically significant (Fig. 4B).
Figure 4.
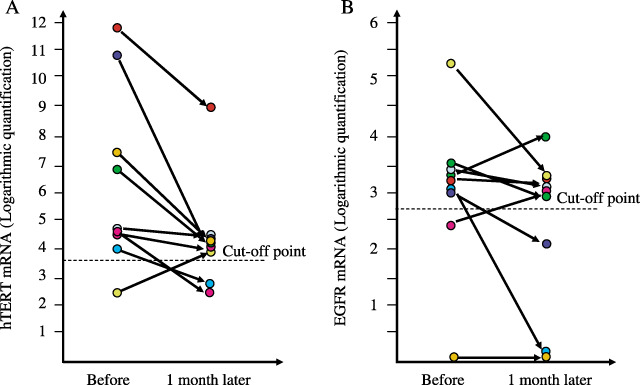
Quantification of hTERT and EGFR mRNA levels in serum before and after surgical treatment. (A) hTERT mRNA expression in 23 patients: P = 0.041 by paired t‐test; P = 0.038 by Wilcoxon test. (B) EGFR mRNA expression in nine patients: P = 0.065 by paired t‐test; P = 0.078 by Wilcoxon test. The data were evaluated by a logarithm of quantification.
Discussion
Although telomerase was initially expected to be a useful biomarker due to its specificity to cancer, its clinical application has remained undeveloped because no significant telomerase expression was found to be detectable in blood and urine samples.( 19 , 20 ) The hTERT mRNA derived from cancer cells does not seem to be detectable in serum due to its instability in the serum containing RNase. However, as RNAs in serum are stable within 24 h after drawing blood( 21 , 22 ) it has been suggested that they can be detected after overcoming technical problems by minimizing the contamination of cell fraction.( 23 )
In the present study, of 23 patients whose hTERT expression was high in lung cancer tissue specimens, three patients (13.0%) showed values under the cutoff levels in serum. In general, in order to detect tumor‐derived RNAs in serum, cancer tissue specimens require active apoptosis and/or necrosis because hTERT mRNA detected from the supernatant in routine cultured cell lines does not depend on the cell number (data not shown). Due to an absence of or only a small degree of cell death in cancer tissue specimens, hTERT may not be present in sufficient amounts to be detected in the circulation. In this study, 11 of 121 lung cancer patients were below the cutoff value for serum hTERT mRNA. The false negativity was 9.1%. However, seven of 11 hTERT‐negative patients were EGFR mRNA‐positive, indicating that the cancer diagnosis may be improved by a combined use of both markers. In addition, four of 11 hTERT‐negative patients were positive for CEA, nine of 11 were positive for CYFRA, and five of 11 were positive for SCCA, thus suggesting that CYFRA is suitable for screening of patients with hTERT‐negativity. Nine of 11 hTERT‐negative patients (81.8%) were pathologically diagnosed as ADC, and negativity of hTERT was significantly associated with ADC (P < 0.05). No parameters other than pathological difference were significantly observed.
As the hTERT expression in tissues has been reported to be more highly limited in SCC than ADC,( 24 ) serum hTERT mRNA was undetected in some ADC patients. The association between hTERT and SCC may thus be derived from the pulmonary structure and function of the cells that comprise the lung tissues, and with the development of a minor component in airway epithelial cells that originate from SCC. However, the hTERT expression was immunohistochemically stronger in ADC than SCC in the present study. Therefore, hTERT negativity in ADC may not be related to pathological differences but to the proliferating activity of the cancer. In addition, all five patients in whom lung cancer was diagnosed by the combined use of hTERT mRNA and EGFR mRNA had ADC, thus indicating that this combination may be related to the elevation in the cancer detection rate.
The serum hTERT mRNA levels showed a close relative correlation with size and number of tumors, indicating that hTERT mRNA is derived from tumor tissues. A substantial decrease in the serum hTERT mRNA level 1 month after surgery, compared to that before surgery, indicated hTERT to be a potential tumor marker of progression. The reduction of hTERT mRNA to around the cutoff value may indicate that it is an appropriate biomarker for lung cancer.
The EGFR mRNA level was elevated in two patients 1 month after surgery, compared to that before surgery, indicating the dissemination of cancer cells. This is because EGFR is known to be involved in such carcinogenetic processes as cell proliferation, apoptosis, angiogenesis, cell motility, and metastasis( 25 ) as previously reported in glioblastoma (33%), colorectal cancer (70%), head and neck cancer (41%), and melanoma.( 26 ) EGFR expression and proliferative signals are accepted as independent prognostic parameters in patients with NSCLC.( 27 , 28 ) The employment of biomarkers, which is expected to contribute to the follow‐up of the patients who are undergoing chemotherapy, may result in improving the prognosis in resected cases.( 29 ) EGFR protein expression is never a good biomarker for response to EGFR‐targeted therapies.( 30 ) In most studies, the EGFR protein levels do not correlate with response/survival. There may be molecules with inexplicable differences between RNA level and protein level yet to be detected. In a multivariable analysis, only a high EGFR gene copy number remained statistically significantly associated with better survival.( 28 ) However, we suggest that the correlation with response/survival may be more evident if this more sensitive mRNA‐based detection assay is used rather than the current protein‐based assay. Therefore, the introduction of a combination of hTERT mRNA and EGFR mRNA measurement in early diagnosis for lung cancer may improve the follow‐up of patients.
In conclusion, the data show that hTERT and EGFR mRNA levels are associated with previously detected lung cancers, so it does not demonstrate whether the method is sufficiently robust for early detection. However, the synergistic evaluation of hTERT mRNA and EGFR mRNA may be useful to diagnose and assess clinical stage in patients with lung cancer. Further case‐control studies should be planned to evaluate long‐term prognosis and to examine former smokers who do not have lung cancer.
Acknowledgments
This study was supported by a Grant‐in‐Aid (No. 10670473) for scientific research from the Ministry of Education, Science, and Culture and the Foundation for the Promotion of Cancer Research in Japan and by a research grant from Kurozumi Medical Foundation.
We sincerely thank Dr H. Tahara for kindly providing the pLXIN‐hTERT vector for use in this study.
References
- 1. Greenlee RT, Hill‐Harmon MB, Murray T et al. Cancer statistics. CA Cancer J Clin 2005; 51: 15–36. [DOI] [PubMed] [Google Scholar]
- 2. Giaccone G. Clinical impact of novel treatment strategies. Oncogene 2002; 21: 6970–81. [DOI] [PubMed] [Google Scholar]
- 3. Johnson BE, Grayson J, Makuch RW et al. Ten‐year survival of patients with small‐cell lung cancer treated with combination chemotherapy with or without irradiation. J Clin Oncol 1990; 8: 396–401. [DOI] [PubMed] [Google Scholar]
- 4. Schneider J, Philipp M, Velcovsky HG et al. Pro‐gastrin‐releasing peptide (ProGRP), neuron specific enolase (NSE), carcinoembryonic antigen (CEA), and cytokeratin 19‐fragments (CYFRA 21‐1) in patients with lung cancer in comparison to other lung diseases. Anticancer Res 2003; 23: 885–93. [PubMed] [Google Scholar]
- 5. Tagliaferri P, Tassone P, Blotta S et al. Antitumor therapeutic strategies based on the targeting of epidermal growth factor‐induced survival pathways. Curr Drug Targets 2005; 6: 289–300. [DOI] [PubMed] [Google Scholar]
- 6. Lynch TJ, Bell DW, Sordella R et al. Activating mutations in the epidermal growth factor receptor underlying responsiveness of non‐small‐cell lung cancer to gefitinib. N Engl J Med 2004; 350: 2129–39. [DOI] [PubMed] [Google Scholar]
- 7. Gamou S, Hunts J, Harigai H et al. Molecular evidence for the lack of epidermal growth factor receptor gene expression in small cell lung carcinoma cell. Cancer Res 1987; 47: 2668–73. [PubMed] [Google Scholar]
- 8. Paez JG, Janne PA, Lee JC et al. EGFR mutations in lung cancer: correlation with clinical response to gefitinib therapy. Science 2004; 304: 1497–500. [DOI] [PubMed] [Google Scholar]
- 9. Miura N, Horikawa I, Nishimoto A et al. Progressive telomere shortening and telomerase reactivation during hepatocellular carcinogenesis. Cancer Genet Cytogenet 1997; 93: 56–62. [DOI] [PubMed] [Google Scholar]
- 10. Kopreski MS, Benko FA, Kwak LW et al. Detection of tumor messenger RNA in the serum of patients with malignant melanoma. Clin Cancer Res 1999; 5: 1961–5. [PubMed] [Google Scholar]
- 11. Chen XQ, Bonnefoi H, Pelte MF et al. Telomerase RNA as a detection marker in the serum of breast cancer patients. Clin Cancer Res 2005; 6: 3823–6. [PubMed] [Google Scholar]
- 12. Pelosi G, Schianchi E, Dell’Orto P et al. Detecting cell‐free circulating hTERT mRNA in the plasma may identify a subset of nonsmall cell lung cancer patients. Virchows Arch 2005; 29: 1–9. [DOI] [PubMed] [Google Scholar]
- 13. Miura N, Shiota G, Nakagawa T et al. Sensitive detection of hTERT mRNA in the serum of patients with hepatocellular carcinoma. Oncology 2003; 64: 430–4. [DOI] [PubMed] [Google Scholar]
- 14. Miura N, Maeda Y, Kanbe T et al. Serum human telomerase reverse transcriptase messenger RNA as a novel tumor marker for hepatocellular carcinoma. Clin Cancer Res 2005; 11: 3205–9. [DOI] [PubMed] [Google Scholar]
- 15. Chou TY, Chiu CH, Li LH et al. Mutation in the tyrosine kinase domain of epidermal growth factor receptor is a predictive and prognostic factor for gefitinib treatment in patients with non‐small‐cell lung cancer. Clin Cancer Res 2005; 15: 3750–7. [DOI] [PubMed] [Google Scholar]
- 16. Shomori K, Sakatani T, Goto A et al. Thymidine phosphorylase expression in human colorectal mucosa, adenoma and carcinoma: role of p53 expression. Pathol Int 1999; 49: 491–9. [DOI] [PubMed] [Google Scholar]
- 17. Tarro G, Perna A, Esposito C. Early diagnosis of lung cancer by detection of tumor liberated protein. J Cell Physiol 2005; 203: 1–5. [DOI] [PubMed] [Google Scholar]
- 18. Soria JC, Moon C, Wang L et al. Effects of N‐(4‐hydroxyphenyl) retinamide on hTERT expression in the bronchial epithelium of cigarette smokers. J Natl Cancer Inst 2001; 15: 1257–63. [DOI] [PubMed] [Google Scholar]
- 19. Kim NW, Piatyszek MA, Prowse KR et al. Specific association of human telomerase activity with immortal cells and cancer. Science 1994; 266: 2011–5. [DOI] [PubMed] [Google Scholar]
- 20. Tatsuma T, Goto S, Kitano S et al. Telomerase activity in peripheral blood for diagnosis of hepatoma. J Gastroenterol Hepatol 2000; 15: 1064–70. [DOI] [PubMed] [Google Scholar]
- 21. Ng EK, Tsui NB, Lam NY et al. Presence of filterable and non‐filterable mRNA in the plasma of cancer patients and healthy individuals. Clin Chem 2002; 48: 1212–7. [PubMed] [Google Scholar]
- 22. Tsui NB, Ng EK, Lo YM. Stability of endogenous and added RNA in blood specimens, serum, and plasma. Clin Chem 2002; 48: 1647–53. [PubMed] [Google Scholar]
- 23. Wege H, Chui MS, Le HT et al. In vitro expansion of human hepatocytes is restricted by telomere‐dependent replicative aging. Cell Transplant 2003; 12: 897–906. [DOI] [PubMed] [Google Scholar]
- 24. Lantuejoul S, Soria JC, Moro‐Sibilot D et al. Differential expression of telomerase reverse transcriptase (hTERT) in lung tumours. Br J Cancer 2004, 2001, 90: 1222–9. [DOI] [PMC free article] [PubMed] [Google Scholar]
- 25. Nicholson RI, Gee JM, Harper ME. EGFR and cancer prognosis. Eur J Cancer 2001; 37: S9–13. [DOI] [PubMed] [Google Scholar]
- 26. Marie Y, Carpentier AF, Omuro AM et al. EGFR tyrosine kinase domain mutations in human glioma. Neurology 2005; 64: 1444–5. [DOI] [PubMed] [Google Scholar]
- 27. Niemiec J, Kolodziejski L, Dyczek S. EGFR LI and KI‐67 LI are independent prognostic parameters influencing survivals of surgically treated squamous cell lung cancer patients. Neoplasia 2005; 52: 231–7. [PubMed] [Google Scholar]
- 28. Cappuzzo F, Hirsch FR, Rossi E et al. Epidermal growth factor receptor gene and protein and gefitinib sensitivity in non‐small‐cell lung cancer. J Natl Cancer Inst 2005; 97: 643–55. [DOI] [PubMed] [Google Scholar]
- 29. Lu C, Soria JC, Tang X et al. Prognostic factors in resected stage I non‐small‐cell lung cancer: A multivariate analysis of six molecular markers. J Clin Oncol 2004; 22: 4575–83. [DOI] [PubMed] [Google Scholar]
- 30. Santoro A, Cavina R, Latteri F et al. Activity of specific inhibitor gefitinib (Iressa, ZD1839), of epidermal growth factor receptor in refractory non‐small‐cell lung cancer. Ann Oncol 2004; 15: 33–7. [DOI] [PubMed] [Google Scholar]