

Abstract
The glycosylation of cell surface proteins is important for cancer biology processes such as cellular proliferation or metastasis. α1,6‐Fucosyltransferase (FUT8) transfers a fucose residue to n‐linked oligosaccharides on glycoproteins. Herein, we study the effect of fucosylation on epidermal growth factor receptor (EGFR) activity and sensitivity to an EGFR‐specific tyrosine kinase inhibitor (EGFR‐TKI). The increased fucosylation of EGFR significantly promoted EGF‐mediated cellular growth, and the decreased fucosylation by stable FUT8 knockdown weakened the growth response in HEK293 cells. The overexpression of FUT8 cells were more sensitive than the control cells to the EGFR‐TKI gefitinib, and FUT8 knockdown decreased the sensitivity to gefitinib. Finally, to examine the effects in a human cancer cell line, we constructed stable FUT8 knockdown A549 cells, and found that these cells also decreased EGF‐mediated cellular growth and were less sensitive than the control cells to gefitinib. In conclusion, we demonstrated that the modification of EGFR fucosylation affected EGF‐mediated cellular growth and sensitivity to gefitinib. Our results provide a novel insight into how the glycosylation status of a receptor may affect the sensitivity of the cell to molecular target agents. (Cancer Sci 2008; 99: 1611–1617)
The glycosylation of cell surface proteins and lipids is modified during the course of differentiation, growth and aging, and various glycoprotein structures are important for biological functions.( 1 ) Proteins and lipids are modified with n‐linked oligosaccharides in the endoplasmic reticulum and Golgi apparatus. n‐Linked oligosaccharides contribute to the folding and stability of glycoproteins.( 2 ) Various glycosyltransferases have been cloned and are known to be involved in the formation of n‐linked oligosaccharides.( 3 , 4 ) Accumulating data has demonstrated that the modification of glycoforms can even change the phenotype of cells.( 5 )
Regarding the relationship between malignancy and n‐linked oligosaccharides, glycoproteins on the cell surface are known to be altered in both quantity and quality during cancerous transformation.( 6 ) Genes are known to determine the specific structures of oligosaccharides during regulated biological processes involved in cancer, such as metastasis.( 7 ) For example, the knockout of n‐acetylglucosaminyltransferaseV (GnT‐V) has been reported to decrease metastasis in mice, indicating that GnT‐V is deeply involved in cancer metastasis.( 8 )
Epidermal growth factor receptor (EGFR) is frequently expressed or highly expressed in lung cancer, ovarian cancer and many other solid tumors,( 9 , 10 , 11 , 12 ) and a high expression level in tumor cells is closely related to a poor prognosis.( 13 , 14 ) Therefore, EGFR is considered an important therapeutic target for the treatment of solid tumors. Tyrosine kinase inhibitors (TKI) that target EGFR, like gefitinib (IRESSA, ZD1839)( 15 , 16 , 17 ) and erlotinib (Tarceva),( 18 ) and the anti‐EGFR antibody cetuximab (IMC‐C225),( 19 ) have been reported to exhibit potential antitumor effects in some solid tumors. Dramatic responses to gefitinib have been observed in non‐small cell lung cancer (NSCLC) patients harboring activating mutations in the EGFR gene involving an exon 19 deletion or an L858R point mutation in exon 21.( 20 , 21 ) However, the sensitivity of a cell to EGFR‐TKI cannot be completely defined by these mutations because tumor response and disease stabilization with gefitinib have also been reported in some NSCLC patients with wild‐type EGFR.( 22 , 23 ) We have searched for predictive biomarkers that determine sensitivity to molecular targeted agents, including gefitinib.( 24 , 25 ) Of additional interest, EGFR contains 11 potential n‐glycosylation sites in its extracellular domain.( 26 )α1,6‐Fucosyltransferase (FUT8) catalyzes the transfer of a fucose group to the innermost n‐acetylglucosamine residue of complex n‐glycans via α1,6‐linkage in mammals. Wang et al. clearly demonstrated that the fucosylation of EGFR catalyzed by FUT8 regulates its receptor activity and signaling in murine cells.( 27 ) However, whether receptor fucosylation affects the sensitivity of human cells to molecular target agents remains uncertain.
Accordingly, we studied the relationship between the fucosylation status of EGFR and sensitivity to gefitinib in HEK293 and a human NSCLC cell, A549.
Materials and Methods
Reagents. Gefitinib (IRESSA, ZD1839) was provided by AstraZeneca (Cheshire, UK).
Expression constructs and viral production. A full‐length cDNA of FUT8, originating from a NSCLC cell line (A549),( 28 ) was amplified using a reverse transcriptase polymerase chain reaction (RT‐PCR). A High Fidelity RNA PCR Kit (TaKaRa, Otsu, Japan) was used for the RT‐PCR, and the following primer set was synthesized: forward, GGA AGT GAG TTG AAA ATC TGA AA; reverse, ACT GAG TTT GGT CGT TTA TCT CT. The PCR products were amplified again using Pyrobest DNA polymerase (TaKaRa) and the following primer set: forward, GCG CTA GCA ATG CGG CCA TGG ACT GGT TC; reverse, CGT GGT ACC TTT CTC AGC CTC AGG ATA TGT. After confirming the sequence, FUT8 cDNA was transferred to pcDNA3.1 (Invitrogen, Carlsbad, CA, USA) with a FLAG‐tag at its C‐terminus. EGFR cDNA with a myc‐tag in pcDNA3.1 and FUT8 cDNA with a FLAG‐tag were cut out and transferred into a pQCLIN retroviral vector (BD Biosciences Clontech, San Diego, CA, USA) together with enhanced green fluorescent protein (EGFP) followed by the internal ribosome entry site sequence (IRES) to monitor the expression of the inserts indirectly. A pVSV‐G vector (Clontech, Palo Alt, CA, USA) for the constitution of the viral envelope, pGP vector (TAKARA Bio) and the pQCXIX constructs were co‐transfected into the HEK293 cells using FuGene6 transfection reagent (Roche Diagnostics, Basel, Switzerland). Briefly, 80% confluent cells cultured in a 10‐cm dish were transfected with 2 µg pVSV‐G plus 6 µg pQCXIX vectors. Forty‐eight hours after transfection, the culture medium was collected and the viral particles were concentrated by centrifugation at 15 000g for 3 h at 4°C. The viral pellet was then resuspended in fresh RPMI‐1640 medium. The titer of the viral vector was calculated by counting the EGFP‐positive cells that were infected by serial dilutions of a virus‐containing medium and then determining the multiplicity of infection (MOI).
FUT8 knockdown by shRNA. We constructed a retroviral vector that stably expressed short hairpin RNA (shRNA) targeting human FUT8. The DNA sequences were designed as follows: forward, GAT CCG TCT CAG AAT TGG CGC TAT GCT GTG AAG CCA CAG ATG GGC ATA GCG CCA ATT CTG AGA CTT TTT TG; reverse, AAT TCA AAA AAG TCT CAG AAT TGG CGC TAT GCC CAT CTG TGG CTT CAC AGC ATA GCG CCA ATT CTG AGA CG. These oligonucleotides were annealed and inserted into an RNAi‐Ready pSIREN‐RetroQ‐ZsGreen vector (Clontech). The viral particles were produced as described in the viral production section.
Cell culture and transfection. HEK293 (a human embryonic kidney cell line) was maintained in Dulbecco's modified Eagle's medium (DMEM) medium and A549 (an NSCLC cell line) was maintained in RPMI‐1640 medium supplemented with 10% fetal bovine serum (FBS). HEK293/EGFR cells were transfected with retrovirus containing FUT8 gene or shRNA for FUT8 (shFUT8) or shRNA control construct and designed as 293/EGFR/FUT8, 293/EGFR/shFUT8 and 293/EGFR/control, respectively. A549 cells were transfected with either shFUT8 or shRNA control and designed as A549/shFUT8 and A549/control, respectively.
α1,6‐Fucosyltransferase activity assay. Cells were lysed with a lysis buffer containing 1% Triton X, 20 mM Tris‐HCl (pH 8.0) and 50 mM NaCl. The fluorescent substrate (GnGn‐bi‐Asn‐PABA; Fig. 1a) was purchased from Peptide Institute (Osaka, Japan). The standard mixture for measuring FUT8 activity contained 50 µM substrate, 200 mM MES (pH 7.0), 1% Triton X, 500 µM GDP‐Fucose and the cell lysate in a final volume of 50 µL. The reaction mixture was incubated at 37°C for 6 h, and the reaction was stopped by heating at 100°C for 1 min. The sample was then centrifuged at 15 000g for 10 min and the supernatant (10 µL) was used for analysis. The product was separated using high‐performance liquid chromatography (HPLC) with a TSK‐gel ODS‐80TM column (4.6 mm × 150 mm). Elution was performed at 55°C with a 20 mM acetate buffer, pH 4.0, containing 0.1% butanol. The fluorescence of the column elute was detected using a fluorescence photometer (Hitachi Fluorescence Spectrophotometer 650–10LC). The excitation and emission wavelengths were observed at 320 and 400 nm, respectively.( 29 )
Figure 1.
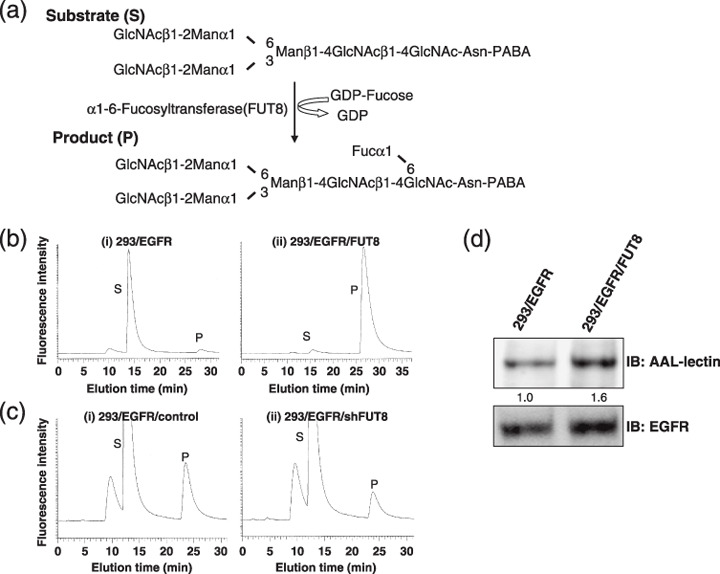
α1,6‐Fucosyltransferase (FUT8) enzyme activity of HEK293 cells. (a) Schema of FUT8 reaction pathway. Asn, asparagine; Fuc, Fucose; Man, mannose; PABA, 4‐(2‐pyridylamino) butylamine. (b) Analysis of FUT8 activity in cells overexpressing FUT8. FUT8 activity was measured using high‐performance liquid chromatography. (i) 293/EGFR; (ii) 293/EGFR/FUT8. P, product; S, substrate. (c) Analysis of FUT8 activity in FUT8 knockdown cells. (i) 293/EGFR/control; (ii) 293/EGFR/shFUT8. (d) Effect of FUT8 overexpression on epidermal growth factor receptor (EGFR) fucosylation. The cell lysate from 293/EGFR or 293/EGFR/FUT8 cells was subjected to sodium dodecylsulfate polyacrylamide gel electrophoresis followed by lectin blotting using biotinylated Aleuria aurantia lectin (AAL). IB, immunoblot.
Immunoprecipitation and immunoblotting. A549 cells were lysed with a lysis buffer containing 1% Triton X, 20 mM Tris‐HCl (pH 7.0), 5 mM ethylenediaminetetraacetic acid (EDTA), 50 mM NaCl, 10 mM Na pyrophosphate, 50 mM NaF, 1 mM Na orthovanadate, and a Complete Mini protease inhibitor mix (Roche Diagnostics). The cell lysate (1 mg) was immunoprecipitated by incubation with anti‐EGFR antibody (Upstate Biotechnology, Lake Placid, NY, USA) overnight, followed by further incubation with protein‐G agarose (Santa Cruz Biotechnology, Santa Cruz, CA, USA) for 1 h and washed with lysis buffer three times. Whole cell lysates and immunoprecipitated samples were separated using sodium dodecylsulfate polyacrylamide gel electrophoresis (SDS‐PAGE) and blotted on a polyvinylidene fluoride (PVDF) membrane. The membranes were blocked with 3% bovine serum albumin (BSA) in Tris‐buffered saline with 0.05% Tween‐20 (TBST) and then probed with monoclonal anti‐EGFR antibody (Upstate Biotechnology), monoclonal phospho‐tyrosine antibody, p44/42 MAP kinase antibody or phospho‐p44/42 MAP kinase antibody (Cell Signaling, Beverly, MA, USA), followed by incubation with a monoclonal or polyclonal HRP‐conjugated secondary antibody (Cell Signaling). An enhanced chemiluminescence detection system (GE Healthcare, Buckinghamshire, UK) was then used for visualization. Images were visualized by LAS‐3000 (Fujifilm, Tokyo, Japan) and the data were quantified by automated densitometry using Multigauge ver. 3.0 (Fujifilm).
Lectin blotting. Whole cell lysates and immunoprecipitated samples were separated using SDS‐PAGE and blotted on a PVDF membrane. The membrane was blocked with 5% BSA in TBST for 1 h at room temperature. The membrane was probed with biotinylated aleuria aurantia lectin (AAL, Seikagaku, Tokyo, Japan) for 1 h at room temperature, washed, and treated using the Vectastain ABC kit (Vector Laboratories, Burlingame, CA, USA) as a second antibody.
Cell proliferation assay. To evaluate the growth response to EGF stimulation, we used the tetrazolium dye (3,4,5‐dimethyl‐2H‐tetrazolium bromide, MTT) assay. The cells were seeded at a density of 0.5–1.5 × 10³ cells/well in 96‐well plates under a serum‐reduced condition (HEK293 cells, 4% FBS; A549 cells, 2% FBS). Twenty‐four hours later, the cells were stimulated with EGF (R&D Systems, Minneapolis, MN, USA) at 20 ng/mL. After 48–72 h of incubation at 37°C, the MTT solution was added to each well and the plates were incubated for 3 h at 37°C. After centrifuging the plates at 400g for 5 min, the medium was discarded from each well, and 200 µL of dimethylsulfoxide was added to each well. The optical density was measured at 570 nm. For the growth curve experiments, the cells were seeded at a density of 2 × 10³ cells/well in 96‐well plates in the presence of 10% FBS or under the serum‐reduced condition in the presence of 20 ng/mL of EGF. Cell proliferation was estimated by measuring the absorbance at 570 nm at 24 h intervals up to 72 h.
Growth inhibitory assay. To evaluate the growth inhibition in the presence of various concentrations of gefitinib, we used the MTT assay. The cells were seeded at a density of 1.5 or 2 × 10³ cells/well in 96‐well plates in the presence of 10% FBS or under the serum‐reduced condition in the presence of 20 ng/mL of EGF. Twenty‐four hours later, gefitinib was added and the incubation was continued further for 72 h at 37°C. The assay was conducted in triplicate.
Soft agar assay for colony formation. To confirm the data obtained from the growth inhibitory assay, we performed colony assays of A549 cells. Five hundred cells in 0.35% agar in DMEM containing 10% FBS and each concentration of EGF or gefitinib were seeded onto 6‐well plates on an underlayer of 0.5% agar containing DMEM. The plates were incubated at 37°C for 14 days, and then the colonies were stained by crystal violet and counted under a microscope. The colony assay was performed in triplicate.
Statistical analysis. All statistical calculations were performed using a Student's t‐test by StatView ver. 5 software (SAS Institute, Cary, NC, USA). P < 0.05 was considered significant.
Result
Establishment of FUT8 overexpression and knockdown cells. To examine whether an increase or decrease in the fucosylation of EGFR affected EGF‐mediated cellular growth and sensitivity to gefitinib, we transfected EGFR and FUT8 retrovirally. We also constructed 293/EGFR/shFUT8 cells by the stable knockdown of intrinsic FUT8. FUT8 enzyme activity was measured by reverse‐phase HPLC using a fluorescent substrate (GnGn‐bi‐Asn‐PABA; Fig. 1a). FUT8 activity was 25‐times higher in 293/EGFR/FUT8 cells than in 293/EGFR (44.1 U/L and 1.8 U/L, respectively; Fig. 1b). On the other hand, the activity in 293/EGFR/shFUT8 cells was 43% of that in 293/EGFR/control cells (Fig. 1c). We next compared fucosylated EGFR between 293/EGFR and 293/EGFR/FUT8 cells using lectin blotting with Aleuria aurantia lectin, which recognizes core fucosylation on n‐glycans. The fucosylation of EGFR was increased in 293/EGFR/FUT8 cells, compared with that in 293/EGFR cells (Fig. 1d). These findings indicated that the overexpression or knockdown of FUT8 was functional and FUT8 regulated the fucosylation of EGFR, as expected.
EGFR fucosylation regulates EGF‐mediated cellular growth in HEK293 and A549 cells. We next examined whether EGFR fucosylation affected the cellular growth in response to EGF ligand stimulation. Overexpression of FUT8 was associated with a significant increase, by approximately 20%, of the cellular growth in response to EGF stimulation (P < 0.05; Fig. 2a). In growth curve experiments, the proliferative activity of 293/EGFR/FUT8 cells was slightly increased as compared with that of 293/EGFR cells under normal conditions of culture in the presence of 10% FBS (Fig. 2b). The doubling times of 293/EGFR/FUT8 and 293/EGFR cells were 27.5 and 28.5 h, respectively. However, remarkable increase of the proliferative activity of 293/EGFR/FUT8 cells was observed as compared with that of the 293/EGFR cells in the presence of EGF stimulation (P < 0.05; Fig. 2c); the doubling times under this condition were 23.9 and 25.4 h, respectively. Next, FUT8 knockdown significantly decreased, by approximately 20%, the cellular growth in response to EGF stimulation (P < 0.05; Fig. 2d). In growth curve experiments, there was no difference in the proliferative activity between 293/EGFR/shFUT8 cells and 293/EGFR/control cells under normal conditions of culture (Fig. 2e), but significant decrease of the proliferative activity of 293/EGFR/shFUT8 cells was found as compared with that of the 293/EGFR/control cells in the presence of EGF stimulation (P < 0.05; Fig. 2f); the doubling times of the 293/EGFR/shFUT8 and 293/EGFR/control cells under this condition were 28.8 and 27.3 h, respectively. These findings suggest that the level of EGFR fucosylation regulated the cellular growth in response to EGF. To study whether the same phenomenon occurs in human cancer cells, we constructed A549/shFUT8, in which FUT8 was stably knocked down, and examined the relationship between the fucosylation level of EGFR and the response to EGF ligand stimulation. No FUT8 catalytic activity was detected by FUT8 knockdown in the A549 cells (Fig. 3a). A lectin blot analysis demonstrated that the fucosylation of EGFR was decreased in A549/shFUT8 cells, while the expression level of EGFR was similar in the control cells (Fig. 3b). We examined whether this reduction in EGFR fucosylation affected the EGF‐mediated growth response. We found that A549/shFUT8 cells had significantly decreased EGF‐mediated cellular growth by approximately 20%, compared with control cells (P < 0.05; Fig. 3c) by the MTT assay. In the growth curve experiments, a slight decrease of the proliferative activity of the A549/shFUT8 cells was observed as compared with that of the A549/control cells under normal conditions of culture in the presence of 10% FBS (Fig. 3d); the doubling times of the A549/shFUT8 and A549/control cells were 23.1 and 22.7 h, respectively. However, the A549/shFUT8 cells showed marked decrease of proliferative activity as compared with A549/control cells in the presence of EGF stimulation (P < 0.05, Fig. 3e); the doubling times of the A549/shFUT8 and A549/control cells were 22.2 and 20.8 h, respectively. These results suggest that the level of EGFR fucosylation regulated the cellular growth in response to EGF even in human cancer cells.
Figure 2.
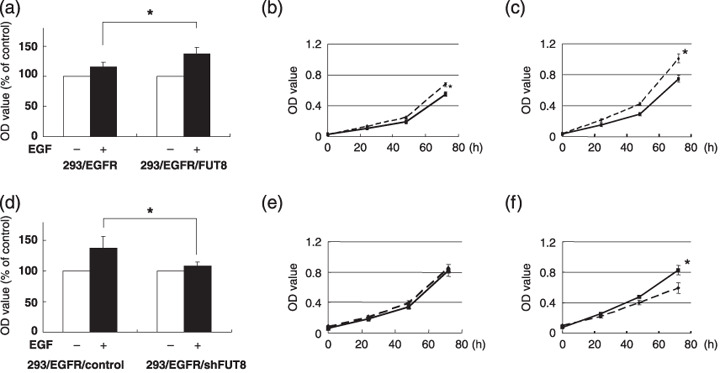
Cellular growth response to epidermal growth factor (EGF) stimulation in HEK293 cells. (a) The 293/EGFR and 293/EGFR/FUT8 cells were seeded (1.5 × 10³ cells/well) in 96‐well plates under a serum‐reduced condition and stimulated with 20 ng/mL of EGF and further incubated for 48 h at 37°C. ( ), EGF (–); (
 ), EGF (+). (b) Growth curve experiments in the 293/EGFR (solid line) and 293/EGFR/FUT8 (dotted line) cells. The cells were cultured under a 10% fetal bovine serum (FBS) condition. (c) The 293/EGFR (solid line) and 293/EGFR/FUT8 (dotted line) cells were cultured under the presence of 20 ng/mL of EGF to a serum‐reduced condition. (d) The 293/EGFR/control and 293/EGFR/shFUT8 cells were seeded (1.5 × 10³ cells/well) in 96‐well plates under a serum‐reduced condition and stimulated with 20 ng/mL of EGF and incubated for 72 h at 37°C. (), EGF (–); (), EGF (+). (e) Growth curve experiments in the 293/EGFR/control (solid line) and 293/EGFR/shFUT8 (dotted line) cells. The cells were cultured under a 10% FBS condition. (f) The 293/EGFR/control (solid line) and 293/EGFR/shFUT8 (dotted line) cells were cultured under the presence of 20 ng/mL of EGF to a serum‐reduced condition. OD value, 570 nm. *P < 0.05; scale lines, standard deviation (SD).
Figure 3.
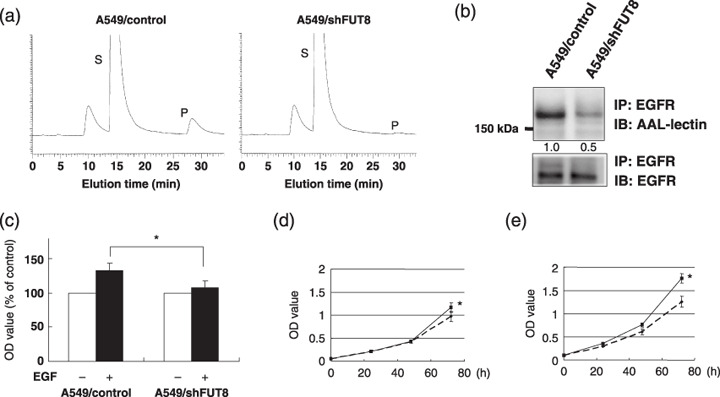
α1,6‐Fucosyltransferase (FUT8) knockdown weakened growth response to epidermal growth factor (EGF) stimulation in A549 cells. (a) FUT8 activity was analyzed using high‐performance liquid chromatography. P, product; S, substrate. (b) Effect of FUT8 knockdown on EGF receptor (EGFR) fucosylation in A549 cells. The cell lysate was immunoprecipitated using anti‐EGFR antibody, and the sample was separated using sodium dodecylsulfate polyacrylamide gel electrophoresis followed by blotting biotinylated Aleuria aurantia lectin (AAL) or monoclonal anti‐EGFR antibody. IB, immunoblot; IP, immunoprecipitate. (c) The cells were seeded (0.5 × 10³ cells/well) in 96‐well plates under a serum‐reduced condition. Twenty‐four hours later, the cells were stimulated with 20 ng/mL of EGF and further incubated for 48 h. (), EGF (–); (), EGF (+). (d) Growth curve experiments in the A549/control (solid line) and A549/shFUT8 (dotted line) cells. The cells were cultured under a 10% fetal bovine serum condition. (e) The A549/control (solid line) and A549/shFUT8 (dotted line) cells were cultured under the presence of 20 ng/mL of EGF to a serum‐reduced condition. OD value, 570 nm. *P < 0.05; scale lines, standard deviation.
Modification of EGFR fucosylation affects cell sensitivity to gefitinib. We then examined whether an increase or decrease in EGFR fucosylation affected the sensitivity of HEK293 cells to gefitinib. Overexpression of FUT8 significantly enhanced the cellular sensitivity to gefitinib as compared with that of the control cells in the presence of EGF under a serum‐reduced condition; the IC50 values of the drug for these cells were 3.5 ± 0.1 and 5.6 ± 0.3, respectively (P < 0.05; Fig. 4a). However, no significant difference in the IC50 values of the drug was noted between the two types of cells under normal culture conditions in the presence of 10% FBS (Fig. 4b). In addition, FUT8 knockdown significantly decreased the cellular sensitivity to gefitinib as compared with that of the control cells in the presence of EGF under the serum‐reduced condition; the IC50 values of the drug for these cells were 7.3 ± 0.4 and 4.4 ± 1.0, respectively (P < 0.05; Fig. 4c). On the other hand, no significant difference in the IC50 values of the drug were noted among the cells when they were cultured under normal conditions (Fig. 4d). These results suggest that EGFR fucosylation modulates the cellular sensitivity to gefitinib.
Figure 4.
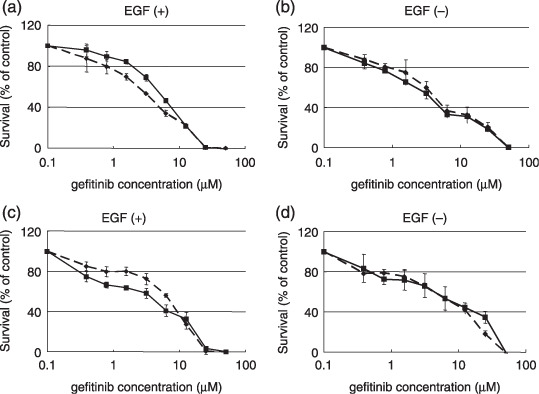
Sensitivity of HEK293 cells to gefitinib. The cells were seeded at a density of 2 × 10³ cells/well in 96‐well plates. Twenty‐four hours later, the cells were exposed to gefitinib and were then incubated for 72 h at 37°C. The cell growth was quantitated using an 3,4,5‐dimethyl‐2H‐tetrazolium bromide (MTT) assay. (a) 293/EGFR (solid line) and 293/EGFR/FUT8 (dotted line) were cultured under the presence of 20 ng/mL of EGF to a serum‐reduced condition. (b) 293/EGFR (solid line) and 293/EGFR/FUT8 (dotted line) were cultured under a 10% fetal bovine serum (FBS) condition. (c) 293/EGFR/control cells (solid line) and 293/EGFR/shFUT8 cells (dotted line) were cultured under the presence of 20 ng/mL of EGF to a serum‐reduced condition. (d) 293/EGFR/control cells (solid line) and 293/EGFR/shFUT8 cells (dotted line) were cultured under a 10% FBS condition. Scale lines, standard deviation.
We also examined the sensitivity of A549 cells to gefitinib. FUT8 knockdown significantly decreased the sensitivity of the A549 cells to gefitinib in the presence of 20 ng/mL of EGF under the serum‐reduced condition; the IC50 values of the A549/shFUT8 and A549/control cells were 3.1 ± 0.3 and 1.3 ± 0.2, respectively (P < 0.05; Fig. 5a). However, no significant difference in the IC50 values were noted among the cells when they were cultured under normal conditions, similar to the observations for HEK293 cells (Fig. 5b). These results suggest that the EGFR fucosylation level affected the sensitivity of human cancer cells to gefitinib. To confirm the data obtained from the growth inhibitory assay, we performed colony assays with the A549 cells. Colony formation of A549/control, but not of the A549/shFUT8 cells, was significantly inhibited by 1 µM gefitinib (P < 0.05; Fig. 5c).
Figure 5.
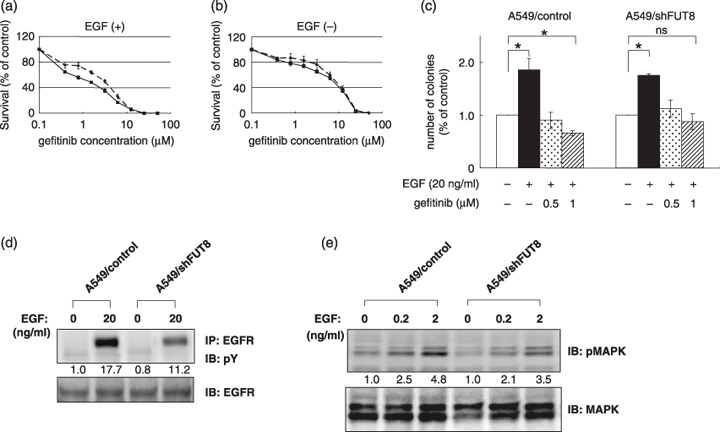
α1,6‐Fucosyltransferase (FUT8) knockdown decreased the sensitivity of A549 cells to gefitinib, epidermal growth factor receptor (EGFR) phosphorylation and EGFR‐mediated intracellular signaling. (a) A549/control cells (solid line) and A549/shFUT8 cells (dotted line) were seeded at a density of 1.5 × 10³ cells/well in 96‐well plates. Twenty‐four hours later, the cells were exposed to gefitinib and were then incubated for 72 h at 37°C. The cells were cultured under the presence of 20 ng/mL of EGF to a serum‐reduced condition. (b) A549/control cells (solid line) and A549/shFUT8 cells (dotted line) were cultured under a 10% fetal bovine serum condition. Scale lines, standard deviation (SD). (c) Colony assay in A549/control cells and A549/shFUT8 cells. The cells were cultured for 14 days under the presence or absence of EGF or gefitinib. *P < 0.05; scale lines, SD. (d) A549 cells were cultured under a serum‐free condition for 6 h, and the cells were stimulated with 20 ng/mL of EGF for 10 min. The cell lysate was immunoprecipitated using anti‐EGFR antibody and immunoblotted using antiphospho‐tyrosine antibody (pY). (e) A549 cells were stimulated with 0.2 ng/mL or 2 ng/mL EGF for 10 min. The cell lysate was separated using sodium dodecylsulfate polyacrylamide gel electrophoresis and then immunoblotted using antiphospho p44/42 mitogen‐activated protein kinase (pMAPK) antibody and antip44/42 MAPK (MAPK) antibody. IB, immunoblot; IP, immunoprecipitate.
Fucosylation status of EGFR regulates EGFR signaling. We examined the effect of FUT8 knockdown on the phosphorylation levels of EGFR and the EGFR‐mediated intracellular signaling pathway in A549 cells. FUT8 knockdown decreased the phosphorylation levels of EGFR in the presence of EGF stimulation (Fig. 5d). FUT8 knockdown also decreased the EGF‐mediated phosphorylation of mitogen‐activated protein kinase in the presence of 0.2 and 2 ng/mL of EGF (Fig. 5e). These results suggest that low EGFR fucosylation levels decrease the EGFR‐mediated intracellular signaling pathway's response to EGF stimulation.
Discussion
The purpose of this study was to investigate whether the modification of EGFR fucosylation affected EGF‐mediated cellular growth and cell sensitivity to gefitinib. We found that the increase in EGFR fucosylation resulting from FUT8 overexpression enhanced the response to EGF stimulation and the sensitivity of the cells to gefitinib. A decrease in EGFR fucosylation resulting from FUT8 knockdown weakened the EGF‐mediated cellular growth response and cell sensitivity.
Two possible mechanisms may explain how EGFR fucosylation affects the EGF‐mediated growth response. First, the binding affinity of EGFR to the EGF ligand might be affected by the modified fucosylation of the receptor. n‐Acetylglucosaminyltransferase III (GnT III) is known to catalyze the addition of n‐acetylglucosamine in β1‐4 linkage to the β‐linked mannose of the trimannosyl core of n‐linked oligosaccharides to produce a bisecting GlcNac residue. Rebbaa et al. reported that the overexpression of GnT III in glioma cells modifies the glycosylation of its receptor, resulting in a decrease in EGF binding and EGFR autophosphorylation;( 30 ) this finding suggests that the carbohydrate structure at the extracellular domain of EGFR affects the binding affinity with its ligand and the receptor activity. This evidence supports this first possible mechanism. Another possibility is that the ability of the receptor to form dimers might be affected by the glycosylation of the receptor. Tsuda et al. reported that a specific n‐glycosylation mutant of domain III of EGFR leads to ligand‐independent dimerization and phosphorylation, resulting in the spontaneous activation of the receptor.( 31 ) These findings indicate that n‐linked oligosaccharides in extracellular domain III of EGFR play a crucial role in receptor dimerization, independent of ligand binding. The type III EGFR (EGFRvIII), which lacks exons 2–7 in the extracellular domain, is constitutively phosphorylated independently of EGF‐ligand stimulation. Fernandes et al. demonstrated that the receptor–receptor self association is highly dependent on a conformation induced by n‐linked glycosylation, suggesting that n‐linked oligosaccharides play an important role in this autodimerization.( 32 )
Regarding fucosylation, Wang et al. reported that EGF decreased EGF binding to EGFR in Fut8 knockout mice, resulting in a higher responsiveness of the receptor to its ligand.( 27 ) Many studies have reported that the mutant EGFR (i.e. 15‐base deletion or L858R) signaling is constitutively active without ligand condition. Thus, we speculated that wild‐type EGFR might be suitable for a study of the effects of fucosylation. Our results also demonstrate that modifications of EGFR fucosylation through the overexpression or knockdown of FUT8 alter EGF‐mediated cellular growth responses in both HEK293 and A549 cells.
Epidermal growth factor receptor is overexpressed in various human tumors, and the overexpression of EGFR is associated with a poor prognosis.( 33 ) Many researchers have studied the biological and clinical significance of EGFR mutations, including exon 19 deletions and the L858R point mutation in exon 21, which behave like constitutively‐active receptors.( 34 , 35 , 36 ) Patients with constitutively‐active mutants of EGFR are more sensitive to gefitinib. However, some patients respond to EGFR‐TKI even though they do not carry such EGFR mutations;( 22 , 23 ) suggesting the presence of one or more undefined factors that affects sensitivity to gefitinib in addition to EGFR mutations. Although the impact on sensitivity to gefitinib is smaller than that of EGFR mutations, we have shown that modifications in wild‐type EGFR fucosylation also affect sensitivity to gefitinib. Our findings raise the possibility that the status of EGFR fucosylation may be another determinant of sensitivity to gefitinib.
In conclusion, we have demonstrated that the fucosylation level of EGFR, which was regulated by FUT8, modifies EGF‐mediated cellular growth and affects sensitivity to gefitinib.
Acknowledgments
This work was supported by funds for the Third‐Term Comprehensive 10‐Year Strategy for Cancer Control and for Health and Labor Scientific Research Grants, Research on Advanced Medical Technology H17‐Pharmaco‐006. K. M is the recipient of a Research Resident Fellowship from the Foundation of Promotion of Cancer Research in Japan.
References
- 1. Hakomori Si SI. Inaugural Article: The glycosynapse. Proc Natl Acad Sci USA 2002; 99: 225–32. [DOI] [PMC free article] [PubMed] [Google Scholar]
- 2. Helenius A, Aebi M. Intracellular functions of N‐linked glycans. Science 2001; 291: 2364–9. [DOI] [PubMed] [Google Scholar]
- 3. Sato T, Furukawa K, Bakker H, Van den Eijnden DH, Van Die I. Molecular cloning of a human cDNA encoding beta‐1,4‐galactosyltransferase with 37% identity to mammalian UDP‐Gal: GlcNAc beta‐1,4‐galactosyltransferase. Proc Natl Acad Sci USA 1998; 95: 472–7. [DOI] [PMC free article] [PubMed] [Google Scholar]
- 4. Almeida R, Amado M, David L et al . A family of human beta4‐galactosyltransferases. Cloning and expression of two novel UDP‐galactose: beta‐n‐acetylglucosamine beta1, 4‐galactosyltransferases, beta4Gal‐T2 and beta4Gal‐T3. J Biol Chem 1997; 272: 31 979–91. [DOI] [PubMed] [Google Scholar]
- 5. Coetzee T, Fujita N, Dupree J et al . Myelination in the absence of galactocerebroside and sulfatide: normal structure with abnormal function and regional instability. Cell 1996; 86: 209–19. [DOI] [PubMed] [Google Scholar]
- 6. Dennis JW. Asn‐linked oligosaccharide processing and malignant potential. Cancer Surv 1988; 7: 573–95. [PubMed] [Google Scholar]
- 7. Dennis JW, Laferte S, Waghorne C, Breitman ML, Kerbel RS. Beta 1‐6 branching of Asn‐linked oligosaccharides is directly associated with metastasis. Science 1987; 236: 582–5. [DOI] [PubMed] [Google Scholar]
- 8. Granovsky M, Fata J, Pawling J, Muller WJ, Khokha R, Dennis JW. Suppression of tumor growth and metastasis in Mgat5‐deficient mice. Nat Med 2000; 6: 306–12. [DOI] [PubMed] [Google Scholar]
- 9. Ang KK, Berkey BA, Tu X et al . Impact of epidermal growth factor receptor expression on survival and pattern of relapse in patients with advanced head and neck carcinoma. Cancer Res 2002; 62: 7350–6. [PubMed] [Google Scholar]
- 10. Rusch V, Klimstra D, Venkatraman E, Pisters PW, Langenfeld J, Dmitrovsky E. Overexpression of the epidermal growth factor receptor and its ligand transforming growth factor alpha is frequent in resectable non‐small cell lung cancer but does not predict tumor progression. Clin Cancer Res 1997; 3: 515–22. [PubMed] [Google Scholar]
- 11. Watanabe K, Tachibana O, Sata K, Yonekawa Y, Kleihues P, Ohgaki H. Overexpression of the EGF receptor and p53 mutations are mutually exclusive in the evolution of primary and secondary glioblastomas. Brain Pathol 1996; 6: 217–23; discussion 23–4. [DOI] [PubMed] [Google Scholar]
- 12. Lipponen P, Eskelinen M. Expression of epidermal growth factor receptor in bladder cancer as related to established prognostic factors, oncoprotein (c‐erbB‐2, p53) expression and long‐term prognosis. Br J Cancer 1994; 69: 1120–5. [DOI] [PMC free article] [PubMed] [Google Scholar]
- 13. Khorana AA, Ryan CK, Cox C, Eberly S, Sahasrabudhe DM. Vascular endothelial growth factor, CD68, and epidermal growth factor receptor expression and survival in patients with Stage II and Stage III colon carcinoma: a role for the host response in prognosis. Cancer 2003; 97: 960–8. [DOI] [PubMed] [Google Scholar]
- 14. Magne N, Pivot X, Bensadoun RJ et al . The relationship of epidermal growth factor receptor levels to the prognosis of unresectable pharyngeal cancer patients treated by chemo‐radiotherapy. Eur J Cancer 2001; 37: 2169–77. [DOI] [PubMed] [Google Scholar]
- 15. Koizumi F, Kanzawa F, Ueda Y et al . Synergistic interaction between the EGFR tyrosine kinase inhibitor gefitinib (‘Iressa’) and the DNA topoisomerase I inhibitor CPT‐11 (irinotecan) in human colorectal cancer cells. Int J Cancer 2004; 108: 464–72. [DOI] [PubMed] [Google Scholar]
- 16. Naruse I, Ohmori T, Ao Y et al . Antitumor activity of the selective epidermal growth factor receptor‐tyrosine kinase inhibitor (EGFR‐TKI) Iressa (ZD1839) in an EGFR‐expressing multidrug‐resistant cell line in vitro and in vivo. Int J Cancer 2002; 98: 310–15. [DOI] [PubMed] [Google Scholar]
- 17. Fukuoka M, Yano S, Giaccone G et al . Multi‐institutional randomized phase II trial of gefitinib for previously treated patients with advanced non‐small‐cell lung cancer. J Clin Oncol 2003; 21: 2237–46. [DOI] [PubMed] [Google Scholar]
- 18. Sandler A. Clinical experience with the HER1/EGFR tyrosine kinase inhibitor erlotinib. Oncology (Huntingt) 2003; 17: 17–22. [PubMed] [Google Scholar]
- 19. Herbst RS, Hong WK. IMC‐C225, an anti‐epidermal growth factor receptor monoclonal antibody for treatment of head and neck cancer. Semin Oncol 2002; 29: 18–30. [DOI] [PubMed] [Google Scholar]
- 20. Lynch TJ, Bell DW, Sordella R et al . Activating mutations in the epidermal growth factor receptor underlying responsiveness of non‐small‐cell lung cancer to gefitinib. N Engl J Med 2004; 350: 2129–39. [DOI] [PubMed] [Google Scholar]
- 21. Paez JG, Janne PA, Lee JC et al . EGFR mutations in lung cancer: correlation with clinical response to gefitinib therapy. Science 2004; 304: 1497–500. [DOI] [PubMed] [Google Scholar]
- 22. Han SW, Kim TY, Hwang PG et al . Predictive and prognostic impact of epidermal growth factor receptor mutation in non‐small‐cell lung cancer patients treated with gefitinib. J Clin Oncol 2005; 23: 2493–501. [DOI] [PubMed] [Google Scholar]
- 23. Takano T, Ohe Y, Sakamoto H et al . Epidermal growth factor receptor gene mutations and increased copy numbers predict gefitinib sensitivity in patients with recurrent non‐small‐cell lung cancer. J Clin Oncol 2005; 23: 6829–37. [DOI] [PubMed] [Google Scholar]
- 24. Kimura H, Kasahara K, Kawaishi M et al . Detection of epidermal growth factor receptor mutations in serum as a predictor of the response to gefitinib in patients with non‐small‐cell lung cancer. Clin Cancer Res 2006; 12: 3915–21. [DOI] [PubMed] [Google Scholar]
- 25. Sakai K, Yokote H, Murakami‐Murofushi K, Tamura T, Saijo N, Nishio K. In‐frame deletion in the EGF receptor alters kinase inhibition by gefitinib. Biochem J 2006; 397: 537–43. [DOI] [PMC free article] [PubMed] [Google Scholar]
- 26. Whitson KB, Whitson SR, Red‐Brewer ML et al . Functional effects of glycosylation at Asn‐579 of the epidermal growth factor receptor. Biochemistry 2005; 44: 14 920–31. [DOI] [PubMed] [Google Scholar]
- 27. Wang X, Gu J, Ihara H, Miyoshi E, Honke K, Taniguchi N. Core fucosylation regulates epidermal growth factor receptor‐mediated intracellular signaling. J Biol Chem 2006; 281: 2572–7. [DOI] [PubMed] [Google Scholar]
- 28. Fukuoka K, Nishio K, Fukumoto H et al . Ectopic p16 (ink4) expression enhances CPT‐11‐induced apoptosis through increased delay in S‐phase progression in human non‐small‐cell‐lung‐cancer cells. Int J Cancer 2000; 86: 197–203. [DOI] [PubMed] [Google Scholar]
- 29. Uozumi N, Teshima T, Yamamoto T et al . A fluorescent assay method for GDP‐L‐Fuc: N‐acetyl‐beta‐D‐glucosaminide alpha 1‐6fucosyltransferase activity, involving high performance liquid chromatography. J Biochem (Tokyo) 1996; 120: 385–92. [DOI] [PubMed] [Google Scholar]
- 30. Rebbaa A, Yamamoto H, Saito T et al . Gene transfection‐mediated overexpression of beta1,4‐N‐acetylglucosamine bisecting oligosaccharides in glioma cell line U373 MG inhibits epidermal growth factor receptor function. J Biol Chem 1997; 272: 9275–9. [DOI] [PubMed] [Google Scholar]
- 31. Tsuda T, Ikeda Y, Taniguchi N. The Asn‐420‐linked sugar chain in human epidermal growth factor receptor suppresses ligand‐independent spontaneous oligomerization. Possible role of a specific sugar chain in controllable receptor activation. J Biol Chem 2000; 275: 21 988–94. [DOI] [PubMed] [Google Scholar]
- 32. Fernandes H, Cohen S, Bishayee S. Glycosylation‐induced conformational modification positively regulates receptor–receptor association: a study with an aberrant epidermal growth factor receptor (EGFRvIII/DeltaEGFR) expressed in cancer cells. J Biol Chem 2001; 276: 5375–83. [DOI] [PubMed] [Google Scholar]
- 33. Selvaggi G, Novello S, Torri V et al . Epidermal growth factor receptor overexpression correlates with a poor prognosis in completely resected non‐small‐cell lung cancer. Ann Oncol 2004; 15: 28–32. [DOI] [PubMed] [Google Scholar]
- 34. Tracy S, Mukohara T, Hansen M, Meyerson M, Johnson BE, Janne PA. Gefitinib induces apoptosis in the EGFRL858R non‐small‐cell lung cancer cell line H3255. Cancer Res 2004; 64: 7241–4. [DOI] [PubMed] [Google Scholar]
- 35. Chen YR, Fu YN, Lin CH et al . Distinctive activation patterns in constitutively active and gefitinib‐sensitive EGFR mutants. Oncogene 2006; 25: 1205–15. [DOI] [PubMed] [Google Scholar]
- 36. Sordella R, Bell DW, Haber DA, Settleman J. Gefitinib‐sensitizing EGFR mutations in lung cancer activate anti‐apoptotic pathways. Science 2004; 305: 1163–7. [DOI] [PubMed] [Google Scholar]