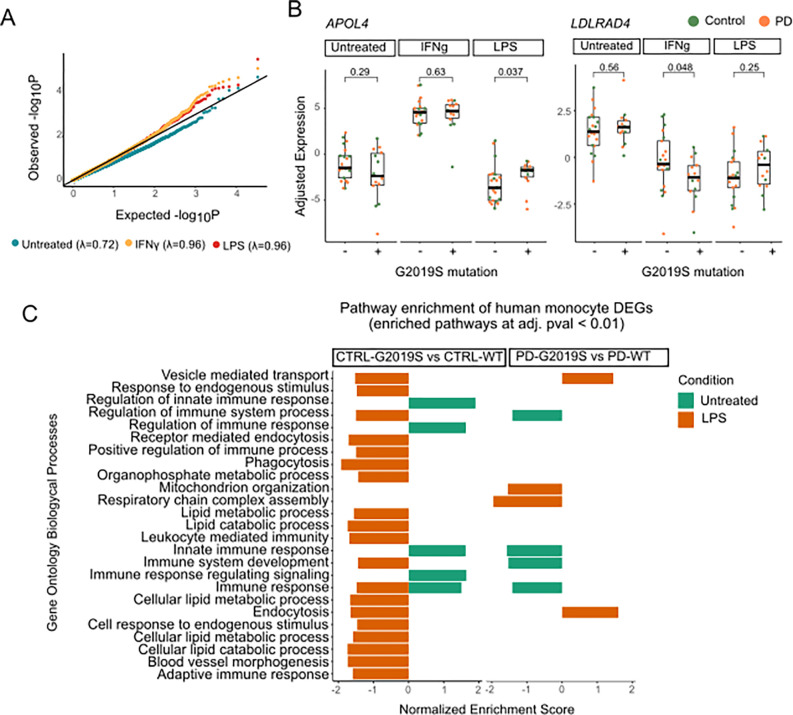
Figure 5. Patient derived monocytes carrying the G2019S mutation show transcriptomic dysregulation.
(A) Quantile quantile (qq)-plot shows the observed distribution of P values which deviates from the expected uniform distribution across the three different treatments. The genomic inflation factor (λ or X2 median) was calculated as the measure of deviations of the observed distribution from the expected null distribution. (B) Examples of selected DEGs (APOL4 on the left and LDLRAD4 on the right) in which there is significant interaction between treatment and genotype. Adjusted expression of voom normalized counts after regression of covariates is shown. In boxplots, the line represents the median and boxes extend from the 25th to the 75th percentile. P-values calculated with Wilcoxon test. (C) Pathway enrichment analysis of G2019S carriers vs non carriers distributed by diagnosis, control on the left and PD on the right. Pathway enrichment was performed with a pre ranked approach from GSEA using Biological Processes. Y axis shows the significant pathways and x axis normalized expression score. Only significant pathways with q-value < 0.01 are shown.

