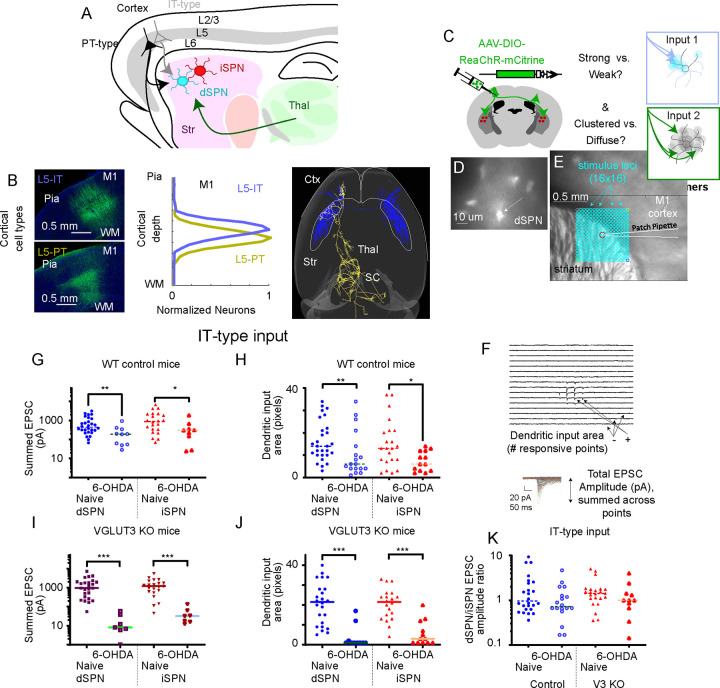
Figure 5. Quantification of Cell Type-Specific Corticostriatal Connection Strength.
(A) Layer 5 IT-type (gray) and PT-type (black) neurons project to dSPN (blue) and iSPN (red) in striatum. Thalamus (green) also excites these targets.
(B) Cre-driver mouse lines label IT-type neurons (top, PL56-Cre) and PT-type neurons (bottom, KJ18-Cre) with AAV-DIO-EGFP. Image shows cell bodies in forelimb M1, with pia and white matter (WM) marked for reference. The laminar distribution of labeled neurons in these mouse lines is shown in the center. At right, example reconstructed axons of a single IT-type neuron (blue) and a single PT-type neuron (gold) are shown from above, with targets in cortex (ctx), striatum (str), thalamus (thal), and superior colliculus (SC) shown.
(C) Stereotaxic AAV injection of Cre-dependent opsin makes IT-type (green; or PT-type, not shown) axons excitable for recording input to dSPN (transgenically labeled with Drd1a-tdTomato) or in neighboring iSPN cells. Experiments test whether input is strong or weak and clustered or diffuse.
(D) 60x fluorescence image of tdTomato+ dSPN in a PL56-Cre+, Drd1a-tdTomato+ striatal brain slice.
(E) 4x brightfield image of coronal brain slice. dSPN soma (center, red circle) shown with teal points for input mapping with sCRACM. 16×16 array of points are spaced at 50 mm.
(F) Responses to 1 ms, 1 mW 470 nm laser stimuli displayed in relative location in the dendritic arbor. Non-responsive points are flat. Inset shows mean responses at each point aligned (mean of 2–5 sweeps). Total EPSC amplitude and number of input points is quantified.
(G) Total EPSC amplitude on a log scale to dSPN and iSPN from IT-type neurons in naive conditions and following 6-OHDA depletion.
(H) Dendritic input area to dSPN and iSPN from IT-type neurons, plotted as for EPSC strength. (I,J) Total EPSC amplitude on a log scale and dendritic input area to dSPN and iSPN from IT-type neurons in naive conditions and following 6-OHDA depletion for VGLUT3 KO mice.
(I) (K) dSPN/iSPN input ratio for summed EPSC amplitude. Data are compared by Mann-Whitney. *, p<0.05; **, p<0.01, ***, p<0.001.

