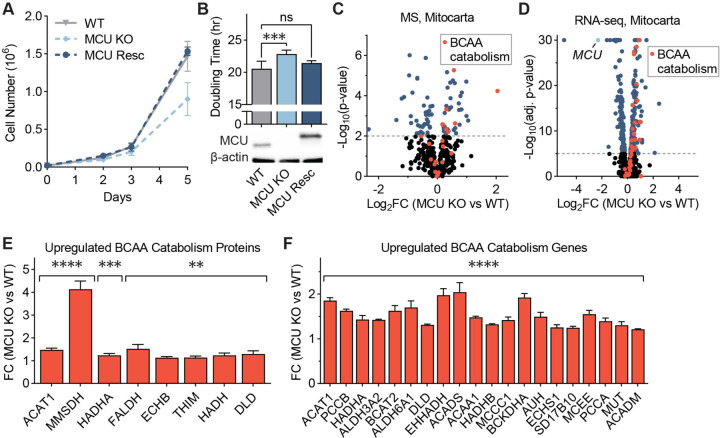
Figure 1: MCU KO cells exhibit growth defects and altered mitochondrial proteome.
(A) WT, MCU KO, and MCU rescue cells were counted on days 2, 3, and 5 after plating; n=4–6. (B) HeLa cell doubling times were calculated from cell counts on days 2 and 5 in (A); statistical significance was determined by Dunnett’s multiple comparisons test following one-way ANOVA; expression of MCU and MCU-FLAG was confirmed by Western blot. (C) Volcano plot shows relative abundance of mitochondrial proteins in MCU KO cells compared to WT cells. Red points indicate proteins in the valine, leucine, and isoleucine degradation KEGG pathway; n=5. (D) Volcano plot shows relative abundance of mRNAs encoding mitochondrial proteins in MCU KO cells compared to WT cells. Red points indicate genes in the valine, leucine and isoleucine degradation KEGG pathway; MCU is marked in light blue; n=3. (E, F) Fold change (FC) of valine, leucine, and isoleucine degradation-associated proteins (E) and genes (F) enriched in MCU KO cells in (C, D); proteins and genes are listed in order of ascending p-value. All error bars represent standard deviation; ns indicates non-significant, * indicates a p-value < 0.05, ** indicates a p-value < 0.01, *** indicates a p-value < 0.001, and **** indicates a p-value < 0.0001.

