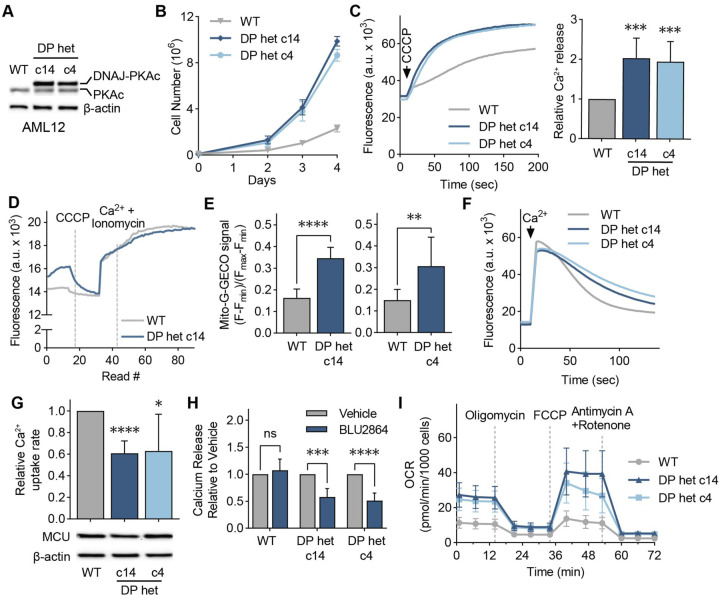
Figure 5. Cellular models of FLC show DP-dependent increase in mitochondrial Ca2+ levels.
(A) Immunoblot of lysates from WT and FLC clones c14 and c4 using an antibody against PKAc. (B) Proliferation curves of cellular models of FLC compared to WT AML12 cells; cells were counted on days 2, 3, and 4 after plating; n=3. (C) Representative traces and quantification of mitochondrial Ca2+ release assays in AML12 cells; cells were treated with the uncoupler CCCP, and the relative amount of Ca2+ released was quantified using a Ca2+ indicator dye; statistical significance was determined by one-sample t-test; n=10. (D) Representative trace of mitochondrial free Ca2+ levels of AML12 WT and c14 cells quantified using matrix-targeted Ca2+ reporter G-GECO (mito-G-GECO). (E) Baseline mito-G-GECO fluorescence normalized to minimum and maximum signals in AML12 WT and c14 or c4 cells; statistical significance was determined by Mann Whitney test; n >12 (F, G) Representative traces (F) and mitochondrial Ca2+ uptake rates in AML12 cells (G); mitochondrial Ca2+ uptake rates were calculated by monitoring Ca2+ clearance in the presence of a Ca2+ indicator dye; statistical significance was determined by one-sample t-test; n=9. Immunoblot of MCU shows comparable MCU expression in FLC clones compared to WT controls. (H) Mitochondrial Ca2+ release was assayed as in (C) after cells were treated with 5 μM PKA inhibitor BLU2864 or DMSO for 4 days. Ca2+ release was normalized to total protein levels; fold change in released Ca2+ is shown relative to DMSO control for each cell line; statistical significance was determined by paired t-test, n=7–9. (I) Seahorse extracellular flux analysis of oxygen consumption rates (OCR) in FLC clones compared to WT AML12 cells at baseline and after indicated treatments; n=10–16. All error bars indicate standard deviation; ns indicates non-significant, * indicates a p-value < 0.05, ** indicates a p-value < 0.01, *** indicates a p-value < 0.001, and **** indicates a p-value < 0.0001.

