
Figure 2: Spontaneous events exhibit widespread and distributed modular activity in diverse brain areas at P27–32.
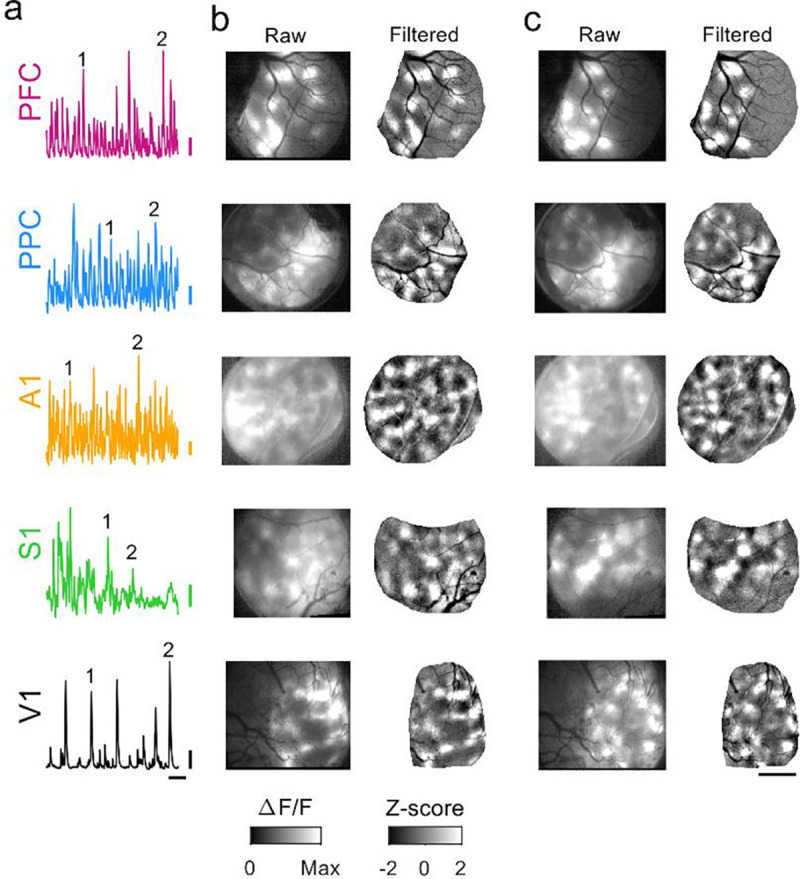
a. Example timecourse of spontaneous activity in different cortical areas. Numbers indicate events shown in b and c. b. Spontaneous events show modular patterns of activation in PFC, PPC, A1, S1, and V1 at P27–32. Left: raw event pattern showing clear modular patterns of activity in all areas at time (1) in (a). Right: Same event after applying a highpass spatial filter. c. Second representative event from same experiments as (b), at time (2) in (a). Scale bars (a): 0.1 ΔF/F, 20 sec; (b-c): 1 mm.