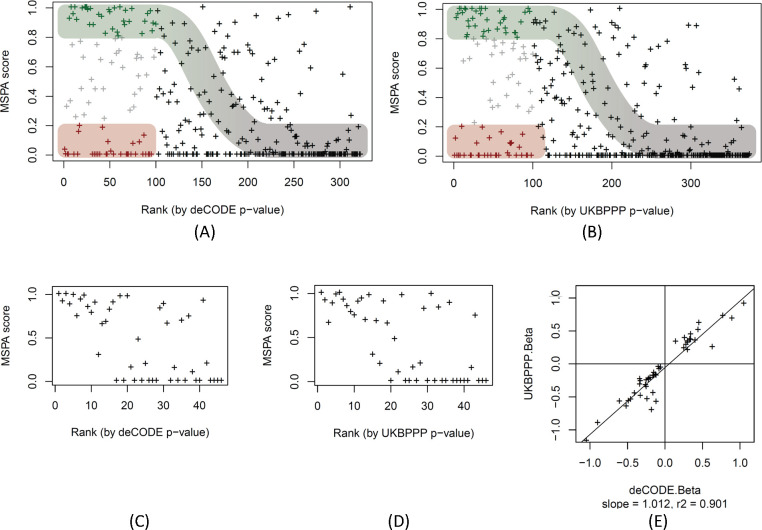
Figure 5: MS-peptide association score plotted by pQTL rank.
Scatterplot of the MSPA scores against the rank of the affinity proteomics pQTLs of the deCODE SOMAscan (panel A, data in Table S7) and the UKB-PPP OLINK (panel B, data in Table S8) studies, ranked starting with the lowest p-value. The first 100 pQTLs (out of 322 pQTLs for SOMAscan and 374 pQTLs for Olink) are coloured to indicate likely protein expression QTLs (MSPA score > 0.8; green) and likely epitope effect driven pQTLs (MSPA score < 0.2; red), the sigmoid curve indicates the assumed dependence of power to detect a pQTL as a function of the strength of the association, approximated by the rank of the pQTL in the respective study; MSPA scores limited to 46 pQTLs that were reported on the same variant in deCODE (panel C) and UKBPPP (panel D); scatterplot of the effect size (beta) of the 46 pQTLs reported deCODE and UKBPPP (panel E, data in Table S9).

