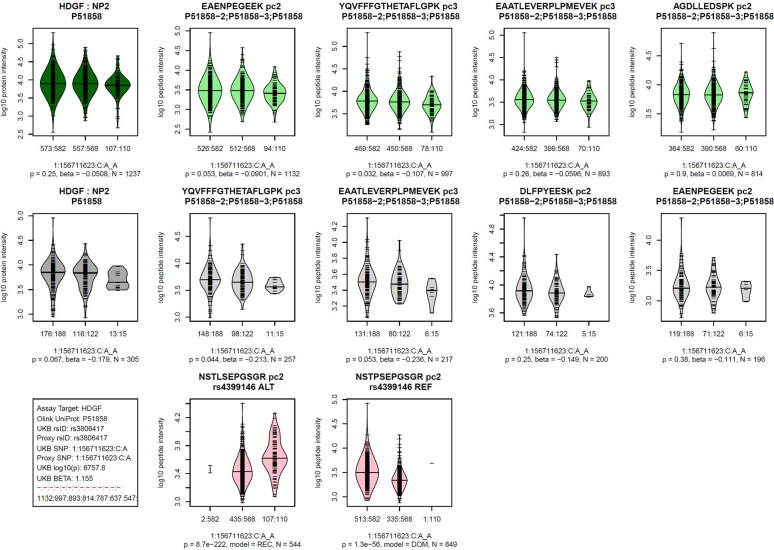
Figure 7: Example of a pQTL that is likely affected by an epitope effect.
See legend of Figure 3 for legend; similar plots for all 374 pQTLs with OLINK data and for all 322 pQTLs with SOMAscan data are provided as Figures S3 and S4; data is in Tables S6 and S7.

