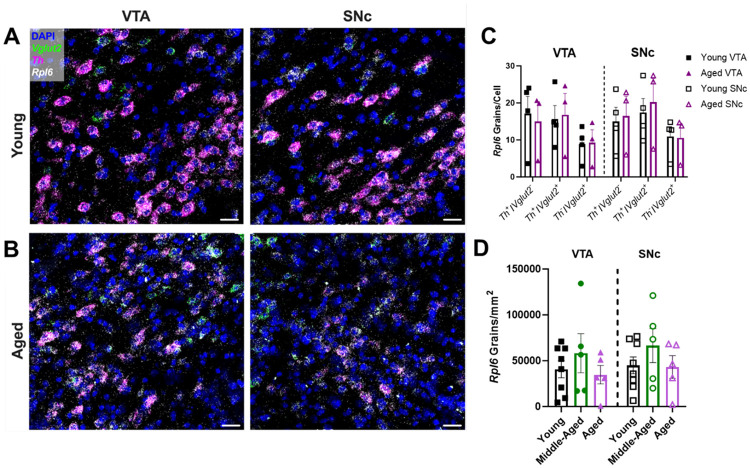
Figure 6. Rpl6 mRNA expression is preserved across aging in the mouse midbrain.
(A-B) Representative 60× multiplex RNAscope images of Th (in magenta), Vglut2 (in green), and Rpl6 (in white) mRNA expression alongside DAPI nuclear stain (in blue) in the VTA and SNc of young and aged wild-type mice. Scale bars=25μm (C) Cell type- and region-specific analysis of average Rpl6 mRNA grain numbers per cell. There were no significant expression differences in Th+/Vglut2−, Th+/Vglut2+, and Th−/Vglut2+ cell types in either the VTA or SNc of young versus aged mice (F1,30=0.30, P=0.59 for effect of age; F1,30=0.05, P=0.82 for effect of region; F2,30=3.558, P=0.04 for effect of cell type; F1,30=0.10, P=0.75 for effect of age×region; F2,30=0.12, P=0.89 for effect of age×cell type; F2,30=0.09, P=0.92 for effect of region×cell type; F2,30=0.07, P=0.94 for effect of age×region×cell type. (D) Quantification of Rpl6 mRNA density across both VTA and SNc showed no significant differences between the age groups (F2,30=1.6091, P=0.22 for effect of age; F1,30=0.4163, P=0.52 for effect of region; F2,30=0.018, P=0.98 for effect of interaction). Bars represent mean±SEM with points representing individual animals; N=3-8 per group.

