

Abstract
How renters respond to economic hardship, and how landlords respond when tenants fail to make rent, are understudied questions, owing largely to limited data. We use experiences from the COVID-19 pandemic to begin answering these questions. Drawing on both new census data and two original surveys of renters in Los Angeles County, we test nine hypotheses about the sources of renter distress and landlord reactions to it. We find that lost work and lost income are the primary drivers of missed or late payments. Most tenants who fell behind entered into repayment plans with their landlords. Eviction threats were uncommon but increased as the pandemic persisted. Landlords were more likely to threaten eviction as tenants fell further behind, and smaller landlords were more likely than larger ones to cut tenant services and threaten or initiate evictions. Our evidence suggests that government income support helped tenants pay rent and thus helped stave off eviction threats. We also find that tenants took on other forms of debt, such as credit cards, loans from family, etc., to make rent. These debt burdens generally will not be relieved by housing assistance, and so require other policy responses.
Keywords: Renters, eviction, COVID-19, income
Little academic research examines tenants’ decisions to pay or withhold rent. A sizable literature investigates when and why homeowners pay their mortgages, and the consequences when they do not, but equivalent studies for renters are largely absent. This omission is notable, because renters are, along almost every dimension, more vulnerable than homeowners. About 25% of homeowners own their housing free and clear, meaning they do not have a mortgage payment. Many of those with payments, moreover, have fixed-rate mortgages, and thus face decreasing real costs over time, even in cities where real rents are rising.
Homeowners, compared to renters, also have a higher ability to pay. The median household income for homeowners is almost double that of renters ($78,000 to $40,000; U.S. Census Bureau, 2018b), and where median liquid savings among homeowners is $3,700, among renters it is zero.1 Homeowners also have illiquid savings: they reside in a safety net that is the housing unit itself. If necessary, owners can rent out some rooms for extra money, or sell the home and use the proceeds to move. Renters have fewer such options. Finally, in many places, renters have fewer legal protections against removal. It is often easier for a landlord to evict a tenant than for a lender to foreclose on a homeowner.
A fast-growing body of research does study eviction, which is one outcome (and often the most severe outcome) of rent nonpayment. But not all eviction results from nonpayment, and the questions of when nonpayment leads to eviction, and what leads to nonpayment itself, have gone largely unstudied.2 So too has the question of how tenants balance a choice between two bad outcomes: incurring rental debt, or paying rent by incurring other forms of debt, such as putting rent on credit cards.
This article addresses these heretofore underexamined questions, using data from the COVID-19 emergency in Los Angeles, California. The COVID pandemic gives housing researchers both the means and the opportunity to learn more about nonpayment. The massive economic contraction that accompanied the public health response to COVID threw many tenants into economic distress, making it difficult for them to pay rent. The pandemic also generated a new data set—the U.S. Census Pulse Survey—that tracked rent payment and renter well-being in a way no prior data set had. The Pulse thus offers an unprecedented window into renter behavior, and we draw on it in this research.
The Pulse also, however, left some important questions unasked: about the size of the tenant’s debt, as well as the characteristics of landlords, and how landlords react to nonpayment. To complement the Pulse, in this article we also draw on two waves of an original survey of tenants in Los Angeles County, which cover these topics in more depth.
As we will discuss, neither the Pulse nor our survey is perfect, so we are cautious about making inferences. As we will also discuss, the COVID-19 pandemic was unique in two nontrivial ways, and readers should interpret our results with those circumstances in mind. First, during COVID-19 a large number of tenants suddenly had trouble paying. If the broader prevalence of nonpayment affects decisions made by both tenants and landlords, then results from the pandemic may not automatically generalize to instances when tenants’ inability to pay is less common. Second, during COVID-19 eviction was not an option for many landlords, including landlords in Los Angeles. Landlords could start an eviction process but could not legally remove tenants. These circumstances were unique.
A third limitation is that we only study Los Angeles. We do so for a reason: examining one area minimizes confounds that could arise from interregional variance in economic conditions, stay-at-home orders, and government assistance. But it also limits generalizability. We will show, however, that trends in renter distress in LA did not depart dramatically from those elsewhere.
These caveats aside, our results suggest the following: during COVID renters were, all else equal, more likely than owners to miss housing payments. They also missed rent at a rate substantially higher than the pre-COVID baseline. Lost work and lost income were the overwhelming drivers of these missed payments, and government programs that restored income (such as stimulus checks and unemployment insurance (UI)) appear to have had a protective effect. Although eviction threats were rare, reports of them increased as the pandemic went on, and landlords were more likely to threaten eviction as tenants fell further behind. Smaller landlords were more likely to threaten eviction than larger ones, even controlling for the fact that tenants in smaller units were more likely to miss a payment. Finally, many tenants, both those behind on rent and those who stayed current, took on other forms of debt to make rent, relying on credit cards, emergency loans, savings accounts, and friends and family.
Our article contributes, most obviously, to the growing body of work about the economic fall-out of, and policy response to, the COVID-19 pandemic. More broadly, our findings add some nuance and detail to conventional analyses of tenant troubles. We offer some of the literature’s first detailed analyses of nonpayment and its consequences. In particular, we provide some empirical estimates of how tenants may take on debt to stay current with their landlords. This debt is a worthy topic for future research. Concerns about housing precarity are often, and understandably, focused on eviction. But eviction is only the most acute and visible consequence of renter distress. Many renters in our sample stayed current on rent but borrowed to do so. Given their low incomes, escaping the debt that resulted may take many years.
Background: To Pay or Not to Pay
Most of the literature examining missed housing payments investigates mortgage delinquency and default—homeowners who encounter financial difficulty and elect to not pay (Buschbom et al., 2018; Corbae & Quintin, 2015; Mayer et al., 2014). This research emphasizes both the selective and the game-theoretic nature of nonpayment: selective because not all homeowners find themselves in situations where payment is difficult, and game-theoretic because when that situation arises, the mortgage payment becomes less a mutually beneficial exchange between borrower and lender, and more a strategic interaction. The borrower weighs nonpayment against its likely consequences, and banks in turn weigh the costs and benefits of their own actions in the event the borrower does not pay.3
Mortgages differ substantially from rental contracts, but a similar calculus could surround renters and landlords. Tenants unable to pay a coming month’s rent can react in several ways. They might seek help from friends or family members, put some or all of their rent on a credit card, or seek payday or emergency loans. They might pay rent late, and/or pay only a portion of their rent. In the extreme, they may choose to not pay rent at all or to move. The ultimate decision will depend on their ability to pay (the cash they have or can get), other expenses they face (food, medicine, and so on), their expectations of assistance (from the government, nonprofits, or family and friends), and, not least, the perceived consequences of not paying. Tenants who see their landlord as forgiving may be more likely to withhold payment, and spend their limited money instead on other priorities. Tenants who anticipate a harsh reaction from their landlords, in contrast, might devote at least some resources to rent, and do so by taking on other forms of debt or forgoing other expenses. Note that in this latter case, the tenant makes rent but does not escape financial distress; the distress manifests not in unpaid rent but in decreased spending elsewhere, or in higher debt levels from credit cards or other loans.
If tenant perceptions matter, then errors in those perceptions could be consequential. They may also be common. Tenants who rent from family or friends, or from small landlords with whom they regularly interact, might be more likely to withhold payment, believing their personal relationships will insulate them from reprisal or repercussion. But landlords must react when tenants miss a payment, and many of the factors they consider when deciding their reaction will be invisible to the tenant (just as many factors precipitating tenant nonpayment may be invisible to the landlord).
When tenants miss a payment, landlords need to consider their own expenses and reserves, along with the costs and benefits of trying to remove the tenants who haven’t paid. How building owners weigh these different factors will vary across landlords, and likely vary across types of landlord (e.g., corporate vs. mom-and-pop), but how they will vary is not obvious to the tenant and indeed not even obvious, a priori, to researchers. For example: are small landlords more likely to own their property free and clear, and thus (perhaps combined with personal knowledge of their tenants) less likely to evict when rent goes unpaid? Or are corporate landlords, because they have larger cash reserves that let them absorb losses (or more knowledge of and access to assistance programs), the ones who will show more forbearance? Little existing evidence can be brought to bear on these questions. The U.S. Census Bureau conducts a Rental Housing Finance Survey, but data on debt-to-equity ratios are missing for about 60% of its sample, making it hard to say that one class of landlord or another is better equipped to absorb unpaid rent.4 Unpaid rent, furthermore, is only one type of expense: landlords must also contend with property taxes, utilities, and maintenance, much of which lies outside the easy observation of tenants deciding whether to pay or researchers who study payment.
This opacity could create a mismatch between how tenants anticipate landlords will react and how landlords actually react. If tenants believe smaller landlords will be more forgiving, but smaller landlords are in fact more concerned about missed payments (because each rent payment represents a larger share of their income) then tenants may miss some rent and expose themselves to harassment or removal. Decker (2021), in a nationwide survey of small (one to four units) rental property owners, finds that although these owners are generally more affluent than average, many have precarious financial circumstances and their buildings are not particularly profitable. Precarity increased, moreover, with the onset of COVID-19.
Landlords with nonpaying tenants might threaten those tenants with eviction, but the threat might be designed more to make the tenant pay than to make the tenant leave. Garboden and Rosen (2019) show that eviction threats are much more common than actual evictions, and use interviews with landlords in three markets to help explain why. Threatening eviction is a fast and low-cost way to make tenants prioritize their rent bills over other spending priorities. Eviction itself, in contrast, is often viewed by landlords as a costly and (in some markets) time-consuming process that does not guarantee any back rent and does guarantee the need to find a new tenant. For this reason, eviction is often a last resort, used only when other attempts to obtain back rent have been exhausted. Smaller landlords reported using a more ad hoc approach to decisions about threatening, filing, or executing an eviction, whereas larger landlords often had a more structured process. All landlords, however, wanted to minimize the frequency of eviction proceedings and maximize rent payment (Garboden & Rosen, 2019).
When landlords do consider removing tenants—as opposed to just threatening them with removal—they need to weigh the likelihood of quickly filling the vacated unit. Here the broader context of nonpayment, real or perceived, matters. A situation where almost every tenant pays but a few do not differs from one where many tenants across a region fall behind. This does not mean that evictions will be more common when the economy is strong—to the contrary, evictions generally rise during downturns (Desmond & Gershenson, 2017; Lens et al., 2020)—but it does suggest that if a recession is deep enough to make rents soften and vacancy rise, landlords might judge it better to wait for late payment, or negotiate a repayment plan, than to evict a current tenant and risk not finding a new one. The landlord’s judgment here will depend in part on his or her perception of how many other landlords have tenants who are not paying, and of what those landlords will do.5 But it may also depend on circumstances specific to the building: if a nonpaying tenant occupies a rent-stabilized unit whose current price is well below market rate, the returns to eviction (through vacancy decontrol) may be high even if the eviction results in months of vacancy.
Finally, racial animus or stereotype could influence decisions to evict. If landlords dislike or distrust racial minorities, or assume that other potential tenants (or landlords) do, they may react differentially to nonpayment, and be more likely to remove racial minorities who fall behind.6
If a downturn is broad enough, as it was during the COVID-19 emergency, governments might try to influence this decision process, both by expanding assistance to economically distressed people (and thus helping them make rent) and by affirmatively constraining landlords’ ability to evict. Governments did both during COVID-19. The federal Coronavirus Aid, Relief, and Economic Security (CARES) Act, passed in April 2020, delivered assistance checks to over 170 million U.S. households, and also expanded UI. Multiple levels of government, through courts, agencies, and legislatures, also enacted rules to slow or stop evictions (Duong, 2020; Hutson, 2020).
None of these eviction moratoria canceled or forgave rent, and none, to our knowledge, stopped landlords from initiating evictions (e.g., notifying tenants and filing paperwork with a court). Most did, however, delay the date when those evictions could be heard and acted upon.7 Landlords governed by these moratoria who wish to lawfully evict tenants must file an eviction and wait, during which time they collect no rent and risk having the tenant damage the unit. These landlords might be better served working out repayment plans (or, as discussed above, by threatening tenants with eviction but not actually initiating it). Some may decide, however, to unlawfully evict tenants. They could threaten eviction or serve tenants with papers and hope the tenants are unaware of moratoria and move out, or turn off utilities or otherwise harass occupants. Some journalistic evidence suggests that harassment rose markedly when COVID stay-at-home orders began (e.g., Dillon, 2020), and Reina et al. (2021), in a survey of tenants who applied for rental assistance in LA City and County, found that 15% reported being harassed by their landlords.
An additional point is that the efficacy of both eviction moratoria and renter assistance hinge on awareness of them, and this awareness may vary by landlord type. If larger, corporate landlords are more aware of both moratoria and assistance programs (because they are well resourced and have personnel who track legal and legislative action), and more sensitive to scrutiny of their actions, they may be less likely to threaten or initiate eviction and more likely to direct tenants to help. Smaller landlords, in contrast, might be more likely to threaten or initiate eviction in part because they are unaware of regulations prohibiting it and unaware of programs offering an alternative path to being paid.
In total, this reasoning suggests that not all tenants will be equally likely to miss payment. It further suggests that if tenants who do miss payment are not randomly distributed across buildings—and probably they are not, because tenants with higher and more stable incomes may be in newer or more expensive buildings—then not all landlords will be equally likely to have tenants in arrears. Tenants who do experience economic shocks can take some combination of the following options: pay late, less, or not at all; borrow money from others or their future selves (their savings); negotiate with their landlords, or move—presumably to someplace where rent will be lower.
Based on these options and the discussions above, we construct nine hypotheses:
Renters, all else being equal, will be more likely than owners to struggle with housing payments.
The primary factor in renters’ difficulty to pay will be lost income through losses in employment or hours.
Even controlling for lost work and earnings, nonwhite renters and lower income renters are more likely to report being unable to pay, probably owing to unobserved wealth constraints, less affluent social networks, and racial discrimination in access to credit.
Government income support will be associated with less nonpayment.
Even controlling for income and job loss, renters will be more likely to be late or miss payment if their landlord is a friend or family member, or a “mom-and-pop” landlord, owing to the higher likelihood of personal relationships.
Renters who lose work or income will take on other forms of debt to help pay the rent: they will deplete their savings, put rent on credit cards, or borrow from lenders or friends and family.
Controlling for nonpayment, smaller landlords will be more likely to threaten or initiate eviction, owing to greater reliance on any single tenant’s rent payments and/or their lower level of awareness about moratoria.
Controlling for nonpayment, landlords will be more likely to threaten nonwhite renters with eviction.
Landlords will be more likely to threaten or initiate eviction as renters fall further behind (with threats being more common than actual initiation).
Data and Methods
Some of the hypotheses above are straightforward (e.g., lost income predicts nonpayment) and some more ambiguous (e.g., small landlords will be more likely to evict). To date, however, few have been testable, because the data to test them have been lacking. Although the Home Mortgage Disclosure Act (HMDA) mandates careful collection of lending terms, mortgage payment, delinquency, and foreclosure for owner-occupied dwellings (e.g., Loya, 2022), no comparable data exist to measure payment and nonpayment of rent, or the relationship between nonpayment and eviction. Specifically, no data source regularly and comprehensively tracks American rental payment. The National Multifamily Housing Council (NMHC) collects data that are regular (monthly), but not comprehensive—the council’s survey concentrates on higher-end and professionally managed properties. Nationwide, only about 13% of rental properties are professionally managed (U.S. Census Bureau, 2018a),8 and higher-end and professionally managed buildings probably differ systematically from the rest of the stock.
Those caveats aside, the NMHC suggests that rental nonpayment pre-COVID was rare—by the end of a typical month in 2019, for example, 96–97% of tenants had paid—and that during the first year of COVID (2020) these figures fell by about a percentage point, whereas in the second year they fell an additional percentage point (NMHC Tracker, 2022).
The U.S. Census Bureau’s American Housing Survey (AHS) is more comprehensive than the NMHC (using a representative sample of U.S. housing units) but less regular (administered only every two years). Since 2013, the AHS has asked tenants about rent payment and delinquency in the previous three months. Like the NMHC, the AHS suggests that before COVID, rental nonpayment was rare. Nationwide in both 2013 and 2017, just over 93% of tenants paying cash rent reported paying in full in the previous three months. Between 3% and 4% reported missing or only partially paying rent in one of those months, whereas 1.5% reported missing or partially paying rent in two or more months. The AHS also asks about eviction, but unfortunately does not, in its public use file, link responses to that question to responses about rent delinquency. As such, we cannot know if an eviction threat was made to a delinquent tenant, or—if it was—if delinquency was the only or primary reason for the eviction. Nevertheless, in 2017 about 2% of all tenants reported receiving an eviction threat, and 20% of those threatened (0.4% of all tenant households) reported receiving a court-ordered eviction notice (U.S. Census Bureau, 2014, 2018b).
Our focus in this article is on Los Angeles, and the AHS does include a representative sample of tenants in the Los Angeles–Long Beach–Anaheim Metropolitan Statistical Area (MSA)—this geography is essentially Los Angeles and Orange Counties. The 2017 AHS suggests that pre-COVID, rental delinquency in the Los Angeles MSA was even less common than it was nationwide. Nearly 97% of LA tenants paying cash rent reported paying their rent in full in the past three months, with 2.4% reporting one month of missed or partial rent payment, and less than 1% of tenants being behind by two months. Almost no LA tenants reported being behind on three months of rent (U.S. Census Bureau, 2018b).9 Similar to the national data, 2% of all MSA tenants reported being threatened with eviction. We can treat these figures as baseline (pre-COVID) levels of nonpayment and (with some reservations) of eviction threats. We now turn to the COVID-era data sources that let us carry out our tests.
The Census Pulse Survey
In late April 2020, the U.S. Census Bureau began administering its Household Pulse Survey (HPS, or Pulse). In its first wave (12 weeks) the census administered the Pulse weekly, and subsequently made it biweekly and revised some of its questions, as we describe below.10 Unlike other census products, the Pulse was created and deployed rapidly, fielded frequently, had small sample sizes and did not achieve the high response rates common to Census surveys. For all these reasons the Census Bureau considers the Pulse experimental.11 The survey was designed and weighted to provide representative information at the person level for the United States overall, for each state, and for the nation’s 15 largest MSAs. The latter fact allows us to examine trends in the Los Angeles MSA (again, covering Los Angeles and Orange Counties). We use data from the first two waves. In Wave 1 of the Pulse, we focus on the following housing question:
Did you pay your last month’s rent or mortgage on time? Select only one answer.
[Yes/No/Payment was deferred]
We combine responses to this question with questions about lost work (“In the last seven days, did you do any work for pay or profit?”), lost income (“Have you, or has anyone in your household, experienced a loss of employment income since March 13, 2020?”), and questions asking about UI receipt, CARES stimulus payments, and whether the household had relied in the past seven days on unconventional forms of spending to meet its usual needs (e.g., relying more on credit cards, loans, or savings, or borrowing from family members).
In combination, these questions let us test three of our hypotheses: that renters will have more trouble paying than owners, that lost work and income will be the major drivers of renters’ inability to pay, and that UI or other government assistance can help alleviate that difficulty.12
The Wave 1 Pulse has some limitations. The largest, for our purposes, is that the rental question only asks if payment is late. Because rent can be paid late but nevertheless paid in part or full, responses to this question do not automatically indicate whether a household is in arrears.13
The survey thus provides evidence of difficulty paying, but does not tell us whether at month’s end the rent was paid in full, in part, or not at all.14 The survey also offers no information on the consequences of nonpayment or the renter’s larger housing context (e.g., what sort of unit the tenant lives in, the level of rent, or who the tenant rents from). It does not indicate if tenants are behind on multiple months of rent, because it has no cumulative nonpayment question similar to that in the AHS survey (e.g., “Were you late this month and the month before?”).15 A further issue is that the employment question only reveals whether a respondent was unemployed during the week of the survey, and does not reveal how long the unemployment spell has been. The income question, similarly, tells us whether a household lost income after March 13, 2020, but not how much income, or over what length of time. As such, the lost income question is likely to become less salient over time; during the Pulse’s first wave, an affirmative response would indicate recent income loss. By the second wave, an affirmative response might refer to income that was lost months before.
Subsequent waves of the Pulse addressed some of these limitations. Beginning with Wave 2, the Pulse did not ask if the current month’s rent was late, but instead asked: “Is this household currently caught up on rent [mortgage] payments?” Thus, the nature of the trouble paying changes (from being late in the current month to being behind overall). The latter Pulse waves also asked what type of unit the tenant lives in.16
The Los Angeles County Renter Survey
We complement the Pulse with our second data source: an original survey of Los Angeles County renter households that we designed, and that a survey firm (LRW Research) administered twice, first in July 2020 and second in March 2021. Each wave had about 45 questions, and each received 1,000 responses. Wave 1 was completed 79% online and 21% by telephone (both land-line and cellular). Wave 2 was 73% online and 27% by telephone. We built the survey quotas to demographically and economically match 2019 census ACS data (one-year estimates) for LA County renter households, along dimensions of race, age, gender, and income. Unlike the Pulse and AHS, we do not include Orange County, but this geographic difference is not as large as it may seem. LA County holds over 80% of the MSA’s renters, and almost 88% of its tenants whose household incomes are below $25,000 per year (U.S. Census ACS, 2019).
Geographically, we sought to have 40% of our respondents in the City of Los Angeles and 60% in the remainder of the county, omitting zip codes that were predominantly large group quarters, such as the premises of colleges, universities, and military bases. The Wave 1 survey was available in English, Spanish, and Mandarin, and Wave 2 in English and Spanish (because no Wave 1 respondents used the Mandarin option). We fielded each wave on the 6th of the month, one day after rent is typically due. We sought to close each wave by month’s end. We were able to do so with Wave 2, but in Wave 1 reaching the target sample of 1,000 respondents necessitated holding the survey open for three days in August (40 respondents completed the survey in those three days).17
Both survey waves asked about the prior three months of rent payment. Wave 1, for instance, asked if respondents paid rent in full, in part, and (if payment was made) on time in May, June, and July 2020. Wave 2 asked about January, February, and March 2021.18 To avoid any confusion, we named the relevant month when asking each question. The May question, for example, asks:
In talking to people about the current situation, we are finding that many people are having trouble paying rent this month. What about you? In May, has your household (a) Paid rent in full (b) Paid part of the rent, (c) Not paid rent at all?
Both survey waves asked how respondents usually paid rent before COVID-19, and if during the pandemic they were relying on different and unconventional payment sources (e.g., credit cards, savings, friends or family). For renters who paid partly or not at all in a given month, we ask if landlords have negotiated with them, threatened an eviction, or begun an eviction. (During the time period of our surveys, Los Angeles was covered by an eviction moratorium. Respondents reporting evictions may thus be reporting that papers were filed in court, to be acted on when the moratorium expired, or that landlords had said an eviction was filed, whether it was or not.) We also ask if landlords have responded to nonpayment by turning off utilities or refusing to perform needed maintenance.
In Wave 2, but not Wave 1, we additionally ask if tenants have missed any payments since the pandemic began in March 2020, and ask tenants to estimate the total amount of money they owe. Because of this change, in Wave 2 we also ask all tenants, and not just those who report being behind in the three months we focus on, if their landlords have threatened or started an eviction. We round both surveys out with a series of questions about demographics, lost employment and earnings, and characteristics of rental buildings, such as building size, rent, and management structure (e.g., corporations or individuals).19
Appendix Tables A1 and A2 examine the representativeness of our samples by comparing our completed surveys with our target quotas and other Census proportions. Briefly, in Wave 1 we undersampled male renters—particularly older, more affluent males—and Asian households. We met our Wave 1 quota of lower-income households, but we note that 50 respondents (5%) did not answer our income question. If nonresponse to income questions increases as income falls (and these 50 respondents did report lower than average rents and education levels, and were more likely to be Hispanic), then our Wave 1 sample might be moderately biased toward households of lower socioeconomic status.20 In Wave 2 we missed our low-income quota, but 22 respondents did not report their income, and these respondents likewise reported lower levels of education and rent, and were less likely to be White.
Compared to census ACS data, our samples overrepresent renters in single-family homes. About 28% of respondents in both samples report being in single-family homes; the 2019 ACS places the same figure for Los Angeles County closer to 21%. The Pulse, notably, also oversamples these renters: 31% of Pulse Wave 2 renters in the Los Angeles MSA are in single-family homes, whereas the ACS reports the figure as 21% (the same as the county). This overrepresentation of single-family homes might explain why rents in our survey are slightly higher than those in the county. The median asking rent was $1,417 in our Wave 1 sample and $1,600 in Wave 2. In the 2019 ACS it was $1,176 (in 2020 dollars).
We can also compare our responses about paying late to the Pulse. In our Wave 1 sample, the share of renters who paid late in any given month is about 16%, and in Wave 2 it was 17%. In Wave 1 of the Pulse, the share of renters late on the current month’s rent averages 15% across 12 weeks. In Wave 2 (where the question was slightly different) it averaged about 13%. Again, the geographies here differ, because the Pulse also includes Orange County whereas our survey does not, but (again) most of the MSA’s renters are in Los Angeles County.
Overall, our samples appear to be reasonably representative of county renters, with some discrepancies suggesting a bias toward lower-income households, and some (such as the prevalence of single-family homes) suggesting the opposite. A final potential bias involves differential response: struggling households may be less likely to agree to participate in surveys.
Policy Context
The different waves of the surveys we examine were fielded at different times during the pandemic, and as mentioned above, the amount of protection and assistance available to renters varied across these times. For the entirety of the period we study, tenants could not be legally evicted from their units due to nonpayment: they were protected by overlapping moratoria from local, state and national agencies. In the early months of the pandemic, which are covered by the first waves of both the Pulse and the LA County Renter Survey, the federal government offered direct assistance in two primary ways: cash stimulus payments through the CARES Act, and enhanced UI. The first CARES checks were deposited in bank accounts in mid-April, and the Pulse began asking about stimulus receipt after that time—meaning that the first few weeks of the Pulse contained no question about stimulus receipt. Enhanced unemployment, similarly, began flowing the week of April 10 (Luhby, 2020), although the rollout was slow, particularly in California where an overwhelmed state system was snarled by delays (Wire & McGreevy, 2021; also, UI was not available to undocumented workers). Thus, UI receipt, like the stimulus, is largely absent from the first weeks of the Wave 1 Pulse but present in subsequent weeks.
Crucially, the first wave of federal UI enhancements ended on August 1, and a second, less-generous round of UI enhancement ($300 rather than $600) did not begin until the early months of 2021 (Laponsie, 2020; Pinho, 2020). The second wave of the Pulse, then, occurred while UI was not boosted. The second wave of the LA County Renter Survey captured the second wave of enhanced UI, but the enhancement was smaller and some workers had by that point begun to exhaust benefits (Bell et al., 2021). We thus expect the impact of UI to be strongest earlier in the pandemic, and weakest midway through our study period, when the program was least generous.21
A final policy note is that considerable uncertainty hung over the entire study period. It was often unclear—to both tenants and landlords—how long the eviction moratoria would last, and how rental debt would ultimately be disposed of. Advocates on different sides of these discussions called for moratoria to end sooner or be made permanent, for rental debt (or rent) to be canceled entirely, and for different forms and magnitudes of direct rental assistance (e.g., Martinez, 2020; Weill-Greenberg, 2020). Many tenants may not have been aware of the moratoria: in the Wave 2 Pulse, for example, LA tenants who owed rent were asked if they feared eviction in the next two weeks, and over 40% said yes. Some of these tenants may have feared illegal eviction, or just feared an eviction threat, but the high proportion also suggests that many renters may have been unaware of the protections available. Appendix Figure A1 displays the overlapping timelines of our surveys, the Pulse survey, various eviction moratoria, and state and federal income supports.
Empirical Approach
Our surveys allow us, first, to descriptively estimate the prevalence of nonpayment at different points in the COVID-19 pandemic. From there we estimate a series of regressions. The dependent and independent variables differ based on the survey employed and the question addressed, but the basic model takes the following form:
where the dependent variable, Renter Distress, is a binary indicator of some form of housing trouble (we use “distress” as a broad term that can variously indicate being late on rent, behind on rent, drawing on savings or going into debt to pay rent, etc). The independent variables of interest are—again with differing emphasis depending on the model—whether the respondent lost income or lost work, the type of landlord, and whether the respondent received UI (or enhanced UI, if applicable). γt is a vector of respondent characteristics, including income, education, race and ethnicity, age, household size, and whether they reported contracting COVID-19. For Wave 1 of the Pulse, we estimate random effects panel logits, to account for the survey being a weakly balanced panel. The census administered the survey every week, usually asking different people the same questions each time, but sometimes (in about one third of cases) returning to previous respondents and surveying them again. We control for the week administered, as well as the influence of repeat respondents, by treating each respondent as a random effect, but attaching a fixed effect to each week. Subsequent Pulse waves were not panels. We present all output as odds ratios.
Results
In what follows we first present descriptive statistics from both the Pulse and the LA County Renter Survey. We then present regression results from the Pulse, which test our first four hypotheses, followed by regression results from the LA County Renter Survey, which let us test all nine of our hypotheses.
Descriptive Statistics
Our descriptive analysis begins by situating Los Angeles in the broader context of housing insecurity during the COVID-19 pandemic. Figure 1 uses Pulse data from August 2020 to January 2022 (weeks 13–42 of the survey) and compares housing insecurity trends in Los Angeles to trends in three other large MSAs (those with the highest, lowest, and median levels of distress) and the nation as a whole. In the figure, housing insecurity is defined as the share of households that are behind on rent or mortgage payments and have low confidence in their ability to make the next month’s payment.22 Although Los Angeles exhibited higher-than-average levels of such insecurity, it was not the MSA with the highest levels—Houston, Miami, New York, and Atlanta all exceeded it—and LA was not much higher than the overall U.S. average.
Figure 1.
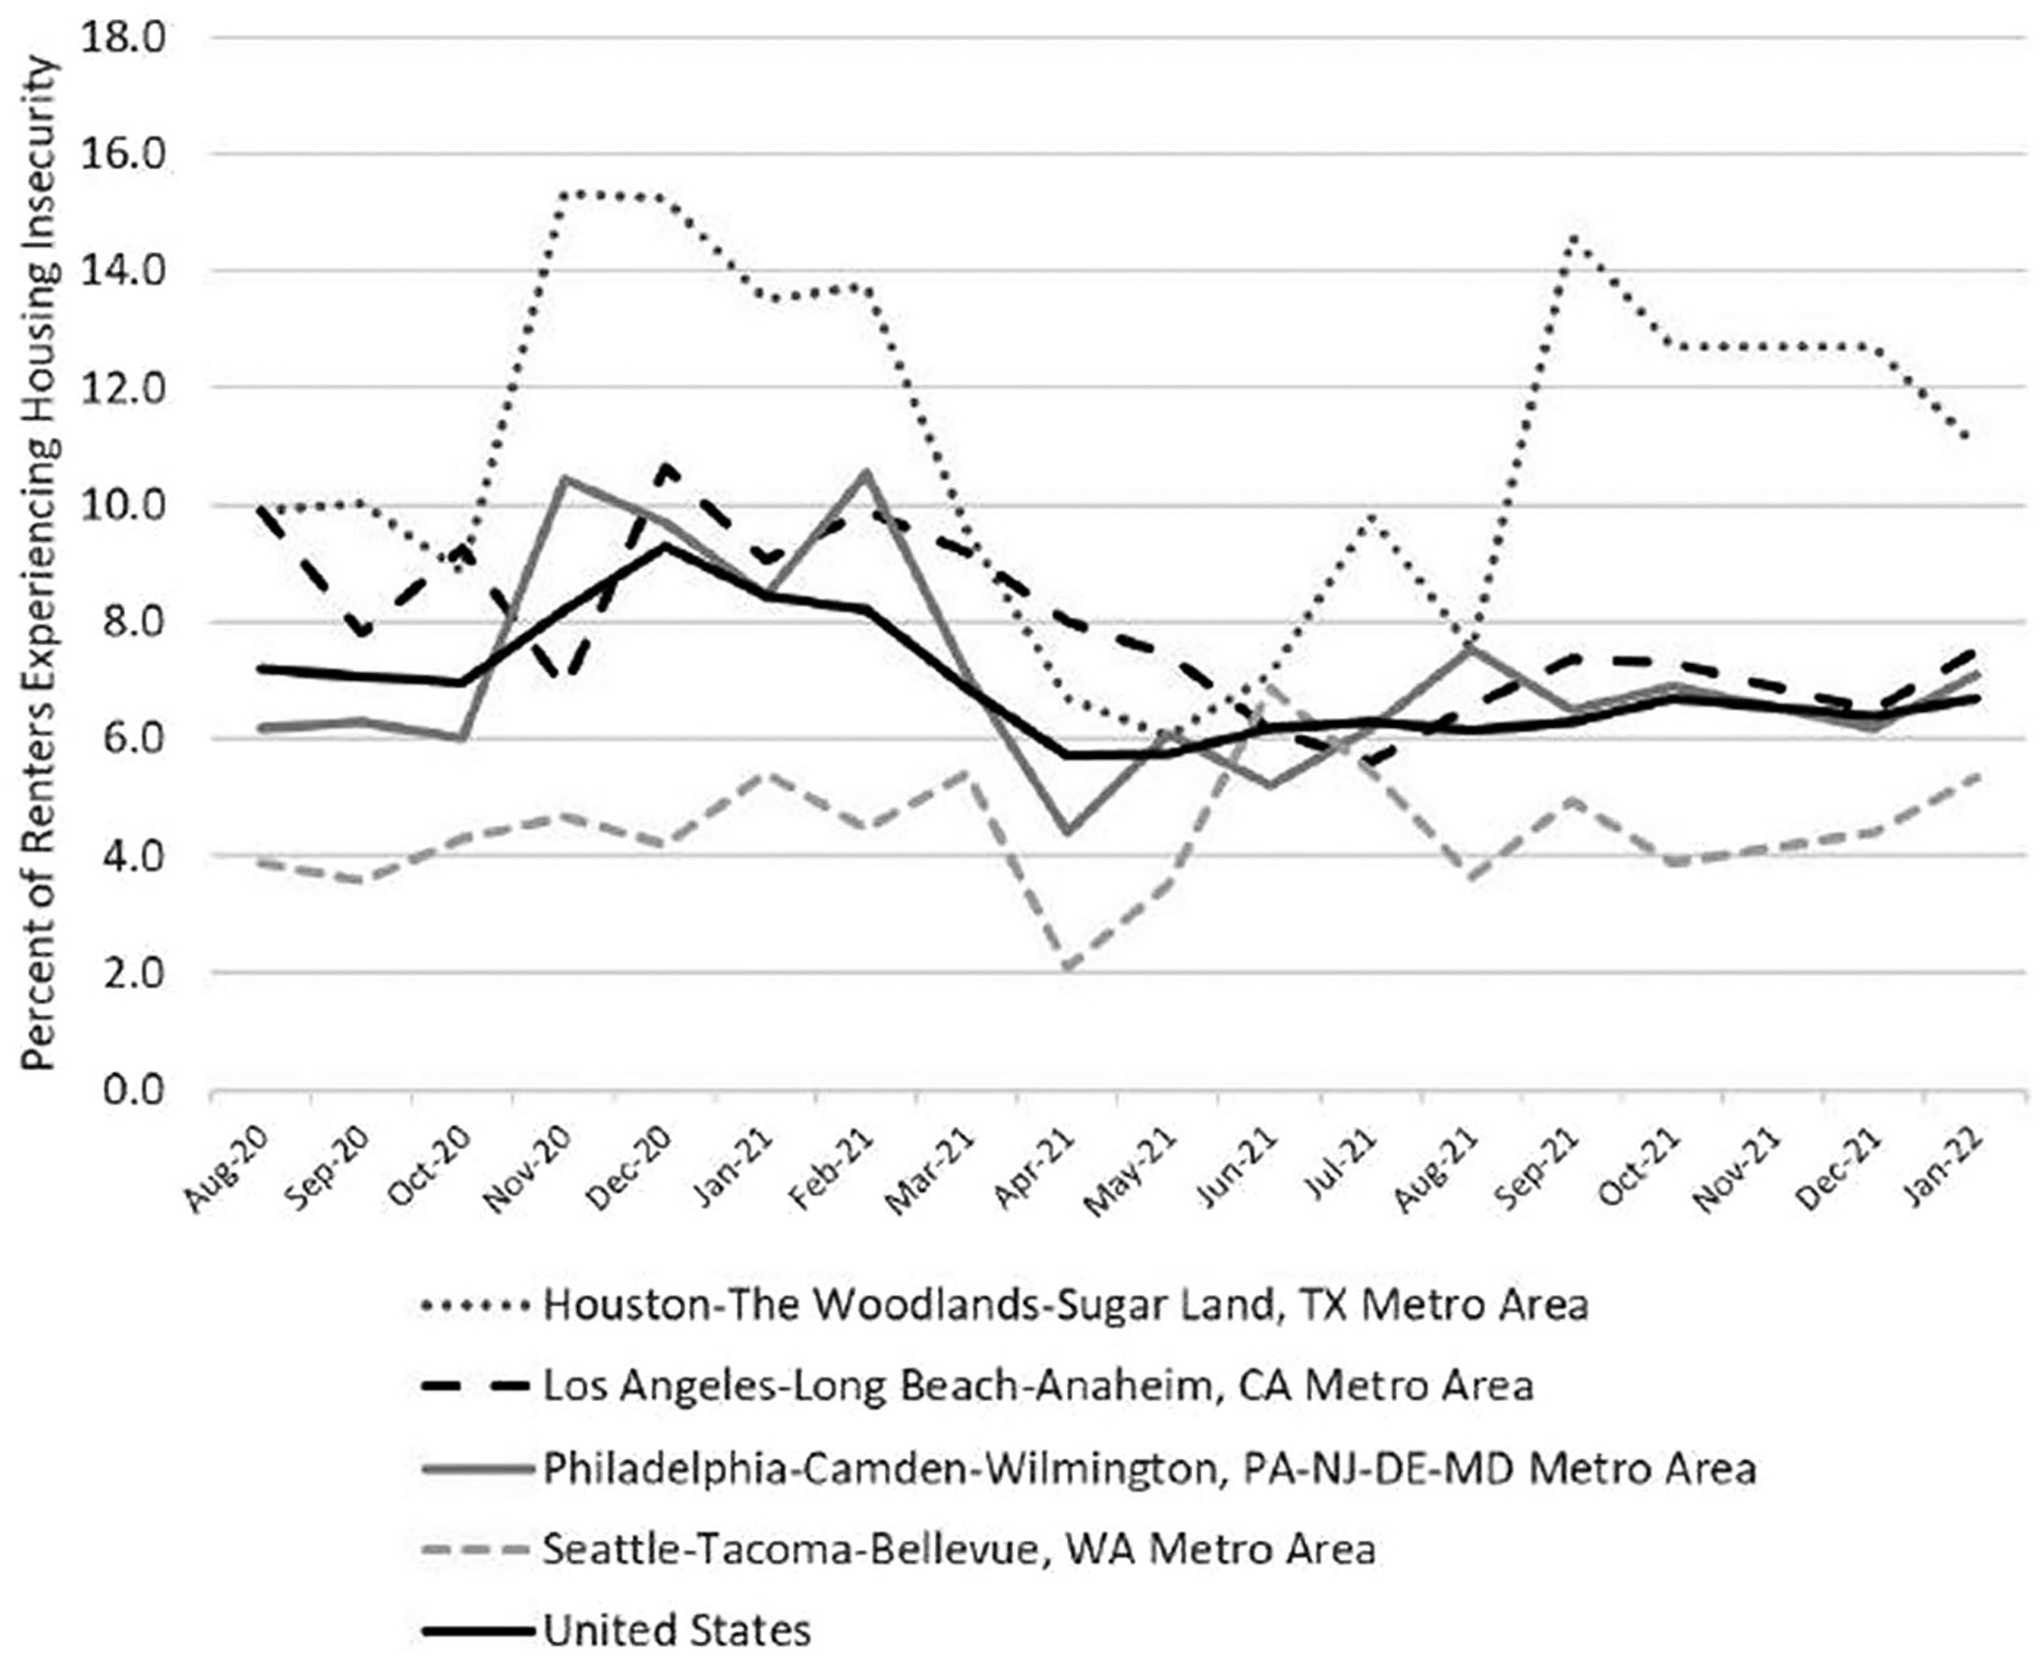
Housing insecurity across metropolitan areas, August 2020–January 2022.
Source: U.S. Census Household Pulse Survey.
We now turn to lost work or income, and the nonpayment of rent. Table 1 shows, using data from our four surveys (Pulse Waves 1 and 2, and County Renter Survey Waves 1 and 2) that all these phenomena became more prevalent during the COVID-19 pandemic. Both waves of the Pulse show almost 40% of renter households reporting being involuntarily unemployed during the survey week. Reports of having lost income or work sometime during COVID are even more prevalent, at over 50% of all four samples. These results suggest large increases in unemployment: by way of comparison, the 2019 ACS showed an overall unemployment rate in Los Angeles MSA of about 3%.
Table 1.
Descriptive statistics on renter distress by data source.
| Variable | Pulse Wave 1 | Pulse Wave 2 | LA County Wave 1 | LA County Wave 2 |
|---|---|---|---|---|
| Unemployed | 40 | 38 | N/A | N/A |
| Lost job or income | 68 | 59 | 62 | 53 |
| Had COVID | a | 13 | 11 | 27 |
| Late on rent | 10 | 13 | 22 | 29 |
Note. Values in columns are percentages.
There was a low prevalence of COVID-19 in Pulse Wave 1, largely due to lack of testing. “Unemployed” in Pulse refers to being involuntarily unemployed during the week of the survey. “Lost job or income” means the household lost work or hours at some point during the pandemic. “Late on rent” in Pulse Wave 1 means the current month’s rent is late. In Pulse Wave 2 it refers to being behind on rent generally. In Waves 1 and 2 of the LA County Renter Survey it means respondents paid late at least once in the three previous months.
All four surveys also suggest that rent nonpayment rose dramatically during COVID-19. Recall that our baseline estimates of nonpayment in Los Angeles, from the 2017 AHS, suggested that only 3% of LA MSA tenants were not fully current on the previous three months of rent. Table 2 shows that across Wave 1 of the Pulse, the average share late on the current month’s rent was 10%, whereas in Wave 2 the share behind on rent was 13%.
Table 2.
Descriptive statistics on rent payment, borrowing, and landlord–tenant interactions. LA County Renter Survey.
| Variable | Survey Wave 1 (2020) | Survey Wave 2 (2021) |
|---|---|---|
| Did not pay rent at all in one of the three past months | 7 | 7 |
| Paid partial rent in one of the three past months | 16 | 31 |
| Paid rent late in one of the three past months | 21 | 29 |
| To pay rent, did the household use: | ||
| Credit card? | 12 | 26 |
| Pre-COVID baseline | 3 | 6 |
| Emergency or payday loan? | 13 | 21 |
| Savings? | 30 | 39 |
| Money borrowed from friends and family? | 21 | 29 |
| Did the households unable to pay rent on time or in full: | ||
| Discuss a repayment plan?a | 68 | 70 |
| Enter into a repayment plan?b | 75 | 79 |
| Experience reduction in services?a | 20 | 28 |
| Experience an eviction threat?a | 16 | 25 |
| Have an eviction initiated?a | 6 | 19 |
Note. “Reduction in services” means the landlord did not perform needed maintenance and/or shut off utilities.
Only asked of renters who paid late, partially or not at all in the previous three months.
Only asked of renters who had discussed a repayment plan.
The LA County Renter Survey tells a similar story. That survey asked more specific questions about when and whether households were able to pay rent, and did so in a manner more directly comparable to the prepandemic questions in the AHS. In Wave 1 of the County Renter Survey, 22% of households were unable to pay on time in one of the previous three months. In Wave 2 this figure was 29%.23
Table 2 breaks some of these numbers down further. The AHS showed that in 2017 only 1% of tenants in the LA MSA were two full months behind on rent, and that well under 1% were three months behind. Both waves of the LA County Renter survey suggest that during the pandemic these proportions spiked. Of the 22% of renters unable to pay on time in at least one month in Wave 1, about a quarter were able to pay in full by that month’s end, meaning about 17% of renters were unable to fully pay rent in at least one month. About 7% of renters were unable to pay at all in at least one month (although not shown in the table, 2% of renters had not paid any rent in any of the three months). In January, February, and March 2021, the share of tenants missing an entire month’s payment was still at 7%, but levels of partial and late payment had jumped to 31% and 29% of tenant households. By any measure we have compiled, then, nonpayment surged well above its prepandemic trend, and appeared to worsen as the pandemic went on.
Failure to pay rent on time and in full is the most direct indicator of renter distress. Table 2 also highlights a second indicator, however, which is tenants paying rent with funds other than earned income, by dipping into savings or borrowing.24 Both waves of the LA County Renter survey asked households how they paid their rent, both before and during COVID. In both waves of the survey, few tenants reported using a credit card prior to the shelter-in-place orders (3% in Wave 1, 6% in Wave 2). As COVID progressed, these proportions jumped. Overall, 12% of tenants in Wave 1 reported putting at least some rent on a credit card during the three months we asked about; in Wave 2 this figure was 26%. These figures suggest at least a fourfold increase in the use of credit cards to pay rent.25
Although not shown in the table, the use of credit cards was 3 times higher among tenants who reported paying late or not paying in full, and grew most rapidly among lower-income tenants. In Wave 1, for example, only 1.5% of the lowest income renters reported pre-COVID credit card payments, but by May of 2020 this proportion had more than quadrupled, to almost 7%.
Credit cards were the only form of borrowing for which we established a pre-COVID baseline, but not the only form of borrowing tenants resorted to during the pandemic. Table 2 also shows that tenant households turned to friends and family, dipped into their savings, and took out payday or emergency loans. Although again not shown in the table, the use of all these methods was more common amongst households late or behind in at least one month.26
At the same time, however, households current on rent were not immune to relying on unconventional sources of funds for rent. Over 10% of households current on rent reported needing help from friends or family in at least one month, and over 20% used their savings to pay. Smaller but still notable proportions relied on credit cards and emergency loans.
The final rows of Table 2 examine landlord responses to late or missed payments. Most tenants unable to pay rent, in part or in full, discuss or enter into repayment plans with their landlords. In Wave 1, about half of households who missed at least one full month of rent report discussing a repayment plan with their landlord, and about two thirds of households that discuss a plan enter into one. Repayment plans became only slightly more common in Wave 2.
Much smaller shares of tenants who had trouble paying report conflict with their landlords, but conflicts became more common in the survey’s second wave. In Wave 1, about 20% of tenants who had difficulty paying reported their landlord had ceased repairs or turned off utilities, and nearly 30% reported this in the second wave. Similarly, in Wave 1, 15% of tenants behind on rent reported being threatened with eviction, and about 6% reported an eviction being initiated against them. These numbers jumped to 25% and 19%, respectively, less than a year later.
Figure 2 breaks down these landlord reactions by landlord type, and shows what appear to be significant differences. In short, almost all landlord reactions to late payment or nonpayment are more common among smaller landlords. Perhaps unsurprisingly, repayment plans are more common when the landlord is a family member or friend of the tenant (77%) than when the landlord is an individual or “mom-and-pop” landlord (68%) or a rental/management company landlord (68%). Controlling for nonpayment, plans are discussed more often with Black (76%) or Hispanic (75%) tenants than for White (64%) or Asian (43%) tenants (these proportions are not shown in the figure).
Figure 2.
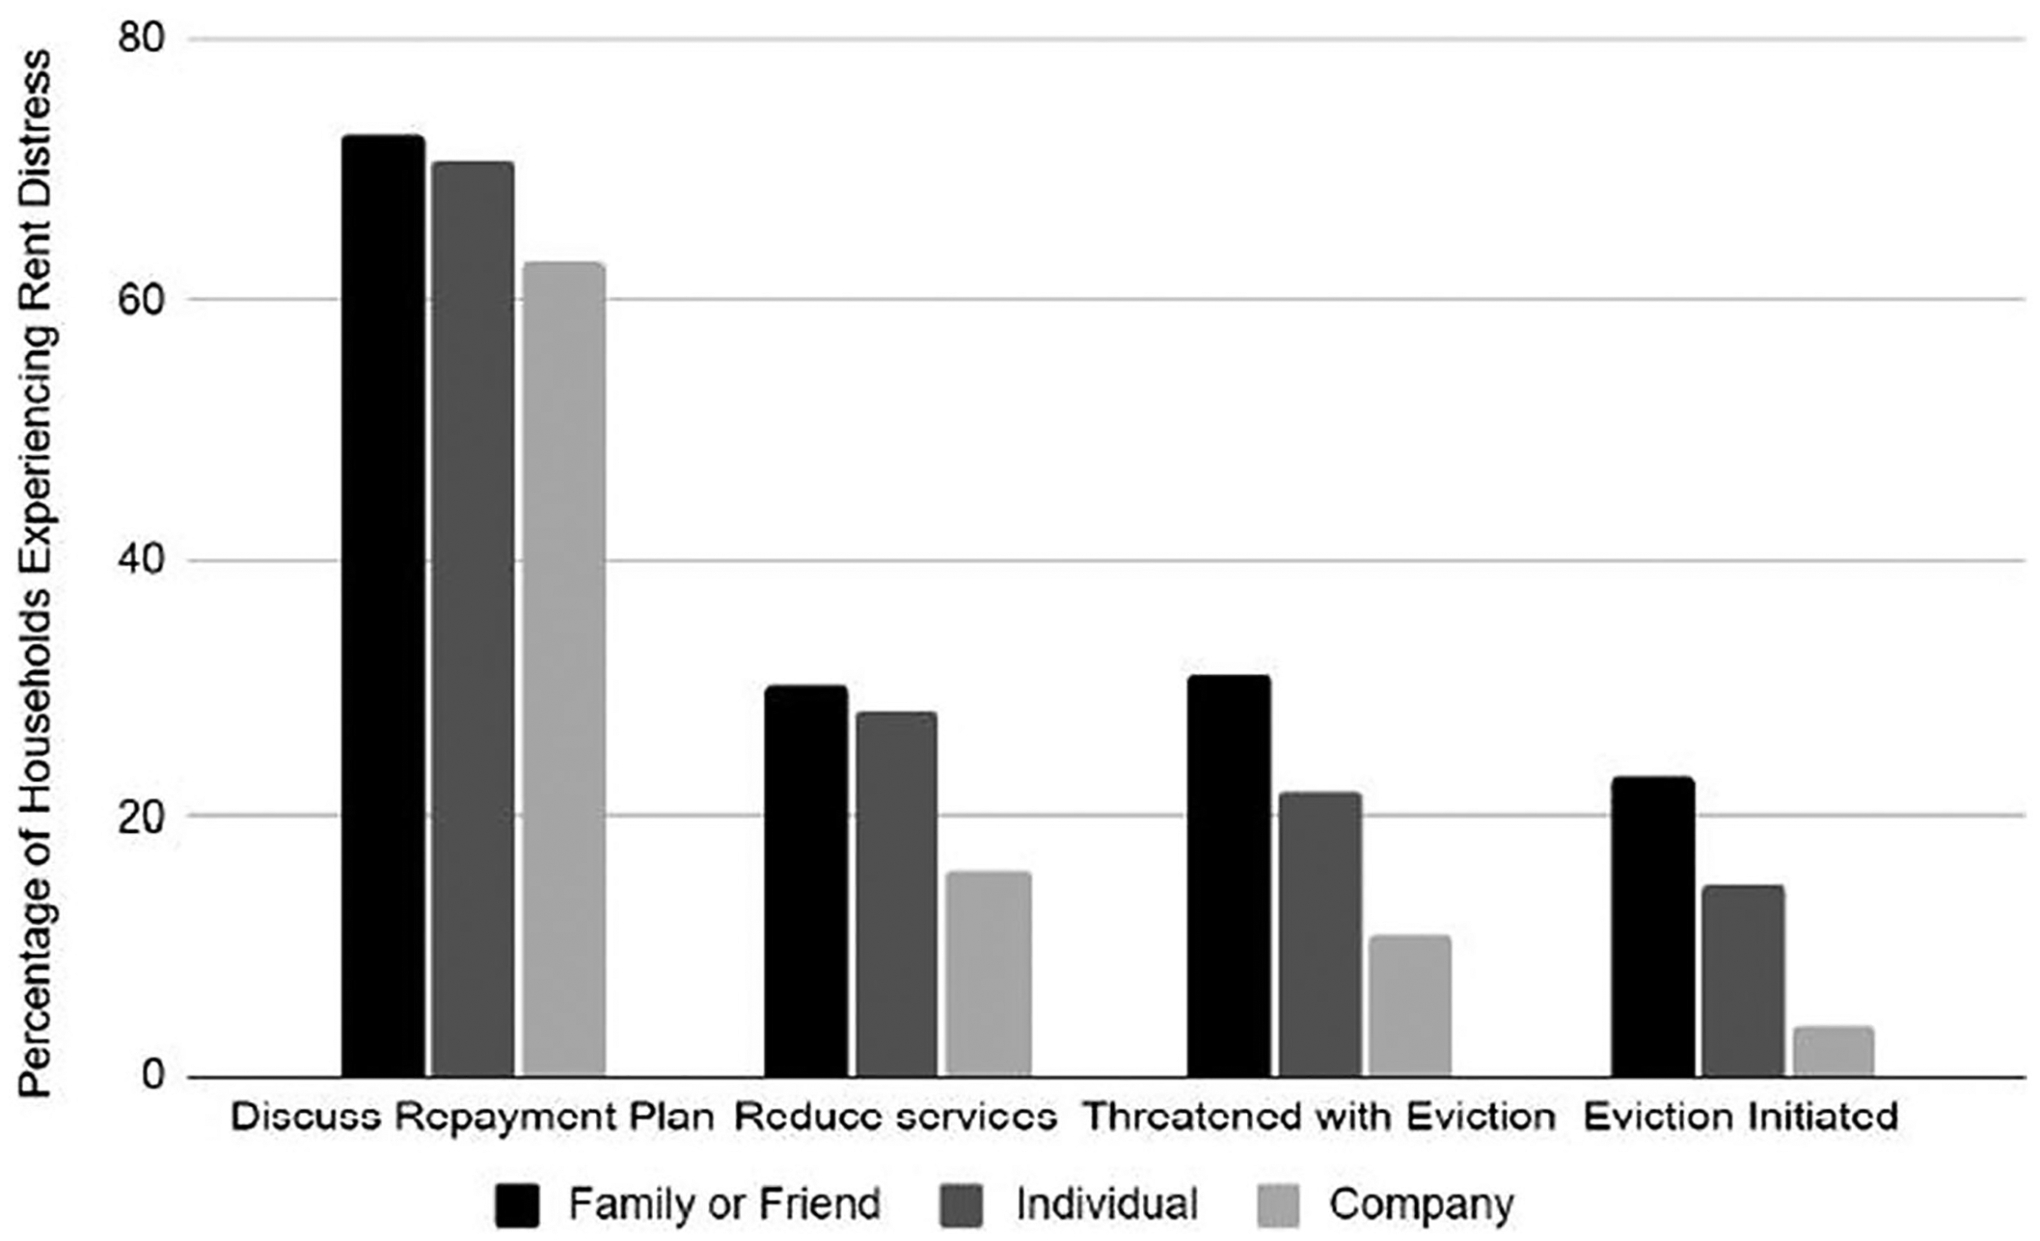
Landlord actions by type of landlord.
Note. “Rent Distress”: Late payment, partial payment, or entirely missed one rent payment in the previous three months. “Reduce services”: Landlord did not make needed repairs, or turned off utilities. Source. Waves 1 and 2 (combined) of LA County Renter Survey.
Figure 2 also shows that nonpayment is most strongly associated with threatened or actually initiated evictions if the tenant rents from family members or friends, or from individual landlords. Between 22% and 31% of nonpaying tenants in these landlord arrangements report being threatened with eviction, compared to only 11% of nonpaying tenants who rent from rental or management companies. Similarly, rates of reported evictions being initiated are between 15% and 20% for smaller landlords, and 4% for larger rental firms.
In Wave 1 of the LA County Renter Survey, 61% of households that lost work reported receiving unemployment benefits; the proportion in Wave 2 was 64% (Figure 3). In the first wave, households receiving benefits were more likely to pay rent in full and on time. Only 27% of households that lost work but received assistance paid late, compared to 38% who lost work but didn’t receive assistance. Similarly, 22% of households that lost work but received assistance paid partial rent, and 7% didn’t pay at all. In contrast, 30% of households that lost work but did not receive assistance paid partial rent, and 14%—double the share of households drawing benefits—didn’t pay at all.
Figure 3.
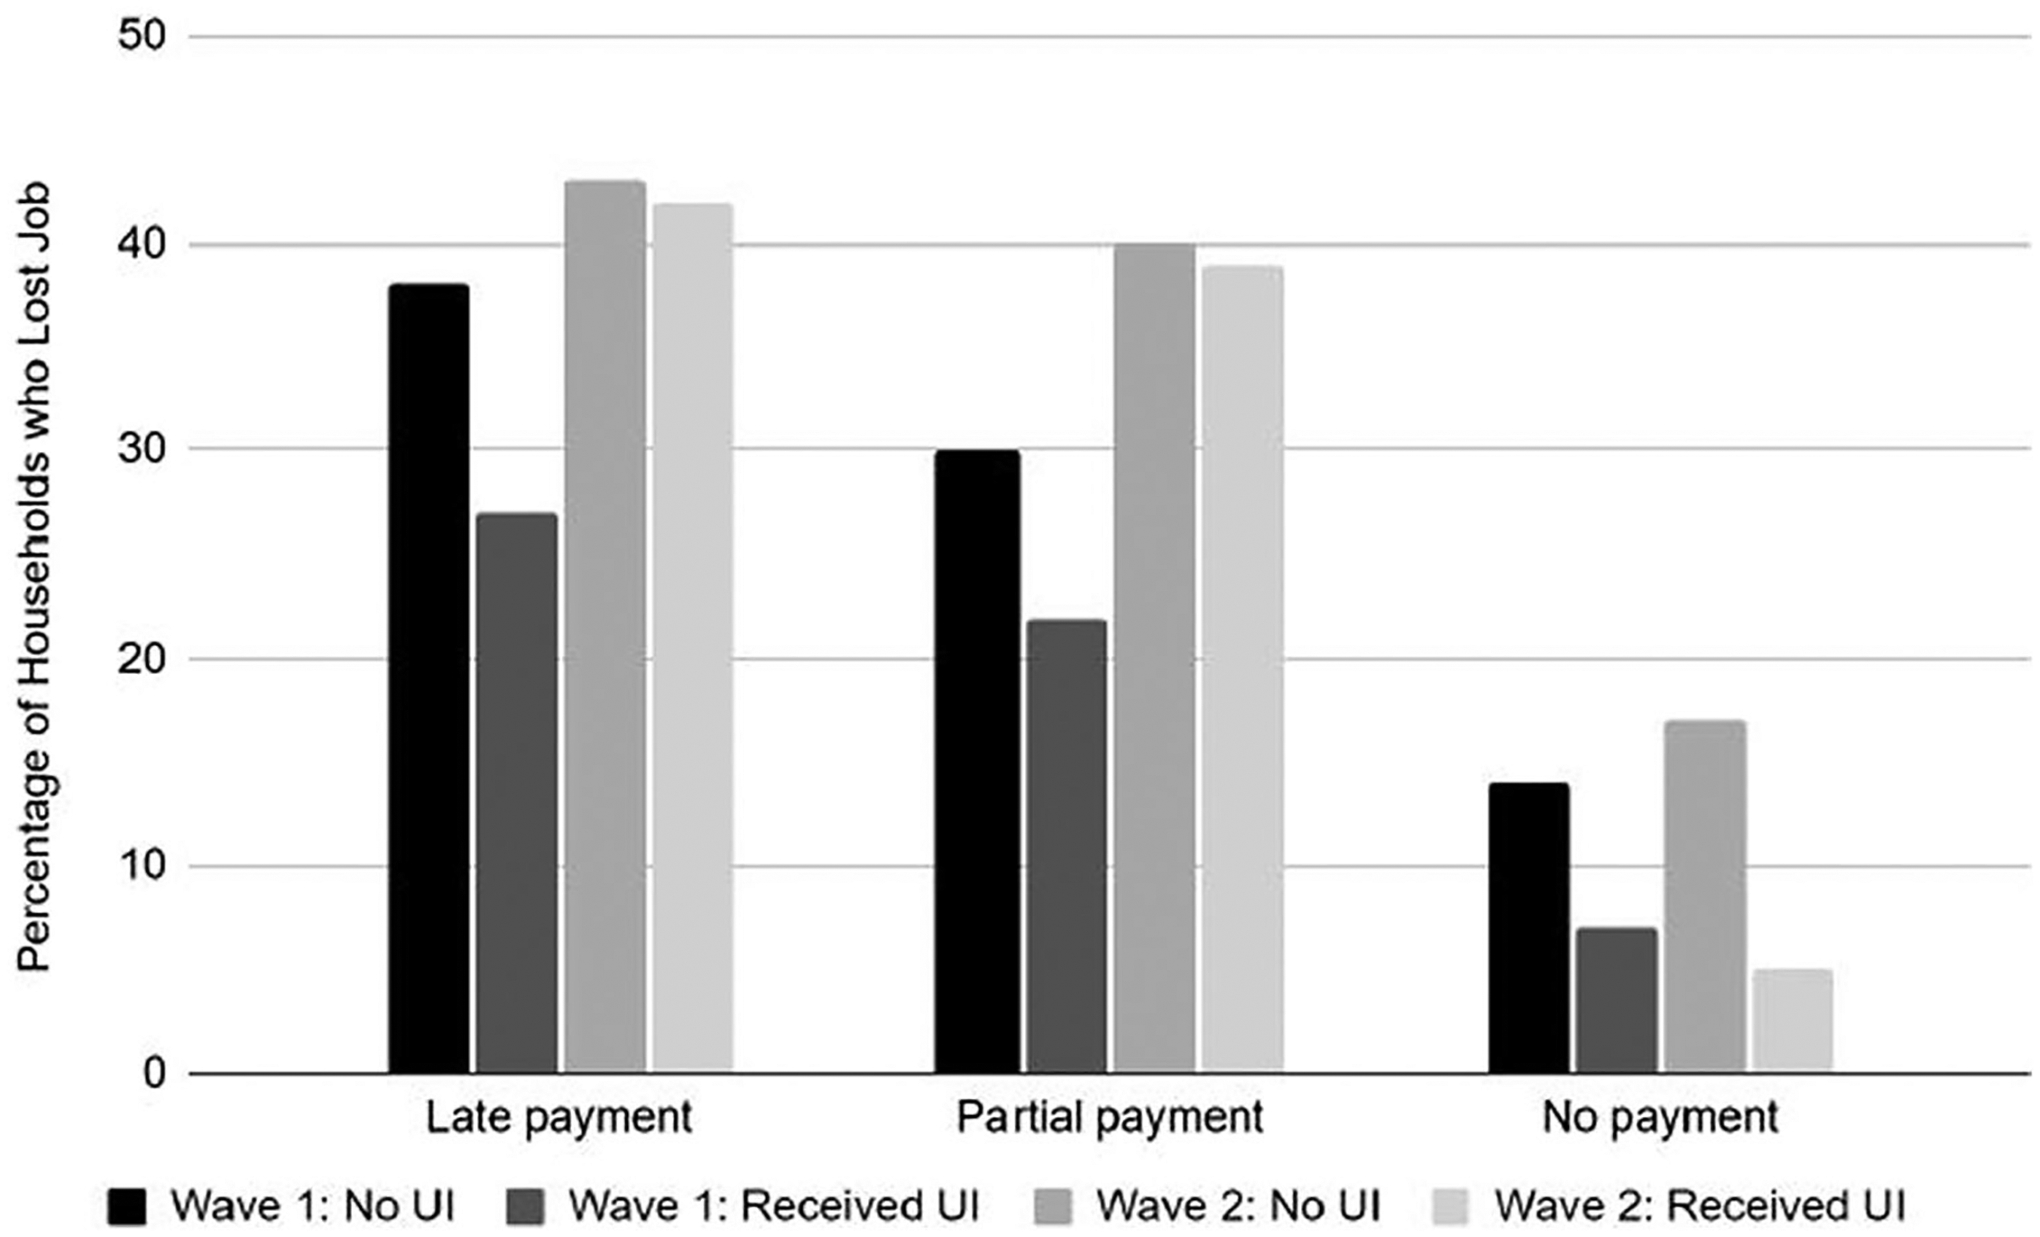
Renter distress and unemployment insurance (UI).
Source. Waves 1 and 2 of the LA County Renter Survey.
Figure 3 also shows, however, that the relationship between unemployment and renter distress changed notably between survey waves. In Wave 2, those who received UI had an almost identical rate of late or partial payment of rent compared to those who did not. However, they continued to default completely on rent at a much lower rate. In fact, in the second wave of the survey those who did not receive UI were more than 3 times as likely to not pay rent at all.
Finally, we might expect that nonpayment would be more common when tenants have closer personal relationships to their landlords. Our data bear this expectation out. Late payment and nonpayment are both more common among tenants who rent from friends and family. Such tenants comprised about 12% of our sample, but 25% of renters who missed at least part of their rent in one month. Conversely, tenants renting from management companies accounted for over 40% of our sample but less than 35% of households with late or missed payments. Tenants who rent from friends and family are, we should note, also lower-income than other tenants: almost 60% have household incomes below $50,000; for other tenants this figure is just under 50%.
Regression Results: Pulse Data
Tables 3 and 4 report regression results from the first two waves of the Pulse. The regressions are logits, with the results reported as odds ratios. Each table’s first model shows that renters, even controlling for lost income and a wide array of other factors, are more likely than owners to be delinquent on their housing payment (supporting our first hypothesis). Table 3 shows renters are 40% more likely than owners to be late on the current month’s housing payment, and Table 4 shows that they are 19% more likely to be so. Note that these figures likely underestimate the true gap between owners and renters, because both models omit the roughly 30% of homeowners who own their homes free and clear.
Table 3.
Associations with late housing payments, U.S. Census Pulse Wave 1.
| 1 | 2 | 3 | 4 | |
|---|---|---|---|---|
| Variables | Late payment (all HHs) | Late rent (renter HHs) | Late rent (lost work/income) | Late rent (lost work/income) |
| Renter | 1.406*** (0.001) |
|||
| Lost employment income | 3.508*** (0.004) |
4.154*** (0.006) |
||
| Currently unemployed | 1.346*** (0.001) |
1.486*** (0.001) |
||
| Unconventional spending | 3.666*** (0.008) |
3.682*** (0.008) |
||
| UI income | 0.255*** (0.000) |
0.268*** (0.001) |
||
| Stimulus aid | 0.810*** (0.001) |
|||
| Second income quartile | 1.170*** (0.001) |
1.097*** (0.001) |
1.106*** (0.001) |
1.202*** (0.002) |
| Third income quartile | 0.644*** (0.001) |
0.676*** (0.001) |
0.707*** (0.001) |
0.850*** (0.002) |
| Top income quartile | 0.285*** (0.000) |
0.266*** (0.001) |
0.252*** (0.001) |
0.115*** (0.001) |
| Female | 0.984*** (0.001) |
0.969*** (0.001) |
0.974*** (0.001) |
1.624*** (0.002) |
| Age 18–30 | 1.038*** (0.001) |
1.220*** (0.001) |
1.316*** (0.001) |
0.854*** (0.001) |
| Age 65 or older | 0.378*** (0.001) |
0.282*** (0.001) |
0.305*** (0.001) |
0.164*** (0.001) |
| Persons in household | 1.020*** (0.000) |
1.022*** (0.000) |
1.031*** (0.000) |
1.047*** (0.000) |
| Children in household | 1.056*** (0.000) |
1.071*** (0.000) |
1.052*** (0.001) |
1.012*** (0.001) |
| Black | 2.193*** (0.003) |
2.633*** (0.004) |
2.398*** (0.004) |
1.457*** (0.004) |
| Asian | 0.758*** (0.001) |
0.733*** (0.001) |
0.538*** (0.001) |
0.916*** (0.003) |
| Hispanic | 1.165*** (0.001) |
1.457*** (0.002) |
1.248*** (0.002) |
1.328*** (0.003) |
| No HS diploma | 1.007*** (0.001) |
1.049*** (0.001) |
0.968*** (0.001) |
0.859*** (0.001) |
| BA or higher | 0.499*** (0.001) |
0.432*** (0.001) |
0.394*** (0.001) |
0.543*** (0.001) |
| N | 17,197 | 8,994 | 5,717 | 3,092 |
| F | −2.89E + 07 | −1.96E + 07 | −1.73E + 07 | −8.03E + 06 |
Note. Data are from U.S. Census Pulse weeks 1–12 (models 1–2) and 8–12 (3–5). Coefficients are odds ratios. Regressions are random-effects logit models, with week fixed effects. Person-weighted. Rerunning regressions with replicate weights does not change the results. Model 1 includes all HHs except owners who have no mortgage. Model 2 includes all renter HHs; Models 3 and 4 include renter HHs who have lost work or income. “Unconventional Spending” means the respondent is relying on credit cards, loans, family, or savings to cover normal expenses. Standard errors in parentheses.
p < .05.
p < .01.
p < .001.
Table 4.
Associations with late housing payments, U.S. Census Pulse Wave 2.
| 1 | 2 | 3 | 4 | |
|---|---|---|---|---|
| Variables | In arrears (all HHs) | Owe rent (renter HHs) | Owe rent (renter HHs) | Owe rent (lost work/income) |
| Renter | 1.185*** (0.068) |
|||
| Lost employment income | 2.924*** (0.185) |
2.869*** (0.256) |
2.449*** (0.245) |
|
| Currently unemployed | 1.660*** (0.093) |
1.755*** (0.130) |
1.660*** (0.128) |
|
| Unconventional spending | 1 525*** (0.124) |
1.800*** (0.174) |
||
| Received UI | 0.826 (0.120) |
0.840 (0.124) |
||
| Applied for UI | 1.321* (0.193) |
1.479*** (0.221) |
||
| Second income quartile | 1.315*** (0.099) |
1.024 (0.093) |
1.005 (0.093) |
1.020 (0.105) |
| Third income quartile | 1.080 (0.076) |
0.778*** (0.073) |
0.768*** (0.073) |
0.739*** (0.079) |
| Fourth income quartile | 0.671*** (0.053) |
0.464*** (0.058) |
0.477*** (0.060) |
0.395*** (0.059) |
| Female | 0.902* (0.049) |
0.798*** (0.057) |
0.792*** (0.058) |
0.808*** (0.066) |
| Age 18–30 | 0.724*** (0.064) |
0.584*** (0.064) |
0.574*** (0.063) |
0.562*** (0.067) |
| Age 65+ | 0.793*** (0.069) |
0.872 (0.111) |
0.916 (0.119) |
0.775 (0.130) |
| Black | 1.818*** (0.199) |
1.726*** (0.237) |
1.803*** (0.250) |
1.680*** (0.263) |
| Asian | 2.465*** (0.182) |
2.166*** (0.231) |
2.153*** (0.233) |
1.417*** (0.185) |
| Latino | 1.596*** (0.108) |
1.611*** (0.144) |
1.647*** (0.149) |
1.404*** (0.141) |
| Persons in HH | 1.046** (0.022) |
1.058** (0.029) |
1.061** (0.030) |
1.060* (0.032) |
| Number of children in HH | 1.184** (0.081) |
1.244** (0.118) |
1.257** (0.120) |
1.228* (0.130) |
| BA or higher | 0.756*** (0.045) |
0.748*** (0.059) |
0.756*** (0.060) |
0.665*** (0.059) |
| No HS diploma | 1.389*** (0.175) |
1.168 (0.173) |
1.177 (0.178) |
1.294 (0.212) |
| Constant | 0.036*** (0.004) |
0.056*** (0.008) |
0.045*** (0.007) |
0.146*** (0.025) |
| No. of observations | 15,918 | 7,897 | 7,758 | 4,575 |
| No. of weeks | 13 | 13 | 13 | 13 |
Note. Data from U.S. Census Pulse weeks 13–26. Coefficients are odds ratios. Regressions are random-effects logit models, with week fixed effects. Weighted by person Model 1 includes all HHs except owners who have no mortgage. Models 2 and 3 include all renter HHs; Model 4 includes renter HHs who have lost work or income. “Unconventional Spending” means the respondent is relying on credit cards, loans, family, or savings to cover normal expenses. Standard errors in parentheses.
p < .05.
p < .01.
p < .001.
Because we have controlled for income, adverse economic shocks, and most demographics, these owner–renter differences likely reflect attributes of renters we cannot directly observe, such as lower levels of savings and less affluent friend-and-family networks. This finding reinforces the assertion we made in the article’s introduction: the literature’s relative lack of attention to rental nonpayment is incongruent with the relative vulnerability renters face.
The remaining columns in both tables examine renters alone. The dependent variable in these models is either late rent payment in the current month (Wave 1 of the Pulse) or being behind on rent generally (Wave 2).27 Some of these models examine all renters, while in others the sample is restricted to tenants who have lost work or income. This restriction shrinks the sample size substantially, but allows us to better isolate the associations between nonpayment and various forms of assistance that tenants might receive.
Examining all renters (Model 2 in the tables) suggests that lost employment income is by far the strongest predictor of delinquent rent payment (consistent with our second hypothesis). The odds of a tenant household with lost employment income being late on the current month’s rent are over 4 times the odds for a similar household that did not lose income (in Wave 1). Similarly, in Wave 2, tenant households that lost income have odds of being behind on rent almost 3 times as large as those of households that did not lose income (2.5 times once we control for unconventional spending and UI application and receipt). Being currently unemployed also strongly predicts delinquency, with the odds of being late on the current month’s rent being 49% higher (Wave 1) and behind on rent 75% higher (Wave 2).
Socioeconomic characteristics predict delinquency in smaller but mostly expected ways. Of note, lower income and educational attainment strongly predict delinquency, and Blacks and Latinos, even controlling for income, were more likely to report being late than Whites (lending support to our third hypothesis).28
In our regressions that restrict the sample to households that lost work or income (Models 3 and 4 in Table 3, and Model 4 in Table 4), our interest is primarily focused on three potential ways to compensate for that lost income. The first is unconventional spending, meaning the household reports relying more on credit cards, loans, savings, or borrowing from family and friends to cover their normal expenses (these may include rent, but are not restricted to rent). The second, which is only meaningful in Wave 1, is a stimulus payment from the federal CARES Act. The third is UI, which, as we have noted, was boosted substantially during Wave 1 of the Pulse but had fallen sharply when Wave 2 was administered.
In both Pulse waves, unconventional spending is strongly associated with rent delinquency. We do not consider this result causal. It is more likely that both borrowing and delinquency spring from the same underlying economic distress, and that this shared positive correlation outweighs any negative interaction between the two (e.g., people being able to put some of their rent on a credit card to stay current).
Direct assistance from the government, in contrast—in the form of stimulus and UI—in Wave 1 does appear to be protective.29 Table 3 suggests that among renters who lost work or income, receipt of a CARES stimulus check was associated with a 20% reduction in the odds of being late on the current month’s rent. The coefficients associated with UI receipt are stronger, and suggest a 75% reduction in the odds of paying rent late in the current month.
In Wave 2, the association between UI and rent payment all but vanishes.30 The sign remains negative, but the coefficients shrink and UI receipt is only statistically significant at the 10% level in one of three models. The Pulse thus lends only mixed support for our fourth hypothesis—that government support will be associated with reduced nonpayment. One potential explanation for this mixed result, again, is the much-diminished size of UI during Wave 2. A second potential explanation is that the Pulse captures the duration of neither pandemic-related unemployment nor pandemic-related UI. In Wave 1, the short duration of the pandemic to that point meant these were intrinsically correlated. By Wave 2, however, they may have diverged, and some respondents may have had (for example) 10 weeks of unemployment but only two weeks of UI.
Regression Results: Our Los Angeles Renter Survey
Turning now to the LA County Renter Survey, Table 5 reports results from five regressions that examine various forms of nonpayment. Recall that in both waves of this survey we asked about three forms of difficulty paying rent: paying late, paying in part, or not paying at all. These questions, compared to the Pulse, allow us to examine nonpayment in more detail, but the surveys also have smaller sample sizes than the Pulse, which will likely affect significance tests.
Table 5.
Associations with rent delinquency (odds ratios)—LA County Renter Survey.
| 1 | 2 | 3 | 4 | 5 | |
|---|---|---|---|---|---|
| Variables | Any distress (Wave 1) | Any distress (Wave 2) | Late payment | Partial payment | Nonpayment |
| Lost job | 4.233*** (0.908) |
2.272*** (0.500) |
2.097*** (0.461) |
1.699*** (0.293) |
2.927*** (0.712) |
| Lost work hours or income | 1.926*** (0.451) |
1.634** (0.354) |
2.030*** (0.465) |
1.089 (0.204) |
1.654* (0.466) |
| Has had COVID-19 | 1.748** (0.417) |
1.419** (0.250) |
1.089 (0.217) |
1.305* (0.196) |
1.315 (0.298) |
| Receives unemployment insurance | 0.683* (0.134) |
0.928 (0.193) |
0.891 (0.171) |
1.139 (0.179) |
0.495*** (0.114) |
| Landlord type: Individual | 0.999 (0.177) |
1.387* (0.245) |
1.275 (0.232) |
1.271 (0.188) |
0.949 (0.203) |
| Landlord type: Family or friend | 2.642*** (0.675) |
1.905*** (0.443) |
1.255 (0.313) |
2.282*** (0.427) |
1.162 (0.327) |
| Rent (thousands of US$) | 1.031 (0.117) |
1.078 (0.108) |
0.983 (0.110) |
1.077 (0.0841) |
1.017 (0.130) |
| Moved in last year | 0.983 (0.157) |
2.015*** (0.315) |
0.669** (0.109) |
1.951*** (0.247) |
1.239 (0.236) |
| Single-family home | 1.140 (0.222) |
0.536*** (0.094) |
0.902 (0.176) |
0.710** (0.101) |
1.139 (0.246) |
| Multifamily home (10+ units) | 0.999 (0.192) |
0.307*** (0.063) |
1.146 (0.225) |
0.410*** (0.071) |
0.699 (0.172) |
| Black | 1.847** (0.465) |
1.545* (0.398) |
1.545* (0.380) |
1.400 (0.288) |
1.287 (0.378) |
| Asian | 0.575* (0.172) |
0.968 (0.246) |
0.509** (0.171) |
1.320 (0.273) |
0.298** (0.145) |
| Hispanic | 1.071 (0.211) |
0.810 (0.160) |
1.025 (0.209) |
1.005 (0.164) |
0.875 (0.204) |
| Over 65 years old | 0.776 (0.200) |
0.539** (0.139) |
0.782 (0.204) |
0.714 (0.163) |
0.810 (0.248) |
| Household size | 1.100 (0.069) |
1.283*** (0.087) |
1.071 (0.069) |
1.212*** (0.059) |
1.020 (0.078) |
| Any children in household | 1.499** (0.303) |
0.748 (0.139) |
1.127 (0.221) |
1.071 (0.158) |
0.912 (0.214) |
| Female | 1.252 (0.193) |
1.012 (0.152) |
1.167 (0.180) |
0.929 (0.114) |
1.418* (0.263) |
| No high school diploma | 0.644* (0.167) |
1.212 (0.291) |
0.847 (0.211) |
0.920 (0.188) |
1.146 (0.314) |
| BA or more education | 0.787 (0.141) |
0.781 (0.133) |
0.840 (0.155) |
0.773* (0.108) |
0.966 (0.213) |
| Married | 0.857 (0.142) |
0.558*** (0.094) |
1.070 (0.194) |
0.744* (0.115) |
1.032 (0.222) |
| Income < $25,000 | 1.332 (0.254) |
1.385* (0.271) |
1.007 (0.186) |
1.081 (0.171) |
1.493* (0.313) |
| Household income > $100,000 | 0.546** (0.138) |
1.297 (0.261) |
0.454*** (0.122) |
1.661*** (0.264) |
0.494** (0.159) |
| Received CARES stimulus check | 0.716* (0.123) |
||||
| Lives outside City of Los Angeles | 0.942 (0.154) |
0.861 (0.131) |
1.130 (0.181) |
0.702*** (0.087) |
1.229 (0.235) |
| Wave 2 of survey | 0.968 (0.162) |
1.845*** (0.250) |
1.069 (0.211) |
||
| Constant | 0.170*** (0.065) |
0.288*** (0.109) |
0.0603*** (0.023) |
0.0627*** (0.019) |
0.0341*** (0.015) |
| Pseudo R2 | 0.15 | 0.18 | 0.05 | 0.16 | 0.06 |
| No. observations | 1,000 | 1,000 | 2,000 | 2,000 | 2,000 |
Note. Standard errors in parentheses, “Any distress” includes households that have paid late, partially, or not at all. Models 3–5 combine both waves of the survey.
p < .1.
p < .05.
p < .01.
Our regression approach is as follows: The first two columns of Table 5 examine each wave, and analyze a dependent variable coded 1 if a respondent reported any form of renter distress (late, partial, or entirely missed payment) in any of the three months and 0 otherwise. The next three columns combine the two surveys (and add a survey-specific fixed effect) and examine the different forms of distress separately.
Our results are largely consistent with those from the Pulse. Losing work or income powerfully predicts renter distress (supporting hypothesis 2).31 The odds of renter distress for a household that lost work are from roughly 2 to over 4 times as high as the odds for tenant households that did not lose work, depending on the form of renter distress. The odds for tenant households that lost work or income, similarly, are between 1.5 and two times as high. Households with someone who contracted COVID-19 were substantially more likely to report renter distress in both waves of our survey.
One unexpected finding involves income. In general, lower-income households are at high risk for nonpayment. In our Wave 2 survey, however, high-income households are significantly more likely to pay only partial rent, although they are less likely to pay late or not at all. This finding might be noise, but it may also reflect some moral hazard generated by state renter assistance programs. Knowing that the state government was debating ways to pay renter debt to landlords, households confident in their ability to pay, or to find new housing if necessary, may have strategically deferred some payment.
Similar to the Pulse, the LA County regressions show Black tenants to be at greater risk for nonpayment, but unlike the Pulse the results for Hispanic tenants are noisy and nonsignificant. This result may owe to a smaller sample size, or to the LA County Renter Survey having more detailed controls than the Pulse. Whatever the reason, the LA County Renter Survey thus provides only mixed support for hypothesis 3.
The regressions also show that as hypothesized (hypothesis 5), nonpayment is more common among tenants who rent from family and friends.32 The coefficient associated with this landlord type is always positive and is statistically significant in three of the five models, suggesting that the odds of tenants with these landlords reporting some form of nonpayment are 1.8 to 2.5 times as high as those of tenants who report renting from a corporate landlord. Variables measuring the size of the rental building, as opposed to its management structure, do not yield consistent results.
Finally, these models do suggest that UI helped. In Wave 1 (when, again, UI was most generous) tenants who received it had odds of renter distress that were 31% lower than those of tenants who did not. UI was not significant in three other models, including the model for Wave 2 (when it was less generous) and in combined-wave models that examine late or partial payment. In the combined model that examines missing rent completely, however, UI is strongly negative. This model suggests that the odds of missing an entire month’s payment were 50% lower for households receiving UI. A majority of households (70%) reported receiving stimulus checks through the federal CARES act, and these households were 30% less likely to experience problems making rent. Thus, the LA County Renter Survey, like the Pulse, offers strong but not entirely consistent support for hypothesis 4.
Table 6 examines renter responses from another angle: the associations with tenant borrowing and the amount of accrued rent debt. We estimate three regressions: a logit regression where the dependent variable is coded 1 if the respondent resorted to any form of borrowing (including dipping into savings) to cover rent, and 0 otherwise, and two Ordinary Least Squares (OLS) regressions that estimate how much back rent a tenant owes—one measured in months and the other in dollars (these latter regressions use only Wave 2 of the survey). In short, lost work and hours strongly predict borrowing, and also predict owing more back rent, albeit with slightly less consistency. Higher rents, larger households, and renting from a family member or friend also predict tenant debt. These results are largely consistent with our hypothesis 6. The latter two regressions in Table 6, which examine rental arrears, reinforce our findings above: lost work and lost income predict more trouble paying. We consider this additional support for our hypothesis 2.
Table 6.
Associations with paying rent borrowed money and with lost work—LA County Renters Survey.
| 1 | 2 | 3 | |
|---|---|---|---|
| Variables | Any borrowing (odds ratios) | Back rent owed (months) (OLS coefficients) | Back rent owed (US$) (OLS coefficients) |
| Lost job | 2.612*** (0.371) |
0.556** (0.279) |
393 (477) |
| Lost work hours or income | 1.590*** (0.225) |
0.160 (0.300) |
−511 (513) |
| Has had COVID-19 | 1.731*** (0.238) |
0.390* (0.217) |
−742** (371) |
| Receives UI | 0.990 (0.138) |
−0.132 (0.250) |
−160 (427) |
| Landlord type: Individual | 0.954 (0.109) |
−0.0673 (0.249) |
−615 (426) |
| Landlord type: Family or friend | 1.823*** (0.309) |
0.886*** (0.298) |
−649 (510) |
| Rent (thousands of US$) | 1.236*** (0.087) |
0.377*** (0.127) |
878*** (218) |
| Moved in last year | 1.545*** (0.160) |
0.478** (0.204) |
−363 (349) |
| Single-family home | 0.642*** (0.080) |
−0.690*** (0.230) |
−785** (393) |
| Multifamily home 10+ units | 0.642*** (0.081) |
−0.800*** (0.293) |
−291 (502) |
| Black | 0.828 (0.140) |
−0.060 (0.323) |
−251 (552) |
| Asian | 0.935 (0.156) |
−0.818** (0.333) |
−776 (570) |
| Hispanic | 0.823 (0.106) |
−1.566*** (0.266) |
−1,972*** (456) |
| Over 65 years old | 0.525*** (0.085) |
0.358 (0.374) |
363 (641) |
| Household size | 1.152*** (0.051) |
0.162* (0.086) |
273* (148) |
| Any children in household | 1.065 (0.139) |
−0.065 (0.234) |
−202 (399) |
| Female | 0.899 (0.089) |
−0.340* (0.199) |
−133 (341) |
| No high school diploma | 0.700** (0.118) |
0.339 (0.323) |
1,285** (552) |
| BA or more education | 0.811* (0.093) |
−0.385* (0.228) |
−279 (390) |
| Married | 0.594*** (0.068) |
−0.0476 (0.237) |
−931** (405) |
| Low income | 1.094 (0.141) |
−0.249 (0.265) |
−1,301*** (454) |
| High income | 0.775* (0.109) |
0.392 (0.255) |
−30 (437) |
| Lives outside City of Los Angeles | 0.690*** (0.071) |
−0.582*** (0.196) |
957*** (335) |
| Constant | 0.620** (0.142) |
3.411*** (0.536) |
3,028*** (917) |
| Pseudo R2 | 0.12 | 0.31 | 0.19 |
| No. observations | 2,000 | 489 | 489 |
Note. Standard errors in parentheses. “Any borrowing” means the respondent used a credit card, payday loan, savings, or loan from family or friend to pay rent. Model 1 sample is both survey waves; Models 2 and 3 are restricted to Wave 2 respondents owing back rent. “Low income” refers to household annual income of less than $25,000. “High income” refers to household annual income of more than $100,000.
p < .1.
p < .05.
p < .01.
Tables 7 and 8 present regressions that analyze landlord response, allowing us to test hypotheses 7–9. We use two sets of regressions because, as discussed above, our survey asks about eviction in two different ways. In Wave 1, when the county was still in the early stages of the pandemic, questions about landlord reactions were only asked of people who reported being behind in one of the previous three months. When we fielded Wave 2, however, in addition to asking about the previous three months we asked respondents if they had fallen behind at all, and as such also asked all respondents—not just those delinquent in the previous three months—if their landlords had threatened or initiated an eviction, or denied repairs or turned off utilities.
Table 7.
Landlord response to distress (odds ratios)—LA County Renter Survey.
| 1 | 2 | 3 | 4 | |
|---|---|---|---|---|
| Repayment plan | Reduced services | Threatened to evict | Initiated eviction | |
| Entered into repayment plan | 2.102** (0.682) |
1.271 (0.394) |
1.316 (0.493) |
|
| Months of late payment | 1.069 (0.326) |
0.555** (0.156) |
1.192 (0.342) |
0.775 (0.248) |
| Months of partial payment | 2.163 (1.335) |
4.351** (2.569) |
1.559 (0.984) |
5.304* (5.309) |
| Months of nonpayment | 1.743 (0.997) |
1.483 (0.716) |
0.887 (0.489) |
0.571 (0.397) |
| Lost job | 1.420 (0.550) |
2.242** (0.841) |
1.676 (0.630) |
1.934 (0.856) |
| Lost work hours or income | 0.560 (0.223) |
1.214 (0.504) |
0.703 (0.295) |
0.700 (0.359) |
| Received unemployment insurance | 1.274 (0.405) |
1.197 (0.362) |
1.387 (0.428) |
1.503 (0.543) |
| Landlord type: Individual | 0.866 (0.307) |
1.698 (0.580) |
1.855* (0.667) |
2.383* (1.081) |
| Landlord type: Family or friend | 0.797 (0.319) |
2.341** (0.896) |
3.456*** (1.386) |
3.932*** (1.963) |
| Rent (thousands of US$) | 1.062 (0.168) |
1.165 (0.167) |
1.113 (0.158) |
1.256 (0.199) |
| Moved in last year | 0.990 (0.276) |
1.133 (0.295) |
1.177 (0.313) |
1.187 (0.365) |
| Single-family home | 1.112 (0.343) |
0.826 (0.236) |
0.908 (0.264) |
0.997 (0.332) |
| Multifamily home with 10+ units | 0.772 (0.307) |
0.910 (0.372) |
1.503 (0.632) |
1.072 (0.559) |
| Black | 1.504 (0.609) |
0.669 (0.256) |
0.666 (0.251) |
0.570 (0.254) |
| Asian | 1.843 (0.928) |
1.184 (0.489) |
0.779 (0.321) |
1.068 (0.480) |
| Hispanic | 1.327 (0.451) |
0.754 (0.248) |
0.353*** (0.118) |
0.418** (0.166) |
| Over 65 years old | 6.117** (4.964) |
0.856 (0.485) |
0.501 (0.303) |
0.226* (0.195) |
| Household size | 0.927 (0.098) |
0.874 (0.091) |
1.155 (0.119) |
1.227* (0.148) |
| Children in household | 1.303 (0.419) |
1.365 (0.413) |
0.572* (0.174) |
0.689 (0.240) |
| Female | 1.564 (0.426) |
0.964 (0.252) |
0.649 (0.173) |
0.847 (0.267) |
| Education: No high school | 1.208 (0.550) |
0.449 (0.231) |
1.119 (0.524) |
1.665 (0.907) |
| Education: BA or more | 1.115 (0.338) |
1.086 (0.290) |
1.153 (0.316) |
1.473 (0.464) |
| Married | 0.673 (0.221) |
0.782 (0.255) |
1.557 (0.506) |
0.897 (0.361) |
| Income < $25,000 | 0.494** (0.159) |
2.258** (0.757) |
0.899 (0.314) |
1.053 (0.455) |
| Household income > $100,000 | 1.686 (0.655) |
1.618 (0.524) |
1.032 (0.337) |
1.009 (0.369) |
| Lives outside City of Los Angeles | 1.544 (0.409) |
0.850 (0.213) |
0.548** (0.140) |
0.606* (0.180) |
| Wave 2 of survey | 1.008 (0.312) |
1.620 (0.486) |
2.320*** (0.724) |
2.751*** (1.079) |
| Constant | 0.765 (0.719) |
0.021*** (0.021) |
0.075*** (0.074) |
0.004*** (0.006) |
| Pseudo R2 | 0.09 | 0.13 | 0.17 | 0.23 |
| No. observations | 394 | 394 | 394 | 394 |
Note. Standard errors in parentheses. The sample is restricted to households that reported distress (i.e., late payment, partial payment or nonpayment). “Reduced Services” means the landlord reduced maintenance or cut off utilities.
p < .1.
p < .05.
p < .01.
Table 8.
Associations with eviction threats (odds ratios)—LA County Renter Survey.
| Threat of eviction | Eviction initiated | Reduced services | ||||
|---|---|---|---|---|---|---|
| 1 | 2 | 3 | 4 | 5 | 6 | |
| Months behind in rent | 1.408*** (0.0908) |
1.400*** (0.0961) |
1.148** (0.0747) |
|||
| Back rent (log of US$) | 1.610*** (0.227) |
1.683*** (0.282) |
1.539** (0.265) |
|||
| Landlord: Family or friend | 1.957 (0.829) |
2.586** (1.055) |
2.460* (1.215) |
3.148** (1.503) |
0.681 (0.304) |
0.802 (0.361) |
| Small landlord | 1.301 (0.494) |
1.357 (0.500) |
1.642 (0.756) |
1.673 (0.746) |
0.741 (0.281) |
0.751 (0.285) |
| Speaks English poorly | 0.756 (0.433) |
0.545 (0.313) |
0.911 (0.598) |
0.638 (0.421) |
0.153** (0.127) |
0.125** (0.106) |
| Sick with COVID | 3.338*** (0.916) |
4.103*** (1.104) |
2.715*** (0.800) |
3.501*** (1.014) |
2.881*** (0.837) |
3.361 *** (0.998) |
| Black | 0.611 (0.256) |
0.710 (0.283) |
0.397** (0.179) |
0.490* (0.211) |
0.612 (0.267) |
0.626 (0.274) |
| Hispanic | 0.456** (0.169) |
0.406** (0.147) |
0.383** (0.157) |
0.367** (0.147) |
0.800 (0.311) |
0.900 (0.358) |
| Asian | 0.642 (0.270) |
0.545 (0.223) |
1.105 (0.461) |
0.952 (0.388) |
1.180 (0.511) |
1.111 (0.483) |
| Age 65 or older | 0.130*** (0.081) |
0.178*** (0.104) |
0.053*** (0.045) |
0.074*** (0.061) |
0.098*** (0.071) |
0.093*** (0.068) |
| Persons in HH | 1.309** (0.152) |
1.284** (0.145) |
1.331** (0.165) |
1.298** (0.157) |
0.856 (0.110) |
0.840 (0.110) |
| Children in HH | 0.572* (0.181) |
0.607 (0.188) |
0.591 (0.199) |
0.652 (0.214) |
1.404 (0.473) |
1.399 (0.474) |
| Education: Less than HS | 1.614 (0.753) |
1.386 (0.641) |
1.398 (0.722) |
1.229 (0.631) |
0.489 (0.263) |
0.423 (0.234) |
| Education: BA or higher | 1.275 (0.378) |
0.961 (0.276) |
1.495 (0.471) |
1.135 (0.346) |
0.892 (0.270) |
0.743 (0.228) |
| Married | 0.672 (0.238) |
0.868 (0.300) |
0.871 (0.327) |
1.086 (0.400) |
0.859 (0.299) |
1.112 (0.396) |
| Income < $25,000 | 0.621 (0.251) |
0.819 (0.319) |
0.586 (0.268) |
0.799 (0.354) |
2.036* (0.873) |
2.356* (1.047) |
| Income > $100,000 | 1.487 (0.469) |
1.637 (0.510) |
1.286 (0.421) |
1.412 (0.460) |
4.085*** (1.385) |
4.159*** (1.427) |
| Lives outside City of LA | 0.518** (0.137) |
0.394*** (0.101) |
0.705 (0.203) |
0.518** (0.144) |
0.925 (0.253) |
0.797 (0.217) |
| Constant | 0.036*** (0.023) |
0.109*** (0.062) |
0.016*** (0.012) |
0.046*** (0.030) |
0.247** (0.166) |
0.294* (0.187) |
| Pseudo R2 | 0.30 | 0.27 | 0.30 | 0.27 | 0.18 | 0.19 |
| N | 489 | 489 | 489 | 489 | 355 | 355 |
Note. Standard errors in parentheses. The sample is restricted to respondents in Wave 2 of the LA County Renter Survey who report being behind on rent.
p < .1.
p < .05.
p < .01.
To accommodate these differing structures, in Table 7, which presents our first set of landlord reaction regressions, we use data from both Wave 1 and Wave 2 and only measure the association between landlord action and tenant delinquency in the previous three months. The sample size here is small (N = 394), which likely affects significant tests. Table 8, in contrast, is restricted to the sample of tenants in Wave 2 who report being behind on rent at all. This sample is slightly larger (N = 489), but also captures longer periods of delinquency. By design, no respondents in Table 7 are more than three months behind on rent. Some respondents in Table 8, in contrast, are a year behind.
Table 7 presents the results from four models. The first predicts the likelihood of entering into a repayment plan, and only two household characteristics were significantly correlated with this action. Elderly tenants were much more likely (over 6 times) to create a repayment plan, and low-income tenants were much less likely. The second model predicts a landlord cutting tenant services. Households with more months of partial payment are more likely to experience service cuts, as are those who lost work, are low-income, or rent from family and friends. Entering into a repayment plan is also positively associated with cutting services, which is somewhat counterintuitive, unless one considers that repayment plans might be a sign more of landlord anxiety than landlord sympathy.33
The third model in Table 7 predicts threatened eviction and the fourth predicts an eviction being initiated (remember that these are tenant reports of initiation, and as such may differ from official records of filed evictions). We saw in descriptive statistics that the type of landlord is strongly associated with a greater likelihood of eviction threats and proceedings, even controlling for the likelihood of nonpayment, and the regressions bear that out. Individual landlords are twice as likely than property management companies to threaten eviction, and family and friend landlords are 4 times as likely (supporting hypothesis 7). Female tenants are two thirds as likely to be threatened with eviction as male tenants, but households with children are over 3 times as likely than those without.
Notably, neither Table 7 nor Table 8 suggests that nonwhite tenants, controlling for delinquency, are more likely to face eviction threats or initiations. The coefficients associated with Asian households are all statistically nonsignificant, whereas those associated with Black and Hispanic households suggest that, ceteris paribus, these households are less likely to be threatened or filed against in some cases. This evidence disconfirms our hypothesis 8.
A final point about Table 7 is that the number of months behind, when only the prior three months were examined, had no consistent significant relationship with eviction threats or eviction initiations. We turn now to Table 8, which uses regressions that can capture longer periods of delinquency. The table shows six models examining tenant-reported threats of eviction, initiated eviction, and landlords reducing services. We use six models because we asked two different questions about back rent: the number of total months behind, and the total dollars owed to the landlord. For context, among respondents behind on rent, the median back rent owed is $2,800, and the median months owed is three. These variables are obviously correlated, so we measure them separately.34
The regressions show that the number of months behind consistently and strongly predicts landlord consequences, supporting our hypothesis 9. In Model 1, for example, the odds of an eviction threat rise by a factor of 3.4 with standard deviation increase in the number of months behind (2.4 months). Model 3 shows similar relationships between months behind and an eviction being initiated. The relationship between months behind and the odds of a landlord turning off utilities is lower, yet nonetheless increases the likelihood by nearly 3 times.
The amount of back rent owed also predicts landlord consequences significantly, although the relationship is slightly less strong than when measured in months. The coefficients imply that a 10% increase in back rent makes an eviction threat 1.6 times more likely, and the odds of an initiated eviction slightly higher, at 1.7 times. The relationship with services being reduced is slightly weaker.
We again find that tenants renting from a family or friend are more likely to face eviction threats or initiations. Those who reported being sick with COVID are much more likely to have faced eviction threats and initiations, and to have services turned off. Those age 65 or older and respondents identifying as Black or Hispanic were less likely to report some of these landlord actions. Larger households were more likely to report threats and the initiation of eviction. Surprisingly, both higher and lower income households were more likely to report landlords reducing services, compared to middle-income households.35
Discussion and Conclusion
Particularly in the aftermath of the Great Recession, housing scholars have devoted considerable attention to the determinants and consequences of homeowner delinquency. Similar attention has not been paid to renters, even though there is a priori reason to believe renter nonpayment is more likely and its consequences more dire. We use two waves of two surveys, the Census Pulse and our own LA County Renter Survey, to begin shedding light on this issue, examining patterns and consequences of nonpayment among tenants during the first year of the COVID-19 pandemic in Los Angeles.
Both our own survey and the Pulse were deployed rapidly in response to a crisis, and although both have samples that largely mirror 2019 Census estimates, they are, in ways we have discussed, unlikely to be perfectly representative of Los Angeles renters. Although readers should bear that caveat in mind, our data do permit some conclusions. We had posited nine hypotheses; we summarize these, alongside our findings, in Table 9.
Table 9.
Summary of results.
| Hypothesis | Finding | Data | Table(s) |
|---|---|---|---|
| 1. Renters, all else equal, will be more likely than owners to struggle with housing payments. | Cannot reject | Pulse Wave I and II | 3,4 |
| 2. The primary factor in renter difficulty paying will be lost income, via lost employment or hours. | Cannot reject | Pulse Wave I and II; LA Renter Survey | 3–6 |
| 3. Government income support will reduce nonpayment. | Mixed | Pulse Wave I and II; LA Renter Survey | 5 |
| 4. Even controlling for lost work and earnings, low-ncome and nonwhite renters are more likely to report difficulty paying. | Cannot reject for Black; Mixed for Hispanic | Pulse Wave I and II; LA Renter Survey | 5 |
| 5. Renters will be more likely to be late or miss payment if their landlord is a friend or family member or a “mom and pop” landlord. | Cannot reject for “any distress.” | LA Renter Survey | 5 |
| 6. Renters who lose work or income will take on other forms of debt to help pay the rent. | Cannot reject | LA Renter Survey | 6 |
| 7. Controlling for nonpayment, smaller landlords will be more likely to threaten or initiate eviction. | Cannot reject | LA Renter Survey | 7,8 |
| 8. Controlling for nonpayment, landlords will be more likely to threaten nonwhite renters with eviction. | Cannot confirm | LA Renter Survey | 7,8 |
| 9. Landlords will be more likely to threaten or initiate eviction as renters fall further behind. | Mixed | LA Renter Survey | 7,8 |
First, our analysis strongly suggests that renters are more vulnerable than homeowners. Even controlling for lost work and income and a wide range of socioeconomic attributes, renters were substantially more likely to report falling behind on their housing payments. We also find that, compared to the pre-COVID baseline, renters did fall dramatically behind. Measures of pre-COVID tenant delinquency are rare, but by almost any measure we use, renter nonpayment jumped during the pandemic: where in 2017 fewer than 3% of tenants had not paid in full in the previous three months, in 2020 that figure was 17%, and by 2021 it was over 30%.
The strongest predictors of late or missed payment were lost income and work, followed by sickness with COVID-19. In regressions that controlled for these factors as well as tenant income, race had a somewhat inconsistent relationship with late or missed payment: in the Pulse, Black and Hispanic or Latino renters were more likely to be behind on their rent payments, but this finding did not hold in the LA County Renter Survey (which admittedly has a smaller sample). Late payment and nonpayment were more common among smaller landlords, and especially among tenants who rented from family and friends.
In general, tenants who fell behind entered into repayment plans with their landlords. A nontrivial minority, however, reported threats of eviction, and the share of this group that reported evictions being initiated grew as the pandemic went on. Eviction threats and initiations were more common among tenants who were further behind, in months or in dollars. Eviction threats and actions were also more common from landlords who were friends or family. This finding, when combined with the finding that tenants are more likely to miss payments to these landlords, is consistent with a situation where tenants misjudge landlord reaction: they believe family or friends can and will be more likely to offer forbearance, when in fact the opposite is true.
Controlling for other factors, race did not predict eviction actions: although descriptively Black and Hispanic tenants are more likely to face eviction threats or initiation, in our data these patterns appear to be artifacts of differential racial exposure to lost work and low income, not differential treatment by landlords. Our eviction samples are small, however; more research, with larger sample sizes, might yield different results.
Eviction, as mentioned in the introduction, is the most visible and dire outcome of an inability to pay rent. But it is not the only outcome. Many tenants in our sample, likely in an effort to avoid eviction, dipped into their savings or went into other forms of debt to pay rent. Nearly a third of renters in our survey reported using savings to pay the rent in the first wave, and, like most measures of renter distress, these numbers had risen by the second survey. Smaller but still notable shares of tenants—both those behind and those current—put rent on credit cards, borrowed from friends and family, and took out emergency loans.
The prevalence of this other debt is a reminder that even tenants paying on time and in full may nevertheless be struggling with housing burdens. Households that pay rent with loans or credit cards may avoid eviction but be saddled with high-interest debt that, given their low incomes, could take a long time to escape.
From a policy perspective, our evidence suggests that governments should prioritize direct payments to struggling renters. In our regressions, payments of this sort, particularly when they were more generous, were associated with lower rates of nonpayment. This finding reinforces some basic policy wisdom: when people don’t have enough money, policymakers should give them money. A recurring concern about such direct transfers is that they will be spent in suboptimal ways. The bulk of evidence about cash transfers suggests this fear is overblown (e.g., Lowrey, 2018), and our results suggest the same. Our data strongly suggest that renters who can pay will. In Wave 1, for example, among households that received unemployment benefits, only 5% paid rent late or not at all—a proportion roughly equal to nonpayment data from before the pandemic. The renter behavior found in our survey, in fact, is analogous to homeowner behavior at the time of the Great Financial Crisis—despite worries that underwater borrowers would fail to meet their mortgage obligations, those who kept their jobs overwhelmingly continued to pay their mortgages (Cunningham et al., 2021).
Direct assistance to renters is of course not the only way to help them. But alternative solutions to tenant struggles are likely to be more complicated, less comprehensive, or both. Eviction moratoria, as important as they are, are not a permanent solution—they delay rather than solve the problem. Calls to cancel rent entirely, or to offer blanket forgiveness for rental debt, face long political odds. Canceling rent also risks exposing smaller landlords to bankruptcy, and could, at least on the margins, introduce moral hazard and strategic behavior by tenants, and encourage landlords to exit the rental market. Perhaps most important is that canceling rent or forgiving rent debt risks neglecting many tenants who need assistance. Canceled rent does little for tenants who have stayed current by borrowing money from family, from credit cards, or from payday lenders. Our results suggest that there are many such tenants. These tenants have large debts to people other than their landlords, and rent forgiveness will not wipe those debts out. Although more research is needed, one apparent lesson from the COVID-19 pandemic is that policies that can quickly provide cash assistance to tenants appear to be the most promising way to mitigate renter distress.
Acknowledgements
We thank Miriam Pinski and Gregory Preston for data assistance, and Shane Philips and Madeline Brozen for survey assistance. This research was supported by the UCLA Luskin School, The USC Price Center for Real Estate, the UCLA Meyer and Renee Luskin Center for Inequality and Democracy, The California Community Foundation, the UCLA Ziman Center’s Rosalinde and Arthur Gilbert Program in Real Estate, and the UCLA Lewis Center for Regional Policy Studies.
Appendix.
Table A1.
Survey quotas, number of surveys completed, and share of target.
| Variable | Target quota (U.S. Census, 2019 1-year ACS) | Wave 1 completed | Wave 1 share of target (%) | Wave 2 completed | Wave 2 share of target (%) |
|---|---|---|---|---|---|
| Total | 1,000 | 1,000 | 100 | 1,000 | 100 |
| Female | 510 | 542 | 106 | 510 | 100 |
| Male | 490 | 454 | 93 | 490 | 100 |
| Female 18–24 | 22 | 24 | 109 | 37 | 168 |
| Female 25–34 | 121 | 124 | 102 | 121 | 100 |
| Female 35–44 | 116 | 118 | 102 | 116 | 100 |
| Female 45–54 | 100 | 103 | 103 | 100 | 100 |
| Female 55–59 | 40 | 42 | 105 | 38 | 95 |
| Female 60–64 | 35 | 37 | 106 | 35 | 100 |
| Female 65+ | 76 | 94 | 124 | 62 | 82 |
| Male 18–24 | 20 | 22 | 110 | 25 | 125 |
| Male 25–34 | 116 | 121 | 104 | 116 | 100 |
| Male 35–44 | 112 | 117 | 104 | 117 | 104 |
| Male 45–54 | 96 | 82 | 85 | 96 | 100 |
| Male 55–59 | 39 | 33 | 85 | 43 | 110 |
| Male 60–64 | 34 | 24 | 71 | 34 | 100 |
| Male 65+ | 73 | 53 | 73 | 59 | 81 |
| Hispanic (including multirace) | 438 | 443 | 101 | 438 | 100 |
| African American (non-Hispanic) | 125 | 125 | 100 | 126 | 101 |
| Asian (non-Hispanic, non-African American) | 132 | 113 | 86 | 132 | 100 |
| Caucasian/other | 305 | 319 | 105 | 304 | 100 |
| Household income | |||||
| Under $15,000 | 149 | 149 | 100 | 116 | 78 |
| $15,000–$24,999 | 110 | 110 | 100 | 110 | 100 |
| $25,000–$34,999 | 101 | 101 | 100 | 101 | 100 |
| $35,000–$49,999 | 137 | 137 | 100 | 137 | 100 |
| $50,000–$74,999 | 179 | 174 | 97 | 179 | 100 |
| $75,000–$99,999 | 118 | 119 | 101 | 118 | 100 |
| $100,000+ | 206 | 160 | 78 | 203 | 99 |
| Prefer not to answer | 0 | 50 | 36 | ||
| LA City | 400 | 391 | 98 | 410 | 103 |
| LA County | 600 | 609 | 102 | 590 | 98 |
Source. U.S. Census 2019 1-year ACS; LA County Renter Survey.
Table A2.
Benchmark descriptive statistics: Census ACS and Los Angeles County Renters Survey.
| Share of LA County Renter (ACS, 2019) | Share of Wave 1 | Share of Wave 2 | |
|---|---|---|---|
| Moved in last year | 32 | 45 | 48 |
| More than high school education | 60 | 73 | 77 |
| Married | 33 | 31 | 33 |
| Household size (mean) | 3 | 3 | 3 |
| Households with children | 32 | 33 | 34 |
| Single-family home | 21 | 29 | 29 |
| Multifamily structure (10+ units) | 45 | 35 | 30 |
| Median rent | 1,471 | 1,418 | 1,600 |
Source. U.S. Census 2019 one-year ACS; LA County Renter Survey.
Table A3.
Main survey questions from the Pulse and LA County Renter Survey.
| Questions | Pulse Wave 1 | Pulse Wave 2 | LA County Wave 1 | LA County Wave 2 |
|---|---|---|---|---|
| Lost work | In the last seven days, did you do any work for pay or profit? | In the last seven days, did you do any work for pay or profit? | Has anyone in your household (including yourself) lost a job since the March 16 stay-at-home order began? | Has anyone in your household (including yourself) lost a job since the COVID-19 stay-at-home order began in March 2020? |
| Lost income | Have you, or has anyone in your household, experienced a loss of employment income since March 13, 2020? | Have you, or has anyone in your household, experienced a loss of employment income since March 13, 2020? | Has anyone in your household (including yourself) lost work hours or income since the March 16 stay-at-home order began? | Has anyone in your household (including yourself) lost a job since the COVID-19 stay-at-home order began in March 2020? |
| Stimulus payment | The federal CARES Act provided one-time public assistance payments of up to $1,200 per adult and $500 per child. Did anyone in your household receive a CARES Act assistance payment from the CARES Act? | |||
| Income supports | Since March 13, 2020, did you receive Unemployment Insurance (UI) benefits? | Since March 13, 2020, have you applied for Unemployment Insurance (UI) benefits? [If yes, also asked:] Since March 13, 2020, did you receive Unemployment Insurance (UI) benefits? | Has anyone in your household received unemployment insurance payments as a result of the loss of job or income? | Has anyone in your household received unemployment insurance payments as a result of the loss of job or income? In addition to unemployment, during the pandemic governments offered different types of financial help for households. Since March 2020, have you or has anyone in your household received any of the following types of assistance? |
| Monthly rent | N/A | N/A | Earlier you mentioned that you rent your primary residence. How much does your landlord or property manager charge, per month, for rent? If you split rent with someone else (for example, if you have a roommate), we are interested in the total rent owed each month, not just your share. Please round to the nearest dollar amount and enter in the space provided below. | Earlier you mentioned that you rent your primary residence. How much does your landlord or property manager charge, per month, for rent? If you split rent with someone else (for example, if you have a roommate), we are interested in the total rent owed each month, not just your share. Please round to the nearest dollar amount and enter in the space provided below. |
| Rent owed (partial or full) | Is this household currently caught up on rent payments? | |||
| Rent payment | Did you pay your last month’s rent or mortgage on time? Select only one answer. [Yes/No/Payment was deferred] | In talking to people about the current situation, we are finding that many people are having trouble paying rent this month. What about you? In [month], has your household [paid rent in full, paid part of the rent, not paid rent at all] Did your household make the rent payment on the day it was due, or pay it late? |
In talking to people about the current situation, we are finding that many people are having trouble paying rent this month. What about you? In [month], has your household [paid rent in full, paid part of the rent, not paid rent at all] Did your household make the rent payment on the day it was due, or pay it late? |
|
| Rent confidence | How confident are you that your household will be able to pay your next rent or mortgage payment on time? | How confident are you that your household will be able to pay your next rent or mortgage payment on time? | In the coming month, August, do you think your household will…? [pay in full, pay part, not pay at all, move out of LA County, move somewhere in LA County where I/we don’t have to pay rent] | In the coming month, April, do you think your household will…? [pay in full, pay part, not pay at all, move out of LA County, move somewhere in LA County where I/we don’t have to pay rent] |
| Economic distress | [Multiple questions on changing spending habits, food insecurity] | |||
| Unconventional spending | Thinking about your experience in the last 7 days, which of the following did you use (or do you expect to use) to meet your spending needs? | To your knowledge, did you or anyone you live with rely on any of the following options to pay rent this month? [help from family, credit card, savings, payday or emergency loan, none] | To your knowledge, did you or anyone you live with rely on any of the following options to pay rent this month? [help from family, credit card, savings, payday or emergency loan, none] | |
| Repayment plan | [for those recently not paying in full] Have you or anyone you live with discussed a repayment plan with your property management company or landlord, to pay back the rent you owe? [Have you entered into one] [Has the landlord encouraged you to pay with credit card] | [for those recently not paying in full] Have you or anyone you live with discussed a repayment plan with your property management company or landlord, to pay back the rent you owe? [Have you entered into one] [Has the landlord encouraged you to pay with credit card] | ||
| Service reduction | Did your property manager or landlord reduce your services (for example, shut off utilities or reduce maintenance) after you did not pay rent? | Did your property manager or landlord reduce your services (for example, shut off utilities or reduce maintenance) after you did not pay rent? | ||
| Eviction threat | How likely is it that your household will have to leave this home or apartment within the next two months because of eviction? | An eviction is when your landlord or property manager forces you to move. Has your property manager or landlord threatened to evict you? | An eviction is when your landlord or property manager forces you to move. Has your property manager or landlord threatened to evict you? | |
| Eviction initiation | Has your property manager or landlord, to your knowledge, begun an eviction against you? | Has your property manager or landlord, to your knowledge, begun an eviction against you? |
Figure A1.
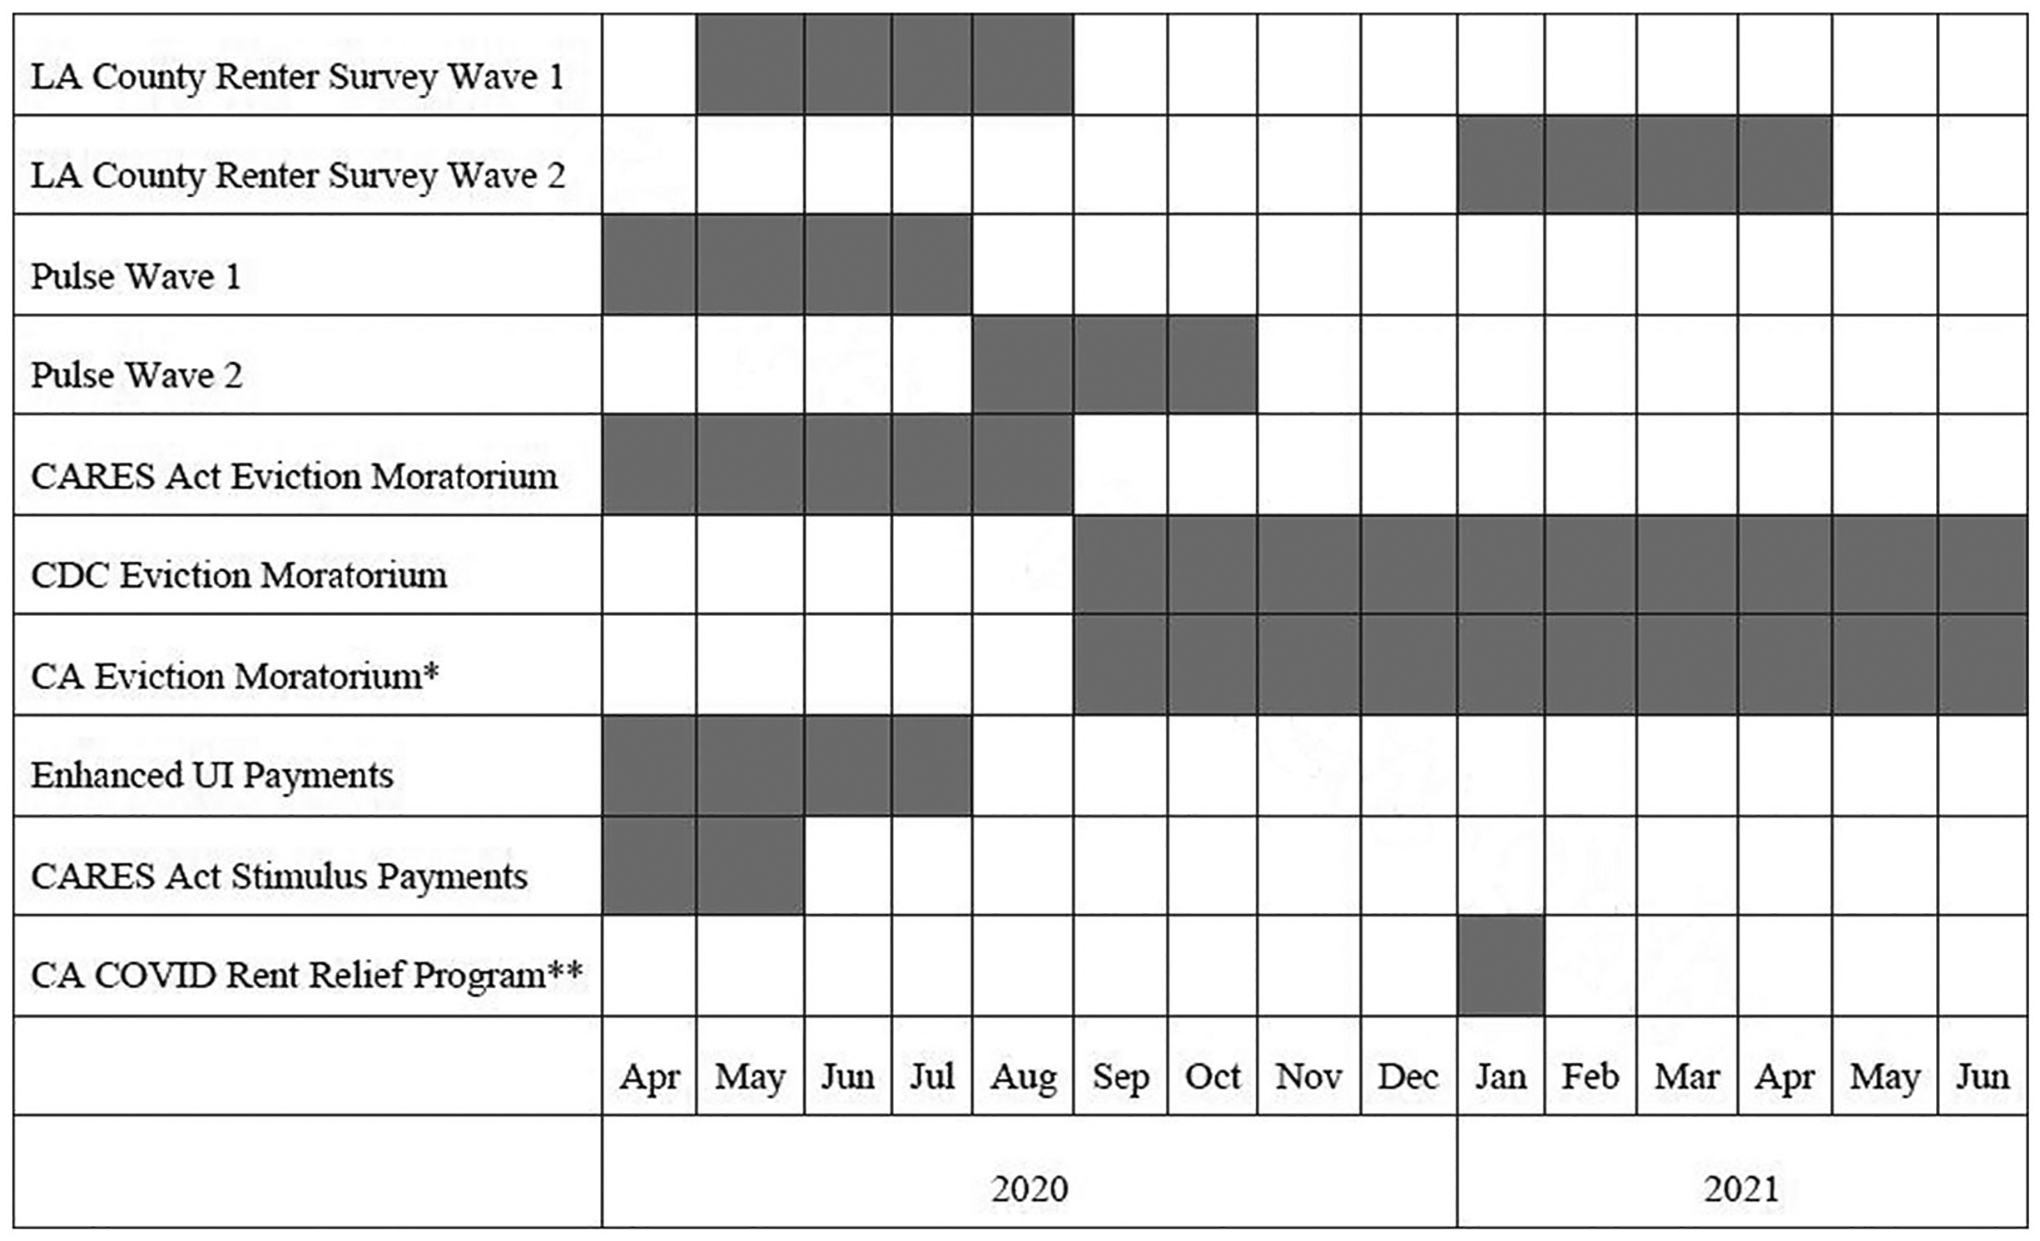
Timeline of surveys, eviction moratoria, and federal income support.
Note. *Must pay at least 25% of rent by program deadline.
**Indicates date signed into law.
For information on the Pulse date ranges, see https://www.census.gov/programs-surveys/household-pulse-survey/data.html. For a summary of the CARES Act and CDC eviction moratoria, see https://crsreports.congress.gov/product/pdf/IN/IN11516. For information on California’s eviction moratoria and COVID-19 rent relief, see https://calmatters.org/housing/2021/09/california-eviction-moratorium-rent-relief/ and https://housing.ca.gov/tenant/protection_guidelines.html.
Footnotes
Tabulated from the combined data extract of the 2019 SCF, available at the Berkeley Survey Data Archive: https://sda.berkeley.edu/sdaweb/analysis/?dataset=scfcomb. Savings are defined as the sum of savings accounts, certificates of deposit, money market accounts, and U.S. savings bonds.
Most research on eviction from the tenant perspective emphasizes the role of tenant race and gender, and does not look as frequently at nonpayment’s role in leading to eviction. Desmond (2012) and Desmond and Gershenson (2017) can assess how frequently tenants summoned to court for eviction lawsuits have been accused of nonpayment (the vast majority of the time) but cannot determine what share of tenants accused of nonpayment are summoned to court or ultimately evicted. A small body of research (e.g., Brisson & Covert, 2015) does examine nonpayment in subsidized housing. The applicability of such research to the broader rental market is limited, however, because subsidized housing is both a small fraction of the rental stock and strikingly different from the rest of it. Subsidized units, particularly those built with Low-Income Housing Tax Credits (LIHTC), tend to be high quality relative to both rent charged and tenant ability to pay. As such, LIHTC tenants who find themselves short of money may forgo other expenses before choosing not to pay their rent. Even when subsidized tenants do not pay, their units often have mission-driven landlords who try to avoid evicting tenants (see Preston & Reina, 2021 for a discussion). In lower quality market-rate units, both tenants and landlords probably face different incentives.
Much nonpayment, even outside housing, is strategic. Yannelis (2020) examines the strategic aspects of student loan default. Gintis (2000) discusses more generally how easily market exchanges can become cooperation problems characterized by strategic behavior.
See https://www.census.gov/programs-surveys/rhfs.html. Debt-to-equity ratios are listed as “Not Applicable” roughly 60% of the time.
Some evidence does suggest that landlords viewed the market as softening (Burinskiy & Green, n.d.; Painter, 2020). The Princeton Eviction Lab (Haas et al., 2021) reports that even after the end of the Centers for Disease Control (CDC) eviction moratorium, evictions remain well below their pre-COVID trend. Reina and Goldstein (2021) surveyed landlords in Los Angeles who had a tenant apply for rental assistance programs. The share with over 80% of their portfolio behind went from 1% in 2019 to 7% during the pandemic, and all respondents reported not just more nonpayment but also more trouble filling vacancies. This survey, however, selects for buildings with distressed tenants.
Normally this concern would apply most to Black or Latino tenants, but during COVID-19 anti-Asian sentiment appeared to rise (Associated Press, 2021), raising the possibility that landlords would discriminate against Asian American tenants.
For example, the CARES Act imposed an eviction moratorium on properties with federally backed mortgages. The Atlanta Federal Reserve estimated that this moratorium covered between 28 and 46% of the nation’s tenants—the wide range of the estimate is a result of limited data on who owns rental housing (Federal Reserve Bank of Atlanta, 2020). The CDC later imposed a broader federal eviction moratorium. In California, the court system said it would not hear evictions during the crisis, and many localities imposed moratoria. There are few evaluations of these measures, but see, for example, An et al. (2021); Jowers et al. (2021) and Michener (2022).
The NMHC sample is not entirely professionally managed, so the 11.7 million units it covers are closer to 25% of the nation’s rental housing stock. See https://www.nmhc.org/research-insight/nmhc-rent-payment-tracker/.
The 2019 AHS public use file does not include responses to the rent payment or eviction questions.
Subsequent Pulse waves included household-level weights in their public use files. All our analyses of Pulse data use person-weights, and are tested for robustness using replicate weights.
The employment question includes follow-ups that allow us to remove retired people, those voluntarily not working, and those not working but still being paid, leaving us with a measure of involuntarily unpaid unemployment. The Pulse also asked tenants about their confidence in their ability to pay the next month’s rent. We examine that question as a robustness check but do not report its results here.
It is also unclear how respondents interpreted the question. The first Pulse was administered the week of April 23, 2020. A respondent in that week might understand the phrase “last month” to mean March 2020, and answer accordingly, but could also understand the phrase “last month’s rent” to mean “the most recent payment you had to make” and respond about April 2020. Given that shelter-in-place orders did not start until March 13, the latter interpretation might be more sensible. But if respondents do interpret “last month” as “most recent,” the likelihood of reporting late rent might vary with the week the survey is taken.
A further consideration is how to classify deferred rent. On the one hand, deferral is evidence of difficulty paying. Presumably tenants do not seek deferral if they think they can pay. On the other hand, because deferral is granted by the landlord, it can prevent or at least delay the worst consequences of nonpayment. As it turns out, deferral was much less common than late payment, so our analysis focuses on late payment. In the first week of the Pulse, for example, about 6% of tenants had their rent deferred. Over the next 11 weeks of Wave 1 the proportion of tenants deferring was usually between 1% and 3%.
Conceivably, the Wave 1 Pulse could examine this question, because it had a quasi-panel composition: if a household was interviewed one week, the Census Bureau tried to reinterview that same household twice more (this was done mostly to get a valid sample each week). Most of these reinterviews occur in the same month, however, so the Pulse cannot say whether some households are falling behind on multiple months’ rent. Reinterviews, moreover, account for a relatively small share of total Pulse respondents. In the 12 weeks of LA Pulse data, for example, 64% of respondents answered once, 20% twice, and 16% three times. Subsequent Pulse waves, which departed from the weekly format, also abandoned the quasi-panel composition.
The second wave also asked people who were behind if they thought eviction was likely. We analyzed this question, but because it was prospective and based only on tenant perception, we report on it only in footnotes. Our own survey asks about actual landlord action.
Our analysis tested the effect of including and omitting the 43 respondents who completed in August, and the results did not change.
Although there is a risk of recall bias asking in July about events in May, studies of error in retrospective surveys suggest both that errors are smaller within three months (which may be why the AHS also asks about three months of rent) and that large, unusual or emotionally powerful events—like missing rent—are less likely to result in errors. Recall mistakes are more likely with questions about, for instance, what someone usually ate for breakfast three months ago (Ayhan & Isiksal, 2004; Kjellsson et al., 2014; Van Giezen et al., 2005).
Note that some tenants may not know, or may be mistaken about, who their landlord is, either because they mistake a building manager for a landlord, or because a small building they consider a “mom-and-pop” is actually part of a larger consortium of rental properties.
20. However, respondents with missing incomes were not more likely to report problems paying rent.
The state of California authorized a rent relief program in January 2021, but the program was slow to get off the ground, and most of our respondents did not access it. Some of our Wave 2 respondents accessed a City of LA rental relief program, but this program was targeted specifically at tenants struggling to pay rent, and the resulting endogeneity yields a strong correlation between delinquency and assistance.
The figure uses a combined metric of low confidence in the next month and being behind currently because that is how the Census reports renter distress in its aggregate data. As mentioned, the first 12 weeks of Pulse surveys used a different question. We exclude these early weeks to keep the graphic consistent.
The discrepancy between the Pulse Wave 1 and LA County Renter Survey Wave 1 may owe to both the different geographies (MSA vs County) and more important the different time period. The Pulse shows that 10% of renters were late on the current month’s rent. The County Renter’s Survey shows that 22% of renters had trouble paying in at least one of the previous three months—a more inclusive criterion likely to yield a larger proportion.
Although not shown in our tables, the Pulse reveals large proportions of renters relying on such unconventional spending sources to meet general expenses (e.g., 38% of Pulse Wave 1 respondents reported relying more on outside income to meet basic needs).
We are unsure why substantially more respondents in Wave 2 indicated using credit cards pre-COVID, compared to Wave 1. By any measure, however, credit card use jumped during COVID.
As a comparison: Reina et al. (2021) surveyed over 25,000 renters applying for LA City and County rental assistance programs. Between 50% and 55% of these respondents reported taking on more debt to manage expenses (not necessarily for rent alone), whereas 14% used a credit card and 10% reported using a payday loan. These rates are not generalizable to the broader renter population because they are surveys of those specifically seeking rental assistance, but they are roughly consistent with our results.
For both waves, we also ran models where the dependent variable was the tenant’s confidence in their ability to make the next month’s rent, and the findings were consistent with what we report in the text. For Wave 2, we also ran models with the dependent variable being an indicator that the renter fears eviction. Those findings are also consistent. Fears about the future share many of the same associations as troubles in the present. Given space constraints and the fact that these variables are more speculative, we did not report these results, but they are available on request.
Two changes between Waves 1 and 2 are notable, however, with respect to income and race. In Wave 1, the second income quartile is actually more likely to be behind on rent than the first. By Wave 2, the second income quartile was no longer any more likely to be behind on rent than any of the other income categories. In Wave 1, Asians are less likely to be late on rent than any of the other three racial and ethnic groups, but in Wave 2 they had the highest odds of any racial or ethnic group.
As mentioned above, because neither enhanced UI nor stimulus were available early in the pandemic, regressions that examine them have smaller sample sizes.
The Pulse UI question changed in Wave 2; rather than asking all respondents if they received UI, the survey first asked if people had applied for it. We control for both: The results show that lost work strongly predicts applying for UI, but that UI, controlling for application, does not significantly predict late payment.
We ask about lost work or income in slightly different ways than the Pulse does. See Appendix Table 3 for a comparison of survey questions.
A small share of respondents did not know how to classify their landlords. In other models we explicitly control for this response and it does not change our results.
The correlation might also reflect reduced landlord income translating directly into a reduced ability to maintain the building.
Specifically, if we combine the two metrics, the coefficients retain their size but back rent loses statistical significance. Note too that if we do not log back rent, the coefficient remains statistically significant, but shrinks slightly.
We lack the data to form any firm opinion for this result, but if landlords believe higher-income tenants are strategically withholding some rent in the hope rental debt gets canceled, they may be more likely to retaliate.
Disclosure Statement
No potential conflict of interest was reported by the authors.
References
- An X, Gabriel SA, & Tzur-Ilan N (2021). More than shelter: The effects of rental eviction moratoria on household well-being. SSRN Scholarly Paper ID 3801217. Social Science Research Network. 10.2139/ssrn.3801217. [DOI] [Google Scholar]
- Associated Press. (2021). More than 9,000 Anti-Asian incidents have been reported since the pandemic began. NPR News, August 12. [Google Scholar]
- Ayhan O, & Isiksal S (2004). Memory recall errors in retrospective surveys: A reverse record check study. Quality & Quantity, 38(5), 475–493. [Google Scholar]
- Bell A, Hedin TJ, & Mannino P (2021). Roozbeh Moghadam, Geoffrey Schnorr and Till von Wachter. Disparities in access to unemployment insurance during the COVID-19 pandemic: Lessons from U.S. and California Claims Data. California Policy Lab, November. [Google Scholar]
- Brisson D, & Covert J (2015). Housing instability risk among subsidized housing recipients: Characteristics associated with late or nonpayment of rent. Social Work Research, 39 (2), 119–128. 10.1093/swr/svv009 [DOI] [Google Scholar]
- Burinskiy E, & Green RK (n.d.). USC Lusk Center Casden Report. May 17, 2021.
- Buschbom SL, Kau JB, Keenan DC, & Lyubimov C (2018). Delinquencies, default and borrowers’ strategic behavior toward the modification of commercial mortgages. Real Estate Economics, 49(3), 936–967. 10.1111/1540-6229.12237 [DOI] [Google Scholar]
- Corbae D, & Quintin E (2015). Leverage and the foreclosure crisis. Journal of Political Economy, 123 (1), 1–65. 10.1086/677349 [DOI] [Google Scholar]
- Cunningham C, Gerardi K, & Shen L (2021). The double trigger for mortgage default: Evidence from the Fracking Boom. Management Science, 67(6), 3943–3964. 10.1287/mnsc.2020.3647 [DOI] [Google Scholar]
- Decker N (2021). The uneven impact of the pandemic on the tenants and owners of small rental properties.”UC Berkeley Terner Center for Housing Innovation, July. [Google Scholar]
- Desmond M (2012). Eviction and the reproduction of urban poverty. American Journal of Sociology, 118 (1), 88–133. 10.1086/666082 [DOI] [Google Scholar]
- Desmond M, & Gershenson C (2017). Who gets evicted? Assessing individual, neighborhood, and network factors. Social Science Research, 62, 362–377. 10.1016/j.ssresearch.2016.08.017 [DOI] [PubMed] [Google Scholar]
- Dillon L (2020). Despite protections, landlords seek to evict tenants in black and latino areas of South LA. Los Angeles Times, June 18. [Google Scholar]
- Duong B (2020). What you need to know about the eviction crisis. Shelterforce (Blog), December 18, 2020. https://shelterforce.org/2020/12/18/32248_eviction_crisis/. [Google Scholar]
- Federal Reserve Bank of Atlanta. (2020). Housing policy impact: Federal eviction protection coverage and the need for better data. https://www.frbatlanta.org/community-development/publications/partners-update/2020/covid-19-publications/200616-housing-policy-impact-federal-eviction-protection-coverage-and-the-need-for-better-data.
- Garboden PM, & Rosen E (2019). Serial filing: How landlords use the threat of eviction. City & Community, 18 (2), 638–661. 10.1111/cico.12387 [DOI] [Google Scholar]
- Gintis H (2000). Game theory evolving: A problem-centered introduction to modeling strategic behavior. Princeton University Press. [Google Scholar]
- Haas J, Rangel J, Garnham JP, & Hepburn P (2021). Preliminary analysis: Eviction filing trends after the CDC moratorium expiration. Princeton University Eviction Lab. https://evictionlab.org/updates/research/eviction-filing-trends-after-cdc-moratorium/. [Google Scholar]
- Hutson B (2020). As moratoriums start to lift, preparing for an eviction wave. Shelterforce (blog). June 25, 2020. https://shelterforce.org/2020/06/25/as-moratoriums-start-to-lift-preparing-for-an-eviction-wave/. [Google Scholar]
- Jowers K, Timmins C, Bhavsar N, Bhavsar Q, & Marshall J (2021). Housing precarity and the COVID-19 pandemic. NBER Working Paper 28394, January. [Google Scholar]
- Kjellsson G, Clarke P, & Gerdtham U-G (2014). Forgetting to remember or remembering to forget: A study of the recall period length in health care survey questions. Journal of Health Economics, 35(34–36), 34–46. 10.1016/j.jhealeco.2014.01.007 [DOI] [PubMed] [Google Scholar]
- Laponsie M (2020). Second stimulus package: What’s in it for you? U.S. News and World Report. December 21. [Google Scholar]
- Lens MC, Nelson K, Gromis A, & Kuai Y (2020). The neighborhood context of eviction in Southern California. City & Community, 19 (4), 912–932. 10.1111/cico.12487 [DOI] [Google Scholar]
- Lowrey A (2018). Give people money: How a universal basic income would end poverty, revolutionize work, and remake the world. Crown. [Google Scholar]
- Loya J (2022). Racial stratification among latinos in the mortgage market. Race and Social Problems, 14 (1), 39–52. 10.1007/s12552-021-09326-3 [DOI] [Google Scholar]
- Luhby T (2020). Extra $600 unemployment benefits will start flowing as early as this week. CNN, April 10. [Google Scholar]
- Michener J (2022). Race, power, and policy: Understanding state anti-eviction policies during COVID-19. Policy and Society, 2022, puac012. 10.1093/polsoc/puac012 [DOI] [Google Scholar]
- Mayer C, Morrison E, Piskorski T, & Gupta A (2014). Mortgage modification and strategic behavior: Evidence from a legal settlement with countrywide.” American Economic Review, 104 (9), 2830–2857. 10.1257/aer.104.9.2830 [DOI] [Google Scholar]
- Martinez M (2020). Landlords call for end to California eviction moratorium. KCRA News, August 5. [Google Scholar]
- NMHC Rent Payment Tracker. (2022). https://www.nmhc.org/research-insight/nmhc-rent-payment-tracker/.
- Painter G (2020). A blueprint for california renter recovery. Price Center for Social Innovation. July 9, 2020. https://socialinnovation.usc.edu/a-blueprint-for-california-renter-recovery/. [Google Scholar]
- Pinho F (2020). The federal $600 unemployment benefit ends July 31. What’s next? Los Angeles Times, June 17. [Google Scholar]
- Preston G, & Reina VJ (2021). Sheltered from eviction? A framework for understanding the relationship between subsidized housing programs and eviction. Housing Policy Debate, 31(3–5), 785–817. 10.1080/10511482.2021.1879202 [DOI] [Google Scholar]
- Reina V, Aiken C, & Goldstein S (2021). The need for rental assistance in Los Angeles City and County. The Housing Initiative at Penn, Research Brief, March. [Google Scholar]
- Reina V, & Goldstein S (2021). Ongoing challenges for rental business owners in the City of Los Angeles during the COVID-19 pandemic. The Housing Initiative at Penn, Research Brief, March. [Google Scholar]
- U.S. Census Bureau. (2014). American Housing Survey, 2013. American Housing Survey, 2013. 2014. https://www.census.gov/programs-surveys/ahs/data.html.
- U.S. Census Bureau. (2018a). American Housing Survey, 2017. American Housing Survey, 2017. 2018. https://www.census.gov/programs-surveys/ahs/data.html.
- U.S. Census Bureau. (2018b). Rental Housing Finance Survey (RHFS). The United States Census Bureau. 2018. https://www.census.gov/programs-surveys/rhfs.html. [Google Scholar]
- U.S. Census Bureau. (2019). 2019 American Community Survey, 1-year estimates. https://www.census.gov/programs-surveys/acs/technical-documentation/table-and-geography-changes/2019/1-year.html.
- van Giezen A, Arensman E, Spinhoven P, & Wolters G (2005). Consistency of memory for emotionally arousing events: A review of prospective and experimental studies. Clinical Psychology Review, 25(7), 935–953. 10.1016/j.cpr.2005.04.011 [DOI] [PubMed] [Google Scholar]
- Weill-Greenberg E (2020). As eviction cliff looms, calls to cancel rent grow. The Appeal, July 27. [Google Scholar]
- Wire S, & McGreevy P (2021). Report chronicles missteps by state unemployment agency that left millions in the lurch. Los Angeles Times. June 2. [Google Scholar]
- Yannelis C (2020). Strategic default on student loans. Chicago Booth Working Paper. https://faculty.chicagobooth.edu/-/media/faculty/constantine-yannelis/research/strategicdefault.pdf. [Google Scholar]