Abstract
Optical coherence tomography (OCT), owing to its non-invasive nature, has demonstrated tremendous potential in clinical practice and has become a prevalent diagnostic method. Nevertheless, the inherent speckle noise and low sampling rate in OCT imaging often limit the quality of OCT images. In this paper, we propose a lightweight Transformer to efficiently reconstruct high-quality images from noisy and low-resolution OCT images acquired by short scans. Our method, PSCAT, parallelly employs spatial window self-attention and channel attention in the Transformer block to aggregate features from both spatial and channel dimensions. It explores the potential of the Transformer in denoising and super-resolution for OCT, reducing computational costs and enhancing the speed of image processing. To effectively assist in restoring high-frequency details, we introduce a hybrid loss function in both spatial and frequency domains. Extensive experiments demonstrate that our PSCAT has fewer network parameters and lower computational costs compared to state-of-the-art methods while delivering a competitive performance both qualitatively and quantitatively.
1. Introduction
Optical Coherence Tomography (OCT) utilizes the interference properties of light waves to non-invasively measure optical path differences, thus obtaining high-resolution images of biological tissues [1,2]. It is widely used in medicine for observing tissue microstructure and diagnosing abnormalities including ophthalmology, cardiovascular medicine, dermatology, and more. Due to its non-invasive, high-resolution, and real-time imaging nature, OCT plays a crucial role in medical diagnostics and research. Especially in the field of ophthalmology, it is used as one of the safest and most effective tools for diagnosing various eye diseases such as retinal diseases, macular diseases, optic nerve diseases, and glaucoma. Due to the limitations of the interferometric imaging principle of OCT technology, its images are often affected by inherent speckle noise [3], decreasing the signal-to-noise ratio (SNR) of OCT images. On the other hand, to achieve a large field of view and reduce the impact of unconscious microsaccades, clinical practitioners often use downsampling methods to accelerate the acquisition speed while maintaining the same scanning frequency of the light source. However, this also reduces the acquired information, thus lowering the resolution of the OCT image. Developing appropriate methods to improve the SNR and resolution of OCT images is crucial, offering clinicians clearer images for observing retinal structure and disease characteristics.
Over the past decades, considerable efforts have been made to find a reliable method for reconstructing low signal-to-noise ratio and low-resolution (LSLR) OCT images into high signal-to-noise ratio and high-resolution (HSHR) images. Fang et al. [4] introduced an efficient sparse representation-based image reconstruction framework called SBSDI, which simultaneously performs interpolation and denoising of retinal OCT images. Trinh et al. [5] proposed a competitive example-based super-resolution (SR) method for medical images capable of enhancing resolution while being robust to heavy noise. Seelamantula et al. [6] introduced a super-resolution reconstruction method based on a parametric representation that leverages an iterated singular-value decomposition algorithm, which is named Cadzow denoiser. Abbasi et al. [7] presented a nonlocal weighted sparse representation (NWSR) method for reconstructing HSHR retinal OCT images. Most of these traditional methods require complex regularizers, resulting in high computational complexity and inflexibility. The image restoration quality is not ideal and is difficult to apply in clinical practice.
In recent years, deep learning-based algorithms have shown their overwhelming advantages in image processing, ranging from low-level tasks such as image denoising, deblurring, and SR to high-level tasks such as segmentation, detection, and recognition. A large number of deep learning-based methods are employed for speckle noise reduction and resolution enhancement in OCT images [8–12]. Huang et al. [13] proposed a generative adversarial network-based approach, SDSR-OCT, to simultaneously denoise and super-resolve OCT images. Qiu et al. [14] proposed a semi-supervised learning approach named N2NSR-OCT to generate denoised and super-resolved OCT images simultaneously using up- and down-sampling networks. Cao et al. [15] modified the existing super-resolution generative adversarial network (SR-GAN) for OCT image reconstruction to address the problem of generating a high-resolution OCT image from a low optical and low digital resolution image. Das et al. [16] proposed an unsupervised framework to perform fast and reliable SR without the requirement of aligned LR-HR pairs, using adversarial learning with cycle consistency and identity mapping priors to preserve the spatial correlation, color, and texture details. These CNN-based methods have promoted the development of OCT image denoising and super-resolution. As more extensive and deeper CNN models are developed to improve learning ability, image quality has also been greatly improved. CNN models are based on the idea of local receptive fields, which extract features by sliding convolutional kernels over the image. However, this local receptive field mechanism limits the model’s ability to perceive global information.
Recently, Transformer [17] proposed in natural language processing (NLP) has shown outstanding performance in multiple high-level vision tasks. The core of the Transformer is the self-attention mechanism, which enables the establishment of global dependencies and alleviates the limitations of CNN-based algorithms. Considering the potential of Transformer, some researchers have attempted to apply it to low-level tasks such as image denoising and super-resolution [18–21]. Despite its success and great promise, the Transformer has been investigated little in OCT denoising and super-resolution. We aim to explore the potential of the Transformer fully in simultaneous denoising and super-resolution of OCT. Specifically, we propose a lightweight parallel spatial and channel attention Transformer (PSCAT) to simultaneously denoise and super-resolve LSLR OCT images. The window-based multi-head self-attention and channel attention modules in the Transformer block aggregate features from both spatial and channel dimensions. The two attention mechanisms complement each other. Spatial attention enriches each feature map’s spatial representation, helping model channel dependencies. Channel attention provides global information between features for spatial attention, expanding the receptive field of spatial attention. Compared with the state-of-the-art methods, PSCAT has fewer network parameters and lower computational costs, making it more suitable for rapidly processing large clinical scan samples.
In summary, the key contributions of this paper are as follows:
-
•
We propose a parallel spatial and channel attention Transformer module that combines window-based multi-head self-attention and channel attention to capture spatial and channel features simultaneously, achieving inter-block feature aggregation of different dimensions.
-
•
We develop an effective lightweight Transformer network that utilizes a hybrid loss function in both spatial and frequency domains for simultaneous denoising and super-resolving OCT images in an end-to-end manner.
-
•
Extensive experimental results demonstrate that our PSCAT has achieved the SOTA results for the OCT image enhancement task compared to traditional, CNN-based, and other Transformer-based methods.
2. Method
2.1. Problem statement
The goal of the simultaneous denoising and super-resolution task for OCT images is to restore HSHR images from LSLR images. A typical OCT denoising and super-resolution model can be expressed as
| (1) |
where is an input OCT image with low SNR and resolution, is the operator for noise reduction and resolution enhancement, represents a denoised and super-resolved OCT image generated by G.
Given a set of paired LSLR and HSHR images , the model can be represented by the parameterized function , where is the vector of parameters. The parameterized vector can be computed as:
| (2) |
where is the deep learning network model represented by a parameterized vector , is the number of input images, and is the loss function used by the network.
2.2. Network architecture
2.2.1. Overall structure
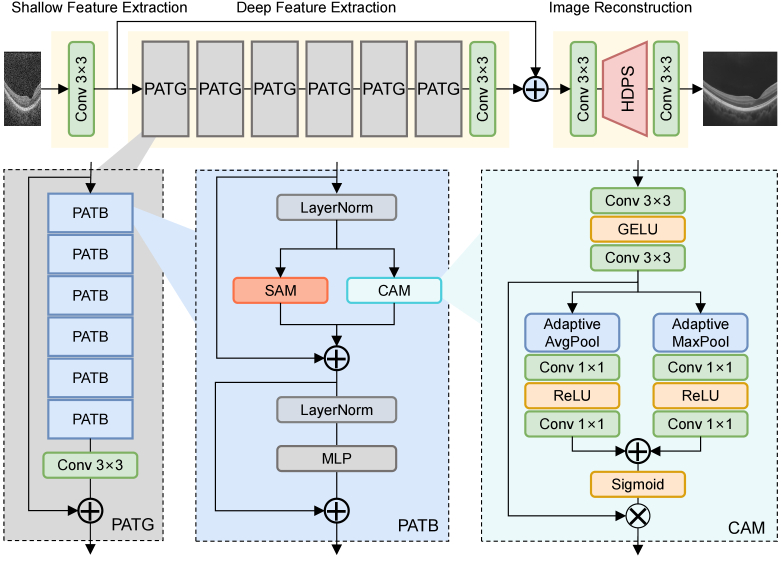
As illustrated in Fig. 1, the overall network of the proposed PSCAT comprises three parts: shallow feature extraction, deep feature extraction, and image reconstruction. This architecture design is widely used in natural image super-resolution networks [19,21–23]. Initially, given a LSLR input image , we first exploit one convolutional layer to extract the shallow feature . and denote the height and width of the input image, While and represent the channel number of the input image and intermediate feature.
Fig. 1.
The overall architecture of the proposed lightweight parallel spatial and channel attention Transformer (PSCAT) and the structure of channel attention module (CAM). : element-wise addition / multiplication.
Subsequently, the shallow feature enters the deep feature extraction module to obtain the deep feature . The deep feature extraction module is stacked by parallel attention Transformer groups (PATGs). The residual strategy is introduced here to ensure the stability of training. Each PATG contains parallel attention Transformer blocks (PATBs). Each PATB contains a spatial attention module (SAM) and a channel attention module (CAM), arranged in parallel. At the end of each PATG and deep feature extraction module, there is a convolutional layer for refining features.
Finally, the shallow feature and the deep feature are fused through global residual connections and entered into the image reconstruction module. In this module, the HSHR output image is reconstructed from the fused feature through upsampling operation horizontal direction PixelShuffle (HDPS), and convolutional layers are adopted to aggregate features before and after the upsampling operation.
2.2.2. Spatial attention module (SAM)
Attention mechanism has become one of the most widely used components in deep learning, especially in NLP and computer vision. Its core idea is to imitate human attention, focusing on the most relevant or important parts when processing a large amount of information. The self-attention mechanism reduces the dependence on external information and is better at capturing the internal correlation of data or features. ViT [24] is the first to introduce multi-head self-attention (MSA) [17] into computer vision. Swin Transformer [25] introduces the shifted windowing scheme, which increases efficiency by limiting self-attention computation to non-overlapping local windows while allowing cross-window connection. It represents a significant advancement in applying Transformer models to computer vision, combining the strengths of Transformers and CNNs to process and understand visual data efficiently.
Our SAM follows Swin Transformer’s window-based multi-head self-attention (W-MSA), reduces receptive fields, and limits self-attention computation to local windows. Given an input , we first reshape into non-overlapping local windows of the size . Then, we calculate the standard Softmax attention within each window. For a local window feature , where , the query, key and value matrices , , and are computed as follows in each head:
| (3) |
where , and are projection matrices that are shared across different windows. The Softmax attention is computed as:
| (4) |
where represents the dimension of , denotes the relative position encoding.
2.2.3. Channel attention module (CAM)
Channel attention aims to model the correlation between different channels, automatically obtain the importance of each feature channel through network learning, and finally assign different weight coefficients to each channel to enhance important features and suppress non-important features. The representative model of the channel attention mechanism is Squeeze and Excitation Networks (SENet) [26].
As shown in Fig. 1, our CAM consists of two convolutional layers with a GELU activation and a standard channel attention calculation following CBAM [27]. The channel attention in our CAM is computed as:
| (5) |
where represents the input feature map, and represent adaptive average pooling and maximum pooling operations that aggregate spatial information into the channel. is convolutional layer and is adopted between two convolutional layer, is a nonlinear activation function Sigmoid, and is an element-wise multiplication operation. and denote the intermediate features, is the output of CAM.
2.2.4. Parallel attention transformer block (PATB)
The hybrid attention mechanism can more comprehensively capture and represent the complexity of the input data, thereby improving the model’s ability to understand the data and effectively boosting the modeling ability of the Transformer. Some studies [21,23] explore introducing channel attention in Transformer to aggregate spatial and channel information. The spatial window self-attention models the fine spatial relationship between pixels, and the channel attention models the relationship between feature maps, thereby utilizing global image information.
Our PATB adopts a hybrid attention mechanism and arranges spatial and channel attention in parallel. It comprises three parts: SAM, CAM, and multilayer perceptron (MLP). The three parts are interspersed with LayerNorm (LN) and residual connections, as shown in Fig. 1. For a given input feature , the entire calculation process of PATB is as follows:
| (6) |
and represent window-based multi-head self-attention and shifted window-based multi-head self-attention. In continuous PATB, and will be used intermittently. , , and denote the intermediate features, represents the output of PATB, is a constant parameter utilized to balance SAM and CAM.
2.2.5. Horizontal direction PixelShuffle (HDPS)
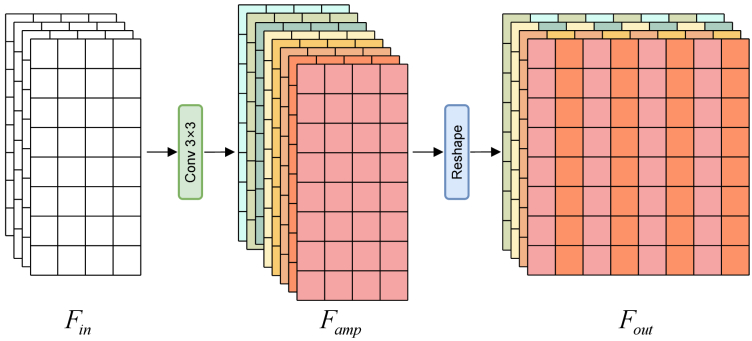
In the OCT acquisition process, a line scanning mode is typically employed, where the scanning frequency in the A-scan direction directly influences the resolution in the horizontal direction. While high-frequency A-scans can yield high-resolution images, their acquisition speed may be constrained. Unlike natural images, we use the modified PixelShuffle [28] for upsampling, namely horizontal direction PixelShuffle (HDPS). The use of HDPS can improve the collection speed in clinical applications. As shown in Fig. 2, input features is firstly processed through convolutional layers to obtain the amplified channel number features .
| (7) |
where , , and represent the height, width, and number of channels of the feature map, and is the upsampling factor. After that, is shaped to obtain output feature .
| (8) |
Fig. 2.
Horizontal direction PixelShuffle (HDPS) for OCT images.
Finally, the feature map was upsampled by r times in the horizontal direction.
2.3. Loss function
To obtain the HSHR OCT image from an LSLR input, we introduce a hybrid loss function in both spatial and frequency domains. Two items are included in our loss function: the MAE loss , and the FFT loss . The MAE loss is defined as follows:
| (9) |
where and represent the HSHR image output by the network and the real HSHR image, respectively. represents L1 distance, which is generally used in learning-based OCT denoising and resolution enhancement. MAE loss ensures that the network’s output is close to the ground truth, but using only the pixel-level loss function cannot effectively help restore high-frequency details. Therefore, we add frequency constraints to regularize network training:
| (10) |
represents fast Fourier transform.
The overall loss function of our proposed PSCAT is as follows:
| (11) |
where is a constant parameter utilized to balance the two terms. Typically, is set to a small value close to 0. For image denoising and enhancement tasks, the MAE loss is the main component for ensuring model convergence, while frequency domain constraints are solely employed for the further protection of structural details.
3. Experiments and results
3.1. Data preparation
The dataset used for training and validation in this work is PKU37 [12], which collected data from 37 healthy eyes of 37 subjects using a customized Spectral Domain OCT (SDOCT) system. The center wavelength and full width at half the maximum bandwidth of the light source are 845 nm and 45 nm, respectively. The lateral and axial resolutions are 16 µm and 6 µm, respectively. More details about obtaining PKU37 can be found in [9].
Two publicly available datasets were used as test sets, namely DUKE17 [29] and DUKE28 [4]. DUKE17 was acquired from 17 eyes from 17 subjects, 10 normal subjects, and 7 with non-neovascular age-related macular degeneration (AMD) in the A2A SDOCT study. Volumetric scans were acquired using SDOCT imaging systems from Bioptigen, Inc. (Research Triangle Park, NC). DUKE28 was obtained from 28 eyes of 28 subjects enrolled in the Age-Related Eye Disease Study 2 (AREDS2) Ancillary SDOCT (A2A SDOCT) with and without non-neovascular AMD by 840 nm wavelength SDOCT imaging systems from Bioptigen, Inc. (Durham, NC, USA).
The division of the training, validation, and test set is shown in Table 1. Referring to the original article of PKU37 dataset [12], we selected the images from 20 subjects in PKU37 for training (namely PKU37-train) and used the remaining 17 subjects for validation (namely PKU37-val). DUKE17 and DUKE28 were used for cross-domain tests to verify the generalization ability of the deep learning-based methods. PKU37-val was used for hyperparameter adjustment of all deep learning-based methods.
Table 1. Training, validation, and test datasets used in this work.
| Dataset | Subject | Clean image | Noisy image | |
|---|---|---|---|---|
| training | PKU37-train | 20 | 20 | 1000 |
| validation | PKU37-val | 17 | 17 | 734 |
| test | DUKE17 | 17 | 17 | 17 |
| DUKE28 | 28 | 28 | 28 |
3.2. Implementation details
We implemented the proposed PSCAT using the PyTorch [30] toolbox, and all the experiments were conducted on an Ubuntu 20.04 operation system and an NVIDIA Geforce RTX 3090 GPU. In the training stage, the Adam [31] optimizer was adopted with and , batch size was set to 4, and the learning rate was set to 2e-4 for all 2e5 iterations. We keep the depth and width of the PSCAT structure the same as SwinIR [19]; the numbers of PATG and PATB are both set to 6. The channel number of the hidden layers in PATB is set to 96. The attention head number and window size are set to 6 and 16 for (S)W-MSA. The weight and were set as 0.01 and 0.05 through a lot of searches.
To better evaluate the performance of the proposed PSCAT, twelve methods were considered for comparison. These methods can be roughly divided into three categories: three typical traditional methods commonly used for OCT denoising, Wavelet [32], NLM [33], and BM3D [34]; five excellent CNN-based methods, EDSR [35], RCAN [22], HAN [36], IMDN [37] and SAFMN [38]; four innovative Transformer-based methods, SwinIR [19], HAT [21], DAT [23], and DLGSANet [39]. Among them, IMDN, SAFMN, and DLGSANet are lightweight models. For traditional methods, we combine them with bicubic interpolation and optimize their parameters. For the deep learning-based method, we modified the upsampling part of the published code provided by their authors and used the same dataset partitioning as in our PSCAT.
For quantitative comparison, we used three metrics, including peak signal-to-noise ratio (PSNR), structural similarity index (SSIM), and root mean square error (RMSE). PSNR represents the ratio of the maximum possible power of a signal to the destructive noise power that affects its representation accuracy. SSIM measures image similarity from three aspects: brightness, contrast, and structure. RMSE reflects the pixel-by-pixel difference between the generated image and the ground truth.
3.3. Performance comparison
To quantitatively evaluate the simultaneous denoising and resolution enhancement performance of the proposed method, Table 2 summarizes two model evaluation metrics (Params, FLOPs) and three image quality evaluation metrics (PSNR, SSIM, RMSE) results (mean standard deviation) of all the methods on PKU37-val. Our PSCAT is significantly superior to other methods in all image quality evaluation metrics, regardless of whether the scale factor is 2 or 4. Particularly, when the scale factor is 4, compared to conventional CNN-based model EDSR and Transformer-based model SwinIR, the proposed PSCAT achieves gains of 0.08dB and 0.12dB in PSNR, while the network parameters and FLOPs of EDSR and SwinIR methods are 10 times and 3 times higher than those of PSCAT, respectively. In models based on Transformer, whether the scale factor is 2 or 4, our PSCAT has the fastest inference time. Especially when the scale factor is 4, the inference time of PSCAT is about 1/3 of SwinIR and HAT, and 1/5 of DAT. In comparison among lightweight models, DLGSANet has slightly more parameters than PSCAT, whereas IMDN and SAFMN have fewer. However, all three models significantly underperform relative to PSCAT. All comparisons presented in Table 2 show that PSCAT is lightweight and much more efficient than the state-of-the-art methods.
Table 2. Quantitative evaluation of the proposed PSCAT against Non-learning/CNN-based/Transformer-based methods on PKU37-val. #Params means the number of network parameters. #FLOPs denotes the number of the FLOPs, which are calculated on images with a resolution of 128 128 pixels. The best and second best results are marked in bold and underlined, respectively.
| Type | Method | Scale | Inference time | #Params [M] | #FLOPs [G] | PSNR | SSIM | RMSE |
|---|---|---|---|---|---|---|---|---|
| Base | Bicubic | ×2 | 0.011s | - | - | 20.69±0.58 | 0.2572±0.0195 | 23.61±1.74 |
|
| ||||||||
| Non-learning | Wavelet+Bicubic | ×2 | 0.044s | - | - | 24.92±0.93 | 0.4058±0.0608 | 14.56±1.40 |
| NLM+Bicubic | ×2 | 0.978s | - | - | 27.38±1.15 | 0.6758±0.0591 | 10.99±1.34 | |
| BM3D+Bicubic | ×2 | 2.715s | - | - | 29.23±0.93 | 0.7774±0.0414 | 8.86±0.90 | |
|
| ||||||||
| CNN-based | EDSR | ×2 | 0.880s | 39.55 | 648.36 | 32.15±0.80 | 0.8831±0.0142 | 6.32±0.60 |
| RCAN | ×2 | 0.559s | 15.37 | 250.80 | 31.89±0.76 | 0.8790±0.0137 | 6.51±0.58 | |
| HAN | ×2 | 0.598s | 15.85 | 258.94 | 32.12±0.80 | 0.8824±0.0142 | 6.34±0.60 | |
| IMDN | ×2 | 0.460s | 0.69 | 11.3 | 31.93±0.80 | 0.8784±0.0141 | 6.48±0.60 | |
| SAFMN | ×2 | 0.316s | 0.23 | 3.68 | 32.05±0.81 | 0.8820±0.0144 | 6.39±0.61 | |
|
| ||||||||
| Transformer-based | SwinIR | ×2 | 2.037s | 11.68 | 191.01 | 32.13±0.79 | 0.8829±0.0140 | 6.34±0.59 |
| HAT | ×2 | 2.854s | 20.55 | 332.82 | 32.14±0.80 | 0.8833±0.0142 | 6.33±0.60 | |
| DAT | ×2 | 5.183s | 14.58 | 235.34 | 32.04±0.78 | 0.8824±0.0140 | 6.40±0.59 | |
| DLGSANet | ×2 | 1.527s | 4.85 | 79.37 | 32.05±0.78 | 0.8821±0.0141 | 6.40±0.59 | |
| PSCAT (ours) | ×2 | 1.356s | 3.91 | 61.24 | 32.18±0.80 | 0.8841±0.0140 | 6.30±0.60 | |
|
| ||||||||
| Base | Bicubic | ×4 | 0.016s | - | - | 20.53±0.57 | 0.2441±0.0172 | 24.05±1.73 |
|
| ||||||||
| Non-learning | Wavelet+Bicubic | ×4 | 0.022s | - | - | 24.56±0.91 | 0.3893±0.0602 | 15.17±1.44 |
| NLM+Bicubic | ×4 | 0.478s | - | - | 26.75±1.21 | 0.6555±0.0613 | 11.83±1.50 | |
| BM3D+Bicubic | ×4 | 1.617s | - | - | 28.62±0.99 | 0.7671±0.0427 | 9.51±1.03 | |
|
| ||||||||
| CNN-based | EDSR | ×4 | 0.651s | 40.73 | 687.26 | 31.40±0.80 | 0.8695±0.0149 | 6.89±0.64 |
| RCAN | ×4 | 0.396s | 15.44 | 253.28 | 31.28±0.74 | 0.8683±0.0141 | 6.99±0.59 | |
| HAN | ×4 | 0.425s | 15.92 | 261.42 | 31.37±0.81 | 0.8681±0.0152 | 6.92±0.64 | |
| IMDN | x4 | 0.377s | 0.69 | 11.35 | 31.20±0.78 | 0.8636±0.0157 | 7.06±0.63 | |
| SAFMN | x4 | 0.298s | 0.23 | 3.71 | 31.19±0.85 | 0.8656±0.0159 | 7.07±0.68 | |
|
| ||||||||
| Transformer-based | SwinIR | ×4 | 1.789s | 11.75 | 193.49 | 31.36±0.81 | 0.8689±0.0153 | 6.92±0.64 |
| HAT | ×4 | 1.869s | 20.62 | 335.30 | 31.37±0.82 | 0.8699±0.0151 | 6.92±0.65 | |
| DAT | ×4 | 3.337s | 14.65 | 237.82 | 31.36±0.80 | 0.8695±0.0151 | 6.93±0.63 | |
| DLGSANet | x4 | 0.826s | 4.73 | 77.41 | 31.08±0.84 | 0.8647±0.0152 | 7.15±0.69 | |
| PSCAT (ours) | ×4 | 0.688s | 3.98 | 63.72 | 31.48±0.78 | 0.8712±0.0151 | 6.83±0.61 | |
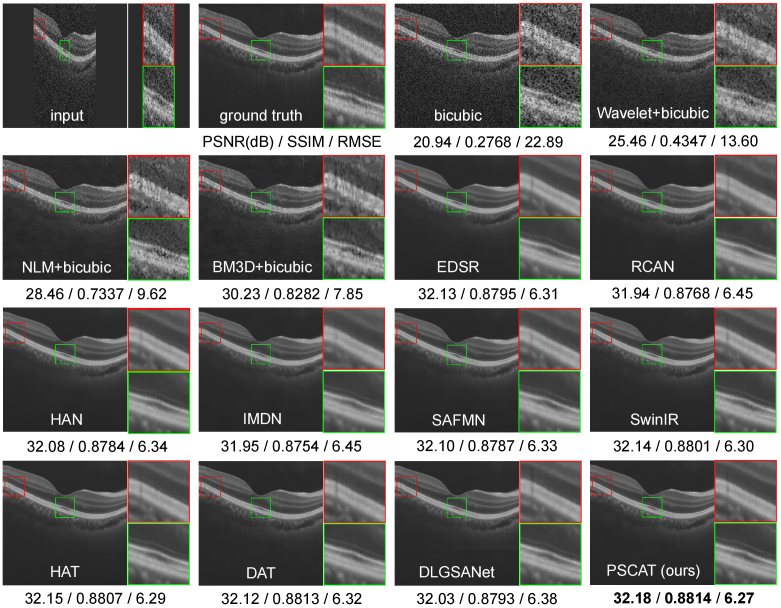
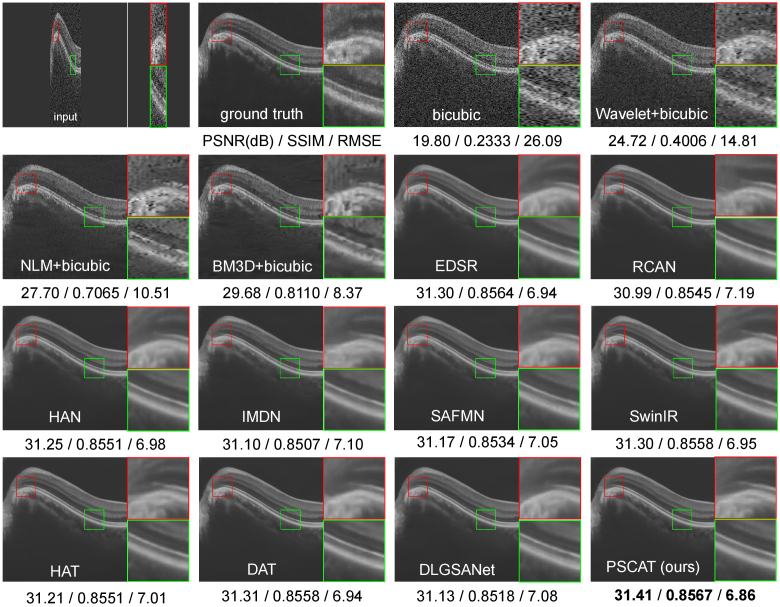
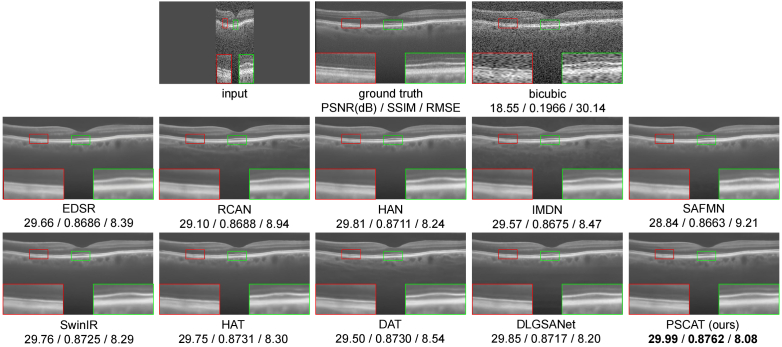
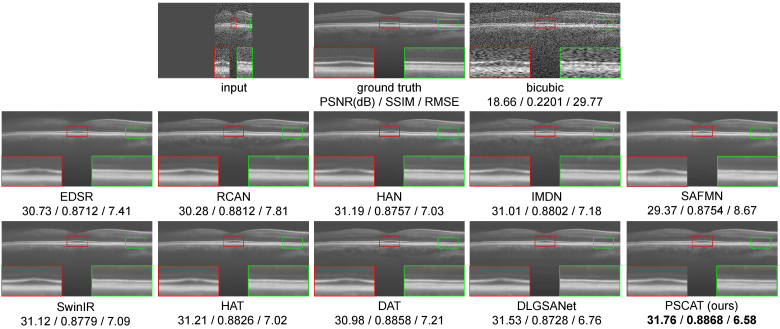
To validate the visual effects of the proposed method, two representative OCT images were selected from PKU37-val and presented in Figs. 3 and 4. Two ROIs were chosen and magnified for better visualization. It is easy to notice that the results of the deep learning methods are obviously better than traditional methods in both speckle reduction and detail preservation. The results of traditional methods (Wavelet+Bicubic, NLM+Bicubic, BM3D+Bicubic) contain a large amount of noise, and NLM+Bicubic even introduces some streak artifacts. All deep learning methods appear to remove noise while enhancing resolution. Our lightweight model PSCAT matches the visual quality of leading methods like SwinIR, HAT, and DAT with only about 1/5 to 1/3 of their parameters, while surpassing all in PSNR, SSIM, and RMSE metrics.
Fig. 3.
Performance comparison of different methods on PKU37-val of 2 SR.
Fig. 4.
Performance comparison of different methods on PKU37-val of 4 SR.
3.4. Generalization comparison
Due to the inconsistencies in OCT acquisition devices, objects, protocols, and other factors used in clinical practice, there is a domain shift problem between different datasets. It is necessary to study the generalization performance of well-trained OCT simultaneous denoising and super-resolution networks. Therefore, we conducted cross-domain testing on two datasets, DUKE17 and DUKE28, using various deep learning networks trained on PKU37-train.
3 presents the quantitative results of all deep learning methods on DUKE17 and DUKE28. The proposed PSCAT achieves the optimal performance on the DUKE17 dataset with a scale factor of 4 and on the DUKE28 dataset with a scale factor of either 2 or 4. When the scale factor is 2 on the DUKE17 dataset, the SSIM of PSCAT is the best, with PSNR and RMSE being second best and closely matching the optimal results. It is evident that, regardless of whether the scale factor is 2 or 4, the SSIM of PSCAT consistently surpasses that of HAT, thereby confirming our method’s superiority in retaining structural details. Furthermore, considering the Params and FLOPs data presented in Table 2, our model achieved slightly better generalization performance than HAT while consuming only a fifth of the computational costs.
Table 3. Quantitative comparison of cross-domain test with different deep learning-based methods on DUKE17 and DUKE28. The best and second best results are marked in bold and underlined, respectively.
| Method | Scale | DUKE17 | DUKE28 | ||||
|---|---|---|---|---|---|---|---|
| PSNR | SSIM | RMSE | PSNR | SSIM | RMSE | ||
| Bicubic | ×2 | 18.40±0.41 | 0.1824±0.0136 | 30.70±1.45 | 18.56±0.47 | 0.2066±0.0314 | 30.16±1.65 |
| EDSR | ×2 | 27.80±1.79 | 0.8446±0.0303 | 10.60±2.26 | 29.23±2.40 | 0.8538±0.0277 | 9.17±2.89 |
| RCAN | ×2 | 26.70±1.18 | 0.8439±0.0280 | 11.89±1.62 | 28.43±2.18 | 0.8555±0.0289 | 9.98±2.84 |
| HAN | ×2 | 27.85±1.85 | 0.8458±0.0316 | 10.55±2.33 | 29.30±2.47 | 0.8548±0.0284 | 9.12±2.96 |
| IMDN | x2 | 27.45±1.74 | 0.8385±0.0312 | 11.02±2.23 | 29.01±2.38 | 0.8557±0.0320 | 9.40±2.94 |
| SAFMN | x2 | 27.34±1.60 | 0.8410±0.0307 | 11.13±2.12 | 28.64±2.27 | 0.8515±0.0283 | 9.78±2.95 |
| SwinIR | ×2 | 27.87±1.83 | 0.8462±0.0310 | 10.53±2.32 | 29.35±2.49 | 0.8560±0.0288 | 9.07±2.97 |
| HAT | ×2 | 27.99±1.89 | 0.8508±0.0316 | 10.40±2.36 | 29.53±2.61 | 0.8605±0.0323 | 8.93±3.07 |
| DAT | ×2 | 27.12±1.47 | 0.8468±0.0315 | 11.38±1.97 | 28.66±2.29 | 0.8589±0.0325 | 9.77±2.97 |
| DLGSANet | x2 | 27.64±1.74 | 0.8413±0.0300 | 10.78±2.24 | 28.99±2.27 | 0.8516±0.0274 | 9.38±2.78 |
| PSCAT (ours) | ×2 | 27.99±1.96 | 0.8510±0.0325 | 10.42±2.44 | 29.59±2.64 | 0.8626±0.0334 | 8.88±3.10 |
|
| |||||||
| Bicubic | ×4 | 18.37±0.40 | 0.1877±0.0143 | 30.78±1.42 | 18.50±0.45 | 0.2059±0.0265 | 30.34±1.59 |
| EDSR | ×4 | 27.74±1.74 | 0.8424±0.0296 | 10.66±2.21 | 29.02±2.23 | 0.8489±0.0242 | 9.35±2.73 |
| RCAN | ×4 | 27.23±1.54 | 0.8424±0.0308 | 11.26±2.04 | 28.66±2.23 | 0.8533±0.0290 | 9.74±2.85 |
| HAN | ×4 | 27.81±1.83 | 0.8436±0.0311 | 10.60±2.31 | 29.18±2.37 | 0.8515±0.0258 | 9.22±2.88 |
| IMDN | x4 | 27.69±1.79 | 0.8417±0.0309 | 10.74±2.26 | 29.15±2.38 | 0.8527±0.0284 | 9.26±2.93 |
| SAFMN | x4 | 27.41±1.66 | 0.8408±0.0308 | 11.06±2.19 | 28.39±2.15 | 0.8479±0.0242 | 10.02±2.86 |
| SwinIR | ×4 | 27.79±1.78 | 0.8453±0.0300 | 10.62±2.26 | 29.16±2.36 | 0.8528±0.0257 | 9.24±2.89 |
| HAT | ×4 | 27.83±1.78 | 0.8477±0.0301 | 10.56±2.24 | 29.16±2.44 | 0.8544±0.0276 | 9.26±3.01 |
| DAT | ×4 | 27.65±1.69 | 0.8473±0.0313 | 10.76±2.17 | 28.98±2.38 | 0.8559±0.0308 | 9.44±2.99 |
| DLGSANet | x4 | 27.87±1.96 | 0.8434±0.0307 | 10.56±2.47 | 29.30±2.55 | 0.8527±0.0286 | 9.15±3.07 |
| PSCAT (ours) | ×4 | 27.96±1.91 | 0.8498±0.0312 | 10.44±2.39 | 29.39±2.51 | 0.8582±0.0301 | 9.04±2.98 |
To compare the simultaneous denoising and super-resolution results of different methods on the cross-domain test datasets, we selected one representative image from each dataset for display in Figs. 5 and 6. It can be seen that all deep learning methods exhibit varying degrees of denoising effects while improving resolution. Consistent with the denoising performance evaluation results on PKU37-val, the proposed PSCAT is significantly superior to other methods. The qualitative and quantitative evaluation results indicate that the proposed lightweight model PSCAT has superior generalization ability compared to all reference methods.
Fig. 5.
Performance comparison of different methods on DUKE17 of 4 SR.
Fig. 6.
Performance comparison of different methods on DUKE28 of 4 SR.
4. Discussion
4.1. Ablation studies
4.1.1. Effectiveness of CAM
We conduct experiments to inspect the effectiveness of the proposed CAM. The quantitative performance reported on the PKU37-val dataset for 2 SR is shown in Table 4. Where dim is the channel number of the hidden layers in PATB. When dim=96 or 144, the PSNR of parallel CAM is higher. When dim=180, the PSNR of the serial CAM is higher. So, parallel CAM is more suitable for our lightweight network. From Table 4, it can be observed that, contrary to our usual intuition, the baseline model without CAM experiences a decrease in PSNR as dim increases. We believe that this is due to overfitting of the model caused by an increase in the number of parameters.
Table 4. Ablation study on the proposed CAM.
| Structure | dim=96 | dim=144 | dim=180 | |||
|---|---|---|---|---|---|---|
| #Params[M] | PSNR[dB] | #Params[M] | PSNR[dB] | #Params[M] | PSNR[dB] | |
| Baseline (No CAM) | 3.62 | 32.1760 | 7.71 | 32.1496 | 11.84 | 32.1435 |
| Serial CAM | 3.91 | 32.1405 | 8.34 | 32.1334 | 18.93 | 32.1699 |
| Parallel CAM | 3.91 | 32.1784 | 8.34 | 32.1603 | 18.93 | 32.1443 |
4.1.2. Effects of different dim values
We further investigated the performance impact of different dim values on the baseline model without CAM, and the results are shown in Fig. 7. It is evident that, regardless of the scale factor being 2 or 4, once the dim value exceeds 96, there is a downward trend in PSNR as the dim value and the number of model parameters increase. This suggests that in our specific OCT image denoising and resolution enhancement tasks, overfitting does occur as the number of parameters increases, leading to a decline in model performance. This is also why our lightweight Transformer can outperform models with large parameter counts.
Fig. 7.
Effects of different dim values.
4.1.3. Effects of different designs of CAM
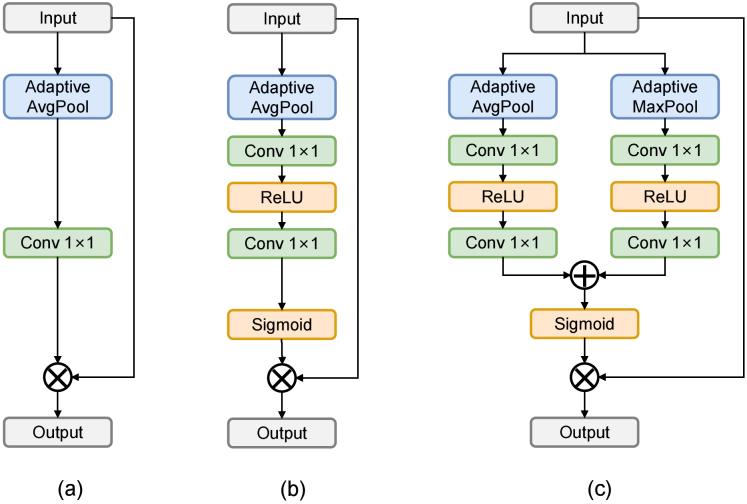
We conduct experiments to explore the effects of different CAM designs. Three implementation methods of channel attention are shown in Fig. 8. CBAM [27] aggregates channel information of a feature map by using two pooling operations, generating two 2D maps, while SENet [26] only uses one pooling operation. NFANet [40] proposes simplified channel attention (SCA), preserving channel attention’s two most crucial roles, aggregating global and channel information. Based on Table 5, the channel attention implementation of CBAM is better suited for our specific task.
Fig. 8.
Illustration of (a) Simplified Channel Attention in NAFNet [40], (b) Channel Attention in SENet [26], and (c) Channel Attention in CBAM [27]. : element-wise addition / multiplication.
Table 5. Effects of different channel attention (CA) in CAM.
| CA | 2 | 4 | ||||
|---|---|---|---|---|---|---|
| PKU37-val | DUKE17 | DUKE28 | PKU37-val | DUKE17 | DUKE28 | |
| SCA in NAFNet | 32.1552 | 27.5943 | 29.1671 | 31.3960 | 27.6562 | 29.0953 |
| CA in SENet | 32.1784 | 27.9056 | 29.4827 | 31.4120 | 27.8966 | 29.3193 |
| CA in CBAM | 32.1716 | 27.9786 | 29.5684 | 31.4380 | 27.9636 | 29.3870 |
4.1.4. Effectiveness of hybrid loss function
We conduct experiments to demonstrate the effectiveness of the proposed hybrid loss function. The quantitative performance reported on the PKU37-val dataset is shown in Table 6. It can be seen that after using the hybrid loss function, the PSNR, SSIM, and RMSE metrics of 2 and 4 SR have all been improved to varying degrees. To explore the effects of different hybrid ratios, we set a group from 0.01 to 0.1 to examine the performance change, as shown in Fig. 9. It can be found that when , the model achieves the highest PSNR regardless of whether the scaling factor is 2 or 4.
Table 6. Ablation study on the proposed hybrid loss function.
| Loss | 2 | 4 | ||||
|---|---|---|---|---|---|---|
| PSNR | SSIM | RMSE | PSNR | SSIM | RMSE | |
| MAE | 32.1716 | 0.8840 | 6.3053 | 31.4376 | 0.8704 | 6.8628 |
| MAE+FFT | 32.1815 | 0.8841 | 6.2997 | 31.4832 | 0.8712 | 6.8254 |
Fig. 9.
Effects of the constant parameter in hybrid loss function.
4.2. Enhancement in retinal layer segmentation
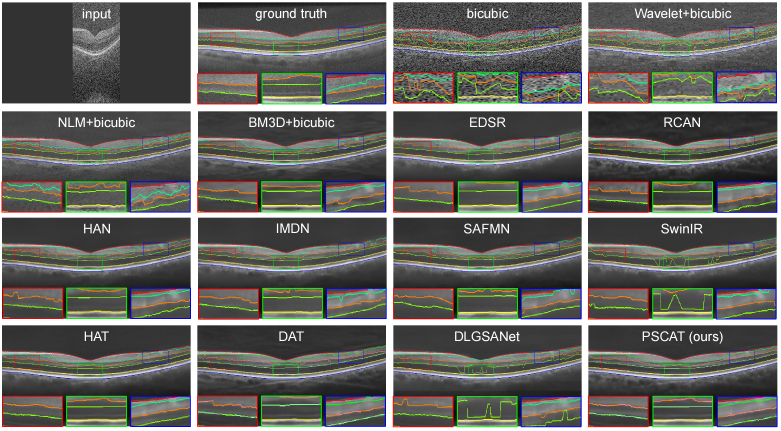
For retinal OCT images, segmenting layers containing various anatomical and pathological structures is crucial for diagnosing and researching eye diseases. The preprocessing of denoising and super-resolution preserves important clinical structures, making segmentation results more accurate. To further demonstrate the effectiveness of our PSCAT, we compared the impact of different methods on downstream retinal layer segmentation tasks. We used the images from DUKE17 that were processed using various methods and fed them into a public segmentation tool OCTSEG [41] to segment seven layers automatically. Figure 10 shows the results of a typical case, and it is evident PSCAT and HAT achieve the best performance in layer segmentation, as the segmentation lines are relatively flat, and there are no abnormal burrs, protrusions, or offsets. However, PSCAT restored more choroidal details than HAT.
Fig. 10.
Visual comparison of layer segmentation performance on DUKE17 of 4 SR.
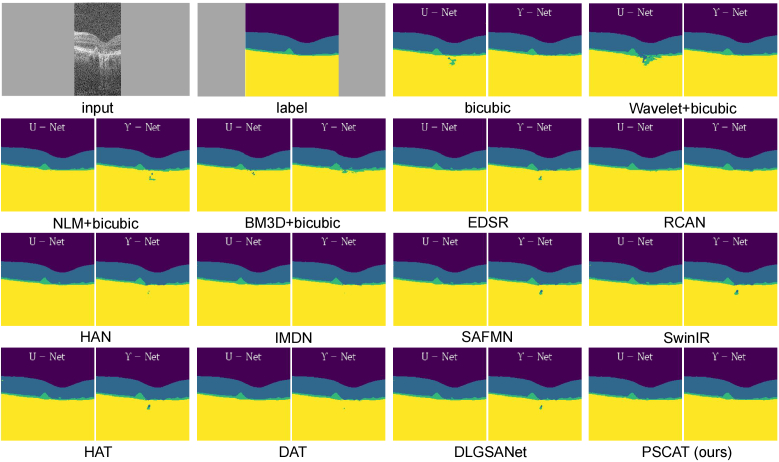
To better evaluate the enhancement effect, we employed various methods to process OCT images from a public retinal layer segmentation dataset [42]. We selected 772 image pairs, comprising OCT retinal images and corresponding retinal layer segmentation masks, from 20 subjects. The U-Net [43] and -Net [44] were trained for segmentation, and mean dice score and mean interaction over the union (mIoU) were used to evaluate all the methods. Figure 11 shows the visual segmentation results with the help of denoising and super-resolution by various methods. We can observe that the proposed PSCAT achieves the best segmentation results. Table 7 presents the quantitative results, which also demonstrate the superiority of our PSCAT in serving the downstream segmentation task.
Fig. 11.
Visual comparison of retinal layer segmentation after preprocessing with different methods of x2 SR.
Table 7. Quantitative results of retinal layer segmentation after preprocessing with different methods of x2 SR.
| Method | UNet | -Net | ||
|---|---|---|---|---|
| Mean Dice | mIoU | Mean Dice | mIoU | |
| Bicubic | 0.932 | 0.910 | 0.926 | 0.905 |
| Wavelet+Bicubic | 0.937 | 0.918 | 0.914 | 0.898 |
| NLM+Bicubic | 0.933 | 0.913 | 0.934 | 0.917 |
| BM3D+Bicubic | 0.933 | 0.914 | 0.937 | 0.916 |
| EDSR | 0.937 | 0.919 | 0.936 | 0.915 |
| RCAN | 0.932 | 0.911 | 0.934 | 0.909 |
| HAN | 0.934 | 0.915 | 0.931 | 0.908 |
| IMDN | 0.934 | 0.915 | 0.930 | 0.906 |
| SAFMN | 0.935 | 0.916 | 0.935 | 0.913 |
| SwinIR | 0.934 | 0.916 | 0.932 | 0.909 |
| HAT | 0.938 | 0.919 | 0.937 | 0.915 |
| DAT | 0.934 | 0.914 | 0.931 | 0.908 |
| DLGSANet | 0.933 | 0.915 | 0.936 | 0.914 |
| PSCAT (ours) | 0.939 | 0.921 | 0.941 | 0.921 |
4.3. Enhancement in pronounced retinal pathologies
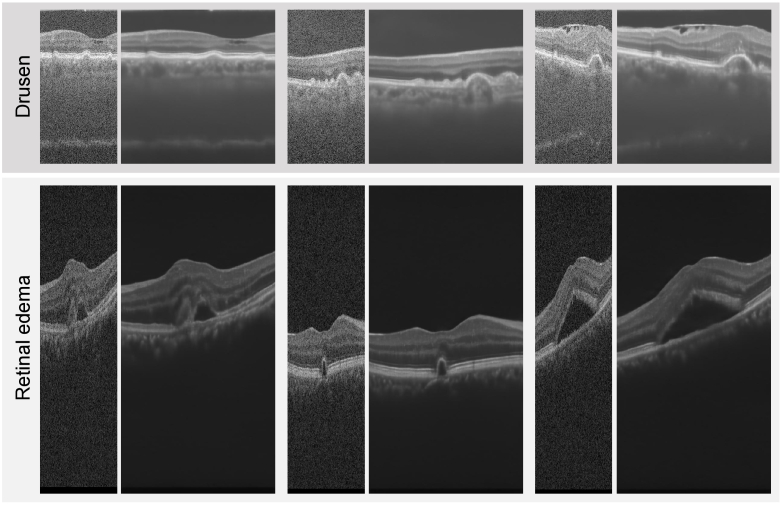
As the training set PKU37-train used in this study was collected from healthy eyes, to further validate the effectiveness of our PSCAT in processing retinal pathological images, we employed the trained model to analyze OCT images with drusen and retinal edema from the retinal layer segmentation dataset [42] and retinal edema segmentation challenge dataset [45]. Figure 12 presents the visual comparison before and after PSCAT denoising and 2 super-resolution. PSCAT significantly eliminates noise and enhances visual quality. Notably, although the PKU37-train does not include pathological images, the trained PSCAT can effectively enhance the quality of various OCT images with different pathologies, shapes, and structures. This is because the characteristics of speckle noise in OCT images are largely determined by the imaging system.
Fig. 12.
Visual comparison of OCT images with drusen and retinal edema before and after processing by PSCAT of 2 SR.
4.4. Limitations
The ablation studies demonstrate that the performance of our PSCAT is heavily dependent on the settings of hyperparameters. The process of identifying the optimal hyperparameters is complex and time-consuming, as it typically involves conducting numerous experiments to assess the impact of various hyperparameter combinations on model performance. Looking ahead, we can consider the implementation of automated hyperparameter tuning techniques, which aim to diminish the burden associated with manual hyperparameter adjustments. In addition, although our PSCAT is a lightweight Transformer model, the inherently complex architecture of the Transformer and the computations involved in its self-attention mechanism result in longer inference times. This can be a limiting factor for clinical applications that require rapid processing. Future improvements could focus on employing more efficient attention mechanisms, such as sparse attention, and utilizing techniques like model pruning and quantization to reduce the computational load.
5. Conclusion
In this paper, we propose an effective lightweight Transformer that parallelizes spatial and channel attention for OCT image simultaneous denoising and resolution enhancement in an end-to-end manner. Our method uses spatial window self-attention and channel attention in the Transformer block to aggregate features from both spatial and channel dimensions. It explores the potential of the Transformer for OCT image quality improvement while having low computational costs. Extensive experiments have shown that our proposed method exhibits competitive performance in qualitative and quantitative aspects compared to traditional, CNN-based, and Transformer-based methods. The benefit of its lightweight design is that our method has fewer network parameters, lower computational costs, and faster processing speed, and it is more suitable for clinical application needs.
Funding
National Natural Science Foundation of China10.13039/501100001809 (82371112, 62394311); Beijing Municipal Natural Science Foundation10.13039/501100005089 (Z210008); Shenzhen Science and Technology Program (KQTD20180412181221912).
Disclosures
The authors declare no conflicts of interest.
Data availability
Data underlying the results presented in this paper are available in Ref. [4,12,29,42,45].
References
- 1.Huang D., Swanson E. A., Lin C. P., et al. , “Optical coherence tomography,” Science 254(5035), 1178–1181 (1991). 10.1126/science.1957169 [DOI] [PMC free article] [PubMed] [Google Scholar]
- 2.Fujimoto J. G., “Optical coherence tomography for ultrahigh resolution in vivo imaging,” Nat. Biotechnol. 21(11), 1361–1367 (2003). 10.1038/nbt892 [DOI] [PubMed] [Google Scholar]
- 3.Schmitt J. M., Xiang S., Yung K. M., “Speckle in optical coherence tomography,” J. Biomed. Opt. 4(1), 95–105 (1999). 10.1117/1.429925 [DOI] [PubMed] [Google Scholar]
- 4.Fang L., Li S., McNabb R. P., et al. , “Fast acquisition and reconstruction of optical coherence tomography images via sparse representation,” IEEE Trans. Med. Imaging 32(11), 2034–2049 (2013). 10.1109/TMI.2013.2271904 [DOI] [PMC free article] [PubMed] [Google Scholar]
- 5.Trinh D.-H., Luong M., Dibos F., et al. , “Novel example-based method for super-resolution and denoising of medical images,” IEEE Trans. on Image Process. 23(4), 1882–1895 (2014). 10.1109/TIP.2014.2308422 [DOI] [PubMed] [Google Scholar]
- 6.Seelamantula C. S., Mulleti S., “Super-resolution reconstruction in frequency-domain optical-coherence tomography using the finite-rate-of-innovation principle,” IEEE Trans. Signal Process. 62(19), 5020–5029 (2014). 10.1109/TSP.2014.2340811 [DOI] [Google Scholar]
- 7.Abbasi A., Monadjemi A., Fang L., et al. , “Optical coherence tomography retinal image reconstruction via nonlocal weighted sparse representation,” J. Biomed. Opt. 23(03), 1–036011 (2018). 10.1117/1.JBO.23.3.036011 [DOI] [PubMed] [Google Scholar]
- 8.Jiang Z., Huang Z., Qiu B., et al. , “Weakly supervised deep learning-based optical coherence tomography angiography,” IEEE Trans. Med. Imaging 40(2), 688–698 (2020). 10.1109/TMI.2020.3035154 [DOI] [PubMed] [Google Scholar]
- 9.Qiu B., Huang Z., Liu X., et al. , “Noise reduction in optical coherence tomography images using a deep neural network with perceptually-sensitive loss function,” Biomed. Opt. Express 11(2), 817–830 (2020). 10.1364/BOE.379551 [DOI] [PMC free article] [PubMed] [Google Scholar]
- 10.Qiu B., Zeng S., Meng X., et al. , “Comparative study of deep neural networks with unsupervised noise2noise strategy for noise reduction of optical coherence tomography images,” J. Biophotonics 14(11), e202100151 (2021). 10.1002/jbio.202100151 [DOI] [PubMed] [Google Scholar]
- 11.Geng M., Meng X., Yu J., et al. , “Content-noise complementary learning for medical image denoising,” IEEE Trans. Med. Imaging 41(2), 407–419 (2021). 10.1109/TMI.2021.3113365 [DOI] [PubMed] [Google Scholar]
- 12.Geng M., Meng X., Zhu L., et al. , “Triplet cross-fusion learning for unpaired image denoising in optical coherence tomography,” IEEE Trans. Med. Imaging 41(11), 3357–3372 (2022). 10.1109/TMI.2022.3184529 [DOI] [PubMed] [Google Scholar]
- 13.Huang Y., Lu Z., Shao Z., et al. , “Simultaneous denoising and super-resolution of optical coherence tomography images based on generative adversarial network,” Opt. Express 27(9), 12289–12307 (2019). 10.1364/OE.27.012289 [DOI] [PubMed] [Google Scholar]
- 14.Qiu B., You Y., Huang Z., et al. , “N2nsr-oct: Simultaneous denoising and super-resolution in optical coherence tomography images using semisupervised deep learning,” J. Biophotonics 14(1), e202000282 (2021). 10.1002/jbio.202000282 [DOI] [PubMed] [Google Scholar]
- 15.Cao S., Yao X., Koirala N., et al. , “Super-resolution technology to simultaneously improve optical & digital resolution of optical coherence tomography via deep learning,” in 2020 42nd Annual International Conference of the IEEE Engineering in Medicine & Biology Society (EMBC), (IEEE, 2020), pp. 1879–1882. [DOI] [PMC free article] [PubMed] [Google Scholar]
- 16.Das V., Dandapat S., Bora P. K., “Unsupervised super-resolution of oct images using generative adversarial network for improved age-related macular degeneration diagnosis,” IEEE Sens. J. 20(15), 8746–8756 (2020). 10.1109/JSEN.2020.2985131 [DOI] [Google Scholar]
- 17.Vaswani A., Shazeer N., Parmar N., et al. , “Attention is all you need,” in Advances in Neural Information Processing Systems , vol. 30 Guyon I., Luxburg U. V., Bengio S., et al., eds. (Curran Associates, Inc., 2017). [Google Scholar]
- 18.Wang Z., Cun X., Bao J., et al. , “Uformer: A general u-shaped transformer for image restoration,” in Proceedings of the IEEE/CVF Conference on Computer Vision and Pattern Recognition, (2022), pp. 17683–17693. [Google Scholar]
- 19.Liang J., Cao J., Sun G., et al. , “Swinir: Image restoration using swin transformer,” in Proceedings of the IEEE/CVF international conference on computer vision, (2021), pp. 1833–1844. [Google Scholar]
- 20.Zamir S. W., Arora A., Khan S., et al. , “Restormer: Efficient transformer for high-resolution image restoration,” in Proceedings of the IEEE/CVF Conference on Computer Vision and Pattern Recognition, (2022), pp. 5728–5739. [Google Scholar]
- 21.Chen X., Wang X., Zhou J., et al. , “Activating more pixels in image super-resolution transformer,” in Proceedings of the IEEE/CVF Conference on Computer Vision and Pattern Recognition, (2023), pp. 22367–22377. [Google Scholar]
- 22.Zhang Y., Li K., Li K., et al. , “Image super-resolution using very deep residual channel attention networks,” in Proceedings of the European Conference on Computer Vision (ECCV), (2018). [Google Scholar]
- 23.Chen Z., Zhang Y., Gu J., et al. , “Dual aggregation transformer for image super-resolution,” in Proceedings of the IEEE/CVF International Conference on Computer Vision (ICCV), (2023), pp. 12312–12321. [Google Scholar]
- 24.Dosovitskiy A., Beyer L., Kolesnikov A., et al. , “An image is worth 16x16 words: Transformers for image recognition at scale,” in International Conference on Learning Representations, (2021). [Google Scholar]
- 25.Liu Z., Lin Y., Cao Y., et al. , “Swin transformer: Hierarchical vision transformer using shifted windows,” in Proceedings of the IEEE/CVF international conference on computer vision, (2021), pp. 10012–10022. [Google Scholar]
- 26.Hu J., Shen L., Sun G., “Squeeze-and-excitation networks,” in Proceedings of the IEEE Conference on Computer Vision and Pattern Recognition (CVPR), (2018). [Google Scholar]
- 27.Woo S., Park J., Lee J.-Y., et al. , “Cbam: Convolutional block attention module,” in Proceedings of the European conference on computer vision (ECCV), (2018), pp. 3–19. [Google Scholar]
- 28.Shi W., Caballero J., Huszár F., et al. , “Real-time single image and video super-resolution using an efficient sub-pixel convolutional neural network,” in Proceedings of the IEEE conference on computer vision and pattern recognition, (2016), pp. 1874–1883. [Google Scholar]
- 29.Fang L., Li S., Nie Q., et al. , “Sparsity based denoising of spectral domain optical coherence tomography images,” Biomed. Opt. Express 3(5), 927–942 (2012). 10.1364/BOE.3.000927 [DOI] [PMC free article] [PubMed] [Google Scholar]
- 30.Paszke A., Gross S., Massa F., et al. , “Pytorch: An imperative style, high-performance deep learning library,” Advances in neural information processing systems 32, 8206 (2019). 10.5555/3454287.3455008 [DOI] [Google Scholar]
- 31.Kingma D., Ba J., “Adam: A method for stochastic optimization,” in International Conference on Learning Representations (ICLR), ( San Diega, CA, USA, 2015). [Google Scholar]
- 32.Adler D. C., Ko T. H., Fujimoto J. G., “Speckle reduction in optical coherence tomography images by use of a spatially adaptive wavelet filter,” Opt. Lett. 29(24), 2878–2880 (2004). 10.1364/OL.29.002878 [DOI] [PubMed] [Google Scholar]
- 33.Zhang X., Li L., Zhu F., et al. , “Spiking cortical model–based nonlocal means method for speckle reduction in optical coherence tomography images,” J. Biomed. Opt. 19(6), 066005 (2014). 10.1117/1.JBO.19.6.066005 [DOI] [PubMed] [Google Scholar]
- 34.Wang L., Meng Z., Yao X. S., et al. , “Adaptive speckle reduction in oct volume data based on block-matching and 3-d filtering,” IEEE Photonics Technol. Lett. 24(20), 1802–1804 (2012). 10.1109/LPT.2012.2211582 [DOI] [Google Scholar]
- 35.Lim B., Son S., Kim H., et al. , “Enhanced deep residual networks for single image super-resolution,” in Proceedings of the IEEE Conference on Computer Vision and Pattern Recognition (CVPR) Workshops, (2017). [Google Scholar]
- 36.Niu B., Wen W., Ren W., et al. , “Single image super-resolution via a holistic attention network,” in Computer Vision – ECCV 2020, (Springer International Publishing, Cham, 2020), pp. 191–207. [Google Scholar]
- 37.Hui Z., Gao X., Yang Y., et al. , “Lightweight image super-resolution with information multi-distillation network,” in Proceedings of the 27th acm international conference on multimedia, (2019), pp. 2024–2032. [Google Scholar]
- 38.Sun L., Dong J., Tang J., et al. , “Spatially-adaptive feature modulation for efficient image super-resolution,” in Proceedings of the IEEE/CVF International Conference on Computer Vision, (2023), pp. 13190–13199. [Google Scholar]
- 39.Li X., Dong J., Tang J., et al. , “Dlgsanet: lightweight dynamic local and global self-attention networks for image super-resolution,” in Proceedings of the IEEE/CVF International Conference on Computer Vision, (2023), pp. 12792–12801. [Google Scholar]
- 40.Chen L., Chu X., Zhang X., et al. , “Simple baselines for image restoration,” in Computer Vision–ECCV 2022: 17th European Conference, Tel Aviv, Israel, October 23–27, 2022, Proceedings, Part VII, (Springer, 2022), pp. 17–33. [Google Scholar]
- 41.Mayer M. A., Hornegger J., Mardin C. Y., et al. , “Retinal nerve fiber layer segmentation on fd-oct scans of normal subjects and glaucoma patients,” Biomed. Opt. Express 1(5), 1358–1383 (2010). 10.1364/BOE.1.001358 [DOI] [PMC free article] [PubMed] [Google Scholar]
- 42.Farsiu S., Chiu S. J., O’Connell R. V., et al. , “Quantitative classification of eyes with and without intermediate age-related macular degeneration using optical coherence tomography,” Ophthalmology 121(1), 162–172 (2014). 10.1016/j.ophtha.2013.07.013 [DOI] [PMC free article] [PubMed] [Google Scholar]
- 43.Ronneberger O., Fischer P., Brox T., “U-net: Convolutional networks for biomedical image segmentation,” in Medical image computing and computer-assisted intervention–MICCAI 2015: 18th international conference, Munich, Germany, October 5-9, 2015, proceedings, part III 18, (Springer, 2015), pp. 234–241. [Google Scholar]
- 44.Farshad A., Yeganeh Y., Gehlbach P., et al. , “Y-net: A spatiospectral network for retinal oct segmentation,” in International Conference on Medical Image Computing and Computer-Assisted Intervention, (Springer, 2022). [Google Scholar]
- 45.Hu J., Chen Y., Yi Z., “Automated segmentation of macular edema in OCT using deep neural networks,” Med. Image Anal. 55, 216–227 (2019). 10.1016/j.media.2019.05.002 [DOI] [PubMed] [Google Scholar]
Associated Data
This section collects any data citations, data availability statements, or supplementary materials included in this article.
Data Availability Statement
Data underlying the results presented in this paper are available in Ref. [4,12,29,42,45].


