

Significance
The identification of LIRIL2R, a long intergenic noncoding RNA (lincRNA) that plays a crucial role in regulating the expression of interleukin-2 receptor alpha (IL2RA), sheds light on the intricate mechanisms governing the development and function of regulatory T cells (Tregs). Understanding these mechanisms is of paramount importance due to the central role Tregs play in immune regulation and their implications in autoimmune disorders and cancer. By elucidating how LIRIL2R influences the epigenetic landscape and transcriptional profile of Tregs, this study expands our knowledge of epigenetic regulation in immune cells and reveals potential therapeutic targets for modulating immune response in immune-mediated disorders. Further, the findings underscore the significance of lincRNAs in shaping immune homeostasis.
Keywords: regulatory T cells, long noncoding RNA, FOXP3, IL2RA, LIRIL2R
Abstract
Regulatory T cells (Tregs) are central in controlling immune responses, and dysregulation of their function can lead to autoimmune disorders or cancer. Despite extensive studies on Tregs, the basis of epigenetic regulation of human Treg development and function is incompletely understood. Long intergenic noncoding RNAs (lincRNA)s are important for shaping and maintaining the epigenetic landscape in different cell types. In this study, we identified a gene on the chromosome 6p25.3 locus, encoding a lincRNA, that was up-regulated during early differentiation of human Tregs. The lincRNA regulated the expression of interleukin-2 receptor alpha (IL2RA), and we named it the lincRNA regulator of IL2RA (LIRIL2R). Through transcriptomics, epigenomics, and proteomics analysis of LIRIL2R-deficient Tregs, coupled with global profiling of LIRIL2R binding sites using chromatin isolation by RNA purification, followed by sequencing, we identified IL2RA as a target of LIRIL2R. This nuclear lincRNA binds upstream of the IL2RA locus and regulates its epigenetic landscape and transcription. CRISPR-mediated deletion of the LIRIL2R-bound region at the IL2RA locus resulted in reduced IL2RA expression. Notably, LIRIL2R deficiency led to reduced expression of Treg-signature genes (e.g., FOXP3, CTLA4, and PDCD1), upregulation of genes associated with effector T cells (e.g., SATB1 and GATA3), and loss of Treg-mediated suppression.
Regulation of the immune system is critical for preventing autoimmunity and fighting infection and cancer (1). Regulatory T cells (Tregs) play a crucial role in maintaining immune tolerance and the balance of pro- and anti-inflammatory responses (2). While most Tregs in the periphery come directly from the thymus as a functionally mature population of thymic Tregs, some acquire their regulatory phenotype in the periphery, by differentiating from naive CD4+ T cells upon stimulation in the appropriate milieu (3). Additionally, Tregs can also be induced in vitro (iTregs) from naive CD4+ T cells through activation of T cell antigen receptor in the presence of cytokines, such as IL-2, TGF-β, and all-trans retinoic acid (ATRA) or rapamycin (4).
Commitment and maintenance of the Treg lineage is shaped via a complex interplay of several transcription factors (TF)s and epigenetic modifiers guiding a discrete transcriptional regulatory program. While FOXP3 is the most-studied TF associated with Treg differentiation and function, other TFs (e.g., IKAROS family of TFs, HIC1, NR4A1/2/3) also contribute to Tregs differentiation (5–8). In addition to TFs, the Treg-specific epigenetic landscape is important in conferring the regulatory phenotype to Tregs (9, 10). The epigenetic landscape of a given cell type is, in part, regulated by long noncoding RNAs (lncRNAs) that are longer than 200 bp and do not encode proteins. Several lncRNAs have a crucial function in cell differentiation. In mice, silencing certain long intergenic noncoding RNAs (lincRNAs) had similar effects on the stem cell pluripotency as that of silencing critical TFs, such as OCT4 and NANOG (11). LincRNAs mediate epigenetic modification by different mechanisms, including recruiting chromatin-remodeling complexes to specific chromatin regions to affect various biological processes, transcriptional regulation, imprinting, and developmental gene expression (12, 13).
LncRNAs are important contributors to immune homeostasis and effector functions (14) and regulate T helper (Th) cell differentiation (15). For example, linc-MAF4, a Th1-specific lncRNA in humans, limits Th2 differentiation by negatively regulating MAF4, a Th2-specific TF (16). LncRNA GATA3-AS1 is essential for modifying the chromatin landscape of GATA3 and regulates its expression and the expression of the Th2 effector cytokines IL-5 and IL-13 (17). LncRNA Tmevpg1 is up-regulated in Th1 cells with a corresponding increase in IFNγ expression (18). LncRNA H19, lncRNA NEAT1, and lncRNA-MEG3 regulate Th17 cell differentiation (19–21). Furthermore, we recently identified lincRNA MIAT as a positive regulator of early human Th17 cell differentiation (22).
Although lncRNAs have been shown to regulate the differentiation of mouse Tregs (23–25), their roles in regulating human Treg differentiation are poorly understood. We and others reported upregulation of several lncRNAs during Treg differentiation (7, 16). Here, we identified a Treg-specific lncRNA that we named lincRNA regulator of interleukin-2 receptor alpha (IL2RA) (LIRIL2R). We characterized the transcriptome and epigenome of LIRIL2R-deficient Tregs. We investigated the effects of CRISPR-mediated deletion of LIRIL2R-bound noncoding regulatory region upstream of IL2RA on the expression of IL2RA. We also studied the expression of key Treg-associated genes, such as FOXP3, CTLA4, and PDCD1, in LIRIL2R-deficient Tregs. Our results indicate that LIRIL2R influences the epigenetic and transcriptional landscape of Tregs and may have potential for therapeutic opportunities for autoimmunity and cancer.
Results
Transcriptome Analysis Identified lncRNAs Differentially Regulated during Early Treg Differentiation.
Earlier, we identified hundreds of lncRNAs that were differentially regulated during early differentiation of human iTregs as compared to activated T cells (7). After a series of computational filtering, we selected 12 lincRNAs for validation of their expression by TaqMan qRT-PCR (Fig. 1A) and identified a lincRNA LIRIL2R, highly up-regulated after induction of iTreg differentiation (Fig. 1B). Furthermore, visualization of the mapped RNAseq reads at the locus showed that LIRIL2R was not part of neighboring protein-coding genes (Fig. 1C and SI Appendix, Fig. S1A).
Fig. 1.
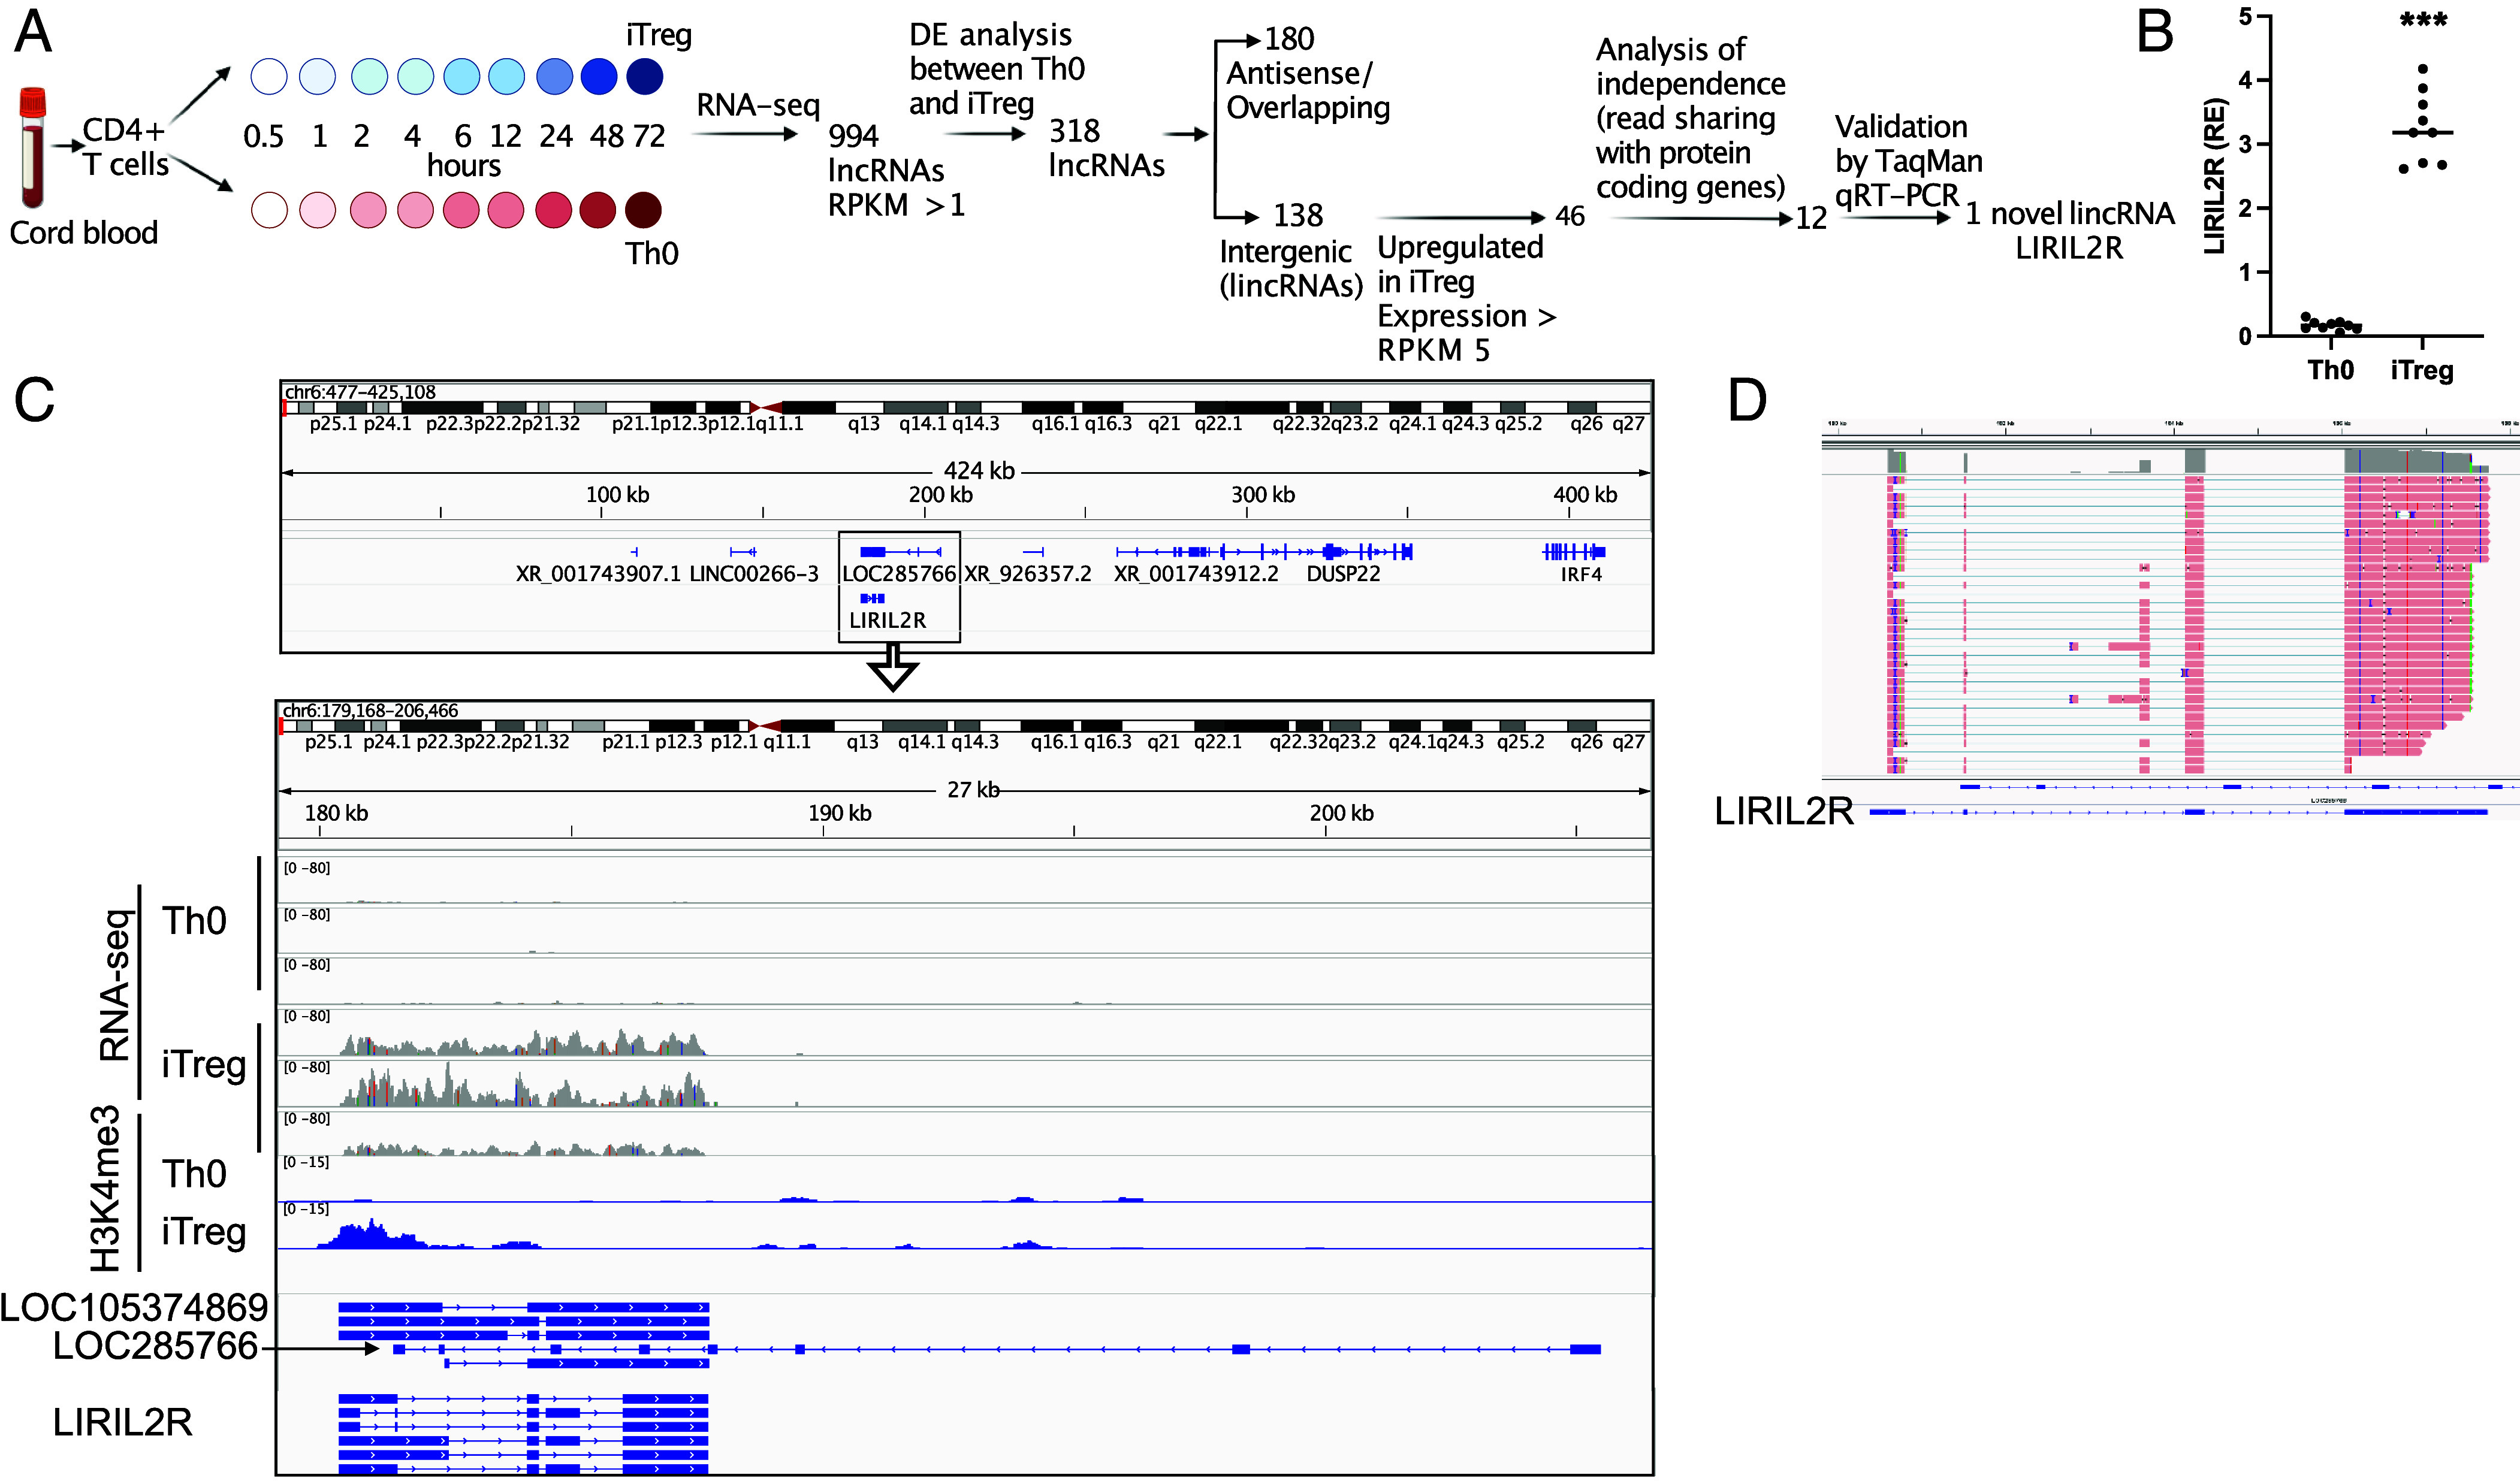
LIRIL2R is a gene expressed in human iTregs. (A) Scheme showing the filtering of lncRNA to identify LIRIL2R. The panel was created using biorender. (B) TaqMan qRT-PCR validations of LIRIL2R expression in Th0 and iTregs at 48 h. Relative expression was calculated from delta Ct (dCt) values normalized with the housekeeping gene (EF1α and formula 10000*2^-dCt). ***P <0.001 by the paired two-tailed t test. (C) The IGV browser shots showing the LIRIL2R locus. The Top panel shows the location of LIRIL2R and other neighboring genes. The first six tracks in the Bottom panel show the read coverage at the LIRIL2R locus in Th0 and iTreg cells at 48 h in RNA-seq data. The last two tracks show H3K4me3 marks in Th0 and iTregs. LOC285766 and the predicted gene LOC105374869 and LIRIL2R are shown at the Bottom. (D) IGV browser shot shows LIRIL2R transcript as obtained using PacBio-based long-read Iso-seq.
The LIRIL2R Locus on Chromosome 6p25.3 Is Specifically Expressed in iTregs.
Based on RNA-sequencing (RNA-seq) data analysis, we found a locus on chromosome 6p25.3 to be highly up-regulated in 48 h differentiated iTregs, compared to activated control cells (Th0) (Fig. 1C). The up-regulated chromosomal region overlapped the 3′ end of the lncRNA gene LOC285766 (RP3-416J7.4/AL035696.3), which is transcribed from the antisense (reverse/-) strand (Fig. 1C). We suspected that the mapped reads may not come from LOC285766 because (A) the reads were present only in the 3’ region, (B) the junctions supported by the mapped reads were not present in the LOC285766 gene, and (C) the exon–intron junctions on the LOC285766 gene were not supported by the mapped reads (SI Appendix, Fig. S1A). Stranded RNA-seq data confirmed that the reads in this region were indeed transcribed from the forward strand. Thus, based on the read junctions found in the RNA-seq data, we assembled on the sense (Forward/+) strand six isoforms of LIRIL2R (SI Appendix, Fig. S1A). To determine the boundaries of the gene and the exon–intron junctions, we performed a series of random amplification of cDNA ends (RACE)-PCR and regular PCRs combined with Sanger sequencing (SI Appendix, Fig. S1A and Table S1). Based on these analyses, we found that the gene begins at chr6:180394 (hg38) and ends at chr6:187730 (hg38) (see Materials and Methods for details). Interestingly, in NCBI Gene database, a predicted uncharacterized lncRNA gene LOC105374869 is located in the same region and transcribed from the sense (Forward/+) strand.
To confirm that LIRIL2R is transcribed from the sense strand, we compared the H3K4me3 promoter mark by Cleavage Under Targets and Tagmentation and sequencing (CUT&Tag-seq) of 72 h differentiated iTregs and Th0 cells. We found a clear promoter mark near the 5′ end of LIRIL2R that was specific to iTregs (Fig. 1C). Importantly, the promoter for LOC285766, the overlapping gene transcribed from the antisense strand, did not show any H3K4me3 mark (Fig. 1C), confirming that LIRIL2R (LOC105374869) but not LOC285766 is expressed in iTregs. The FANTOM5 data also showed a promoter near LIRIL2R transcription start site in T cells but no promoter mark at the TSS of LOC285766 (SI Appendix, Fig. S1B).
Further, using Pacific Biosciences (PacBio)-based Iso-seq, we examined LIRIL2R expression (as illustrated in SI Appendix, Fig. S1C) and found that LIRIL2R is indeed transcribed from the sense strand and that one of the isoforms of the transcript contains four exons with 2393 nucleotide long sequence (Fig. 1D). To further define the expression of the transcript, we used northern blot analysis with a PCR probe amplified from exons 3 and 4 of isoform 5 (SI Appendix, Fig. S1A) of the PCR-confirmed transcript. We selected this region for northern probe because exon 3 was also common in the PacBio Iso-seq analysis. The northern blot analysis showed a specific band of approximately 2.5 kb, suggesting the expression of the transcript in iTregs (SI Appendix, Fig. S1D). Thus, we identified a lncRNA induced during early human iTreg differentiation.
LIRIL2R Is Induced by TGF-β.
Using TaqMan qRT-PCR (SI Appendix, Table S2), we found that LIRIL2R expression was up-regulated significantly more in 48 h and 72 h differentiated iTregs than in Th0 cells (Fig. 2A). Interestingly, while the expression of LIRIL2R was unchanged during Th1 differentiation, it was down-regulated under Th2-polarizing condition and up-regulated in Th17 condition, at 72 h timepoint (Fig. 2B). To identify the cytokines that up-regulate the expression of LIRIL2R in iTregs, we stimulated T cells with the Th cell polarizing cytokines. All the combinations of cytokine cocktails that contained TGF-β induced LIRIL2R expression (Fig. 2C). TGF-β-mediated induction of LIRIL2R was further confirmed in a titration experiment where we observed a dose-dependent increase in the expression of LIRIL2R (SI Appendix, Fig. S1E).
Fig. 2.
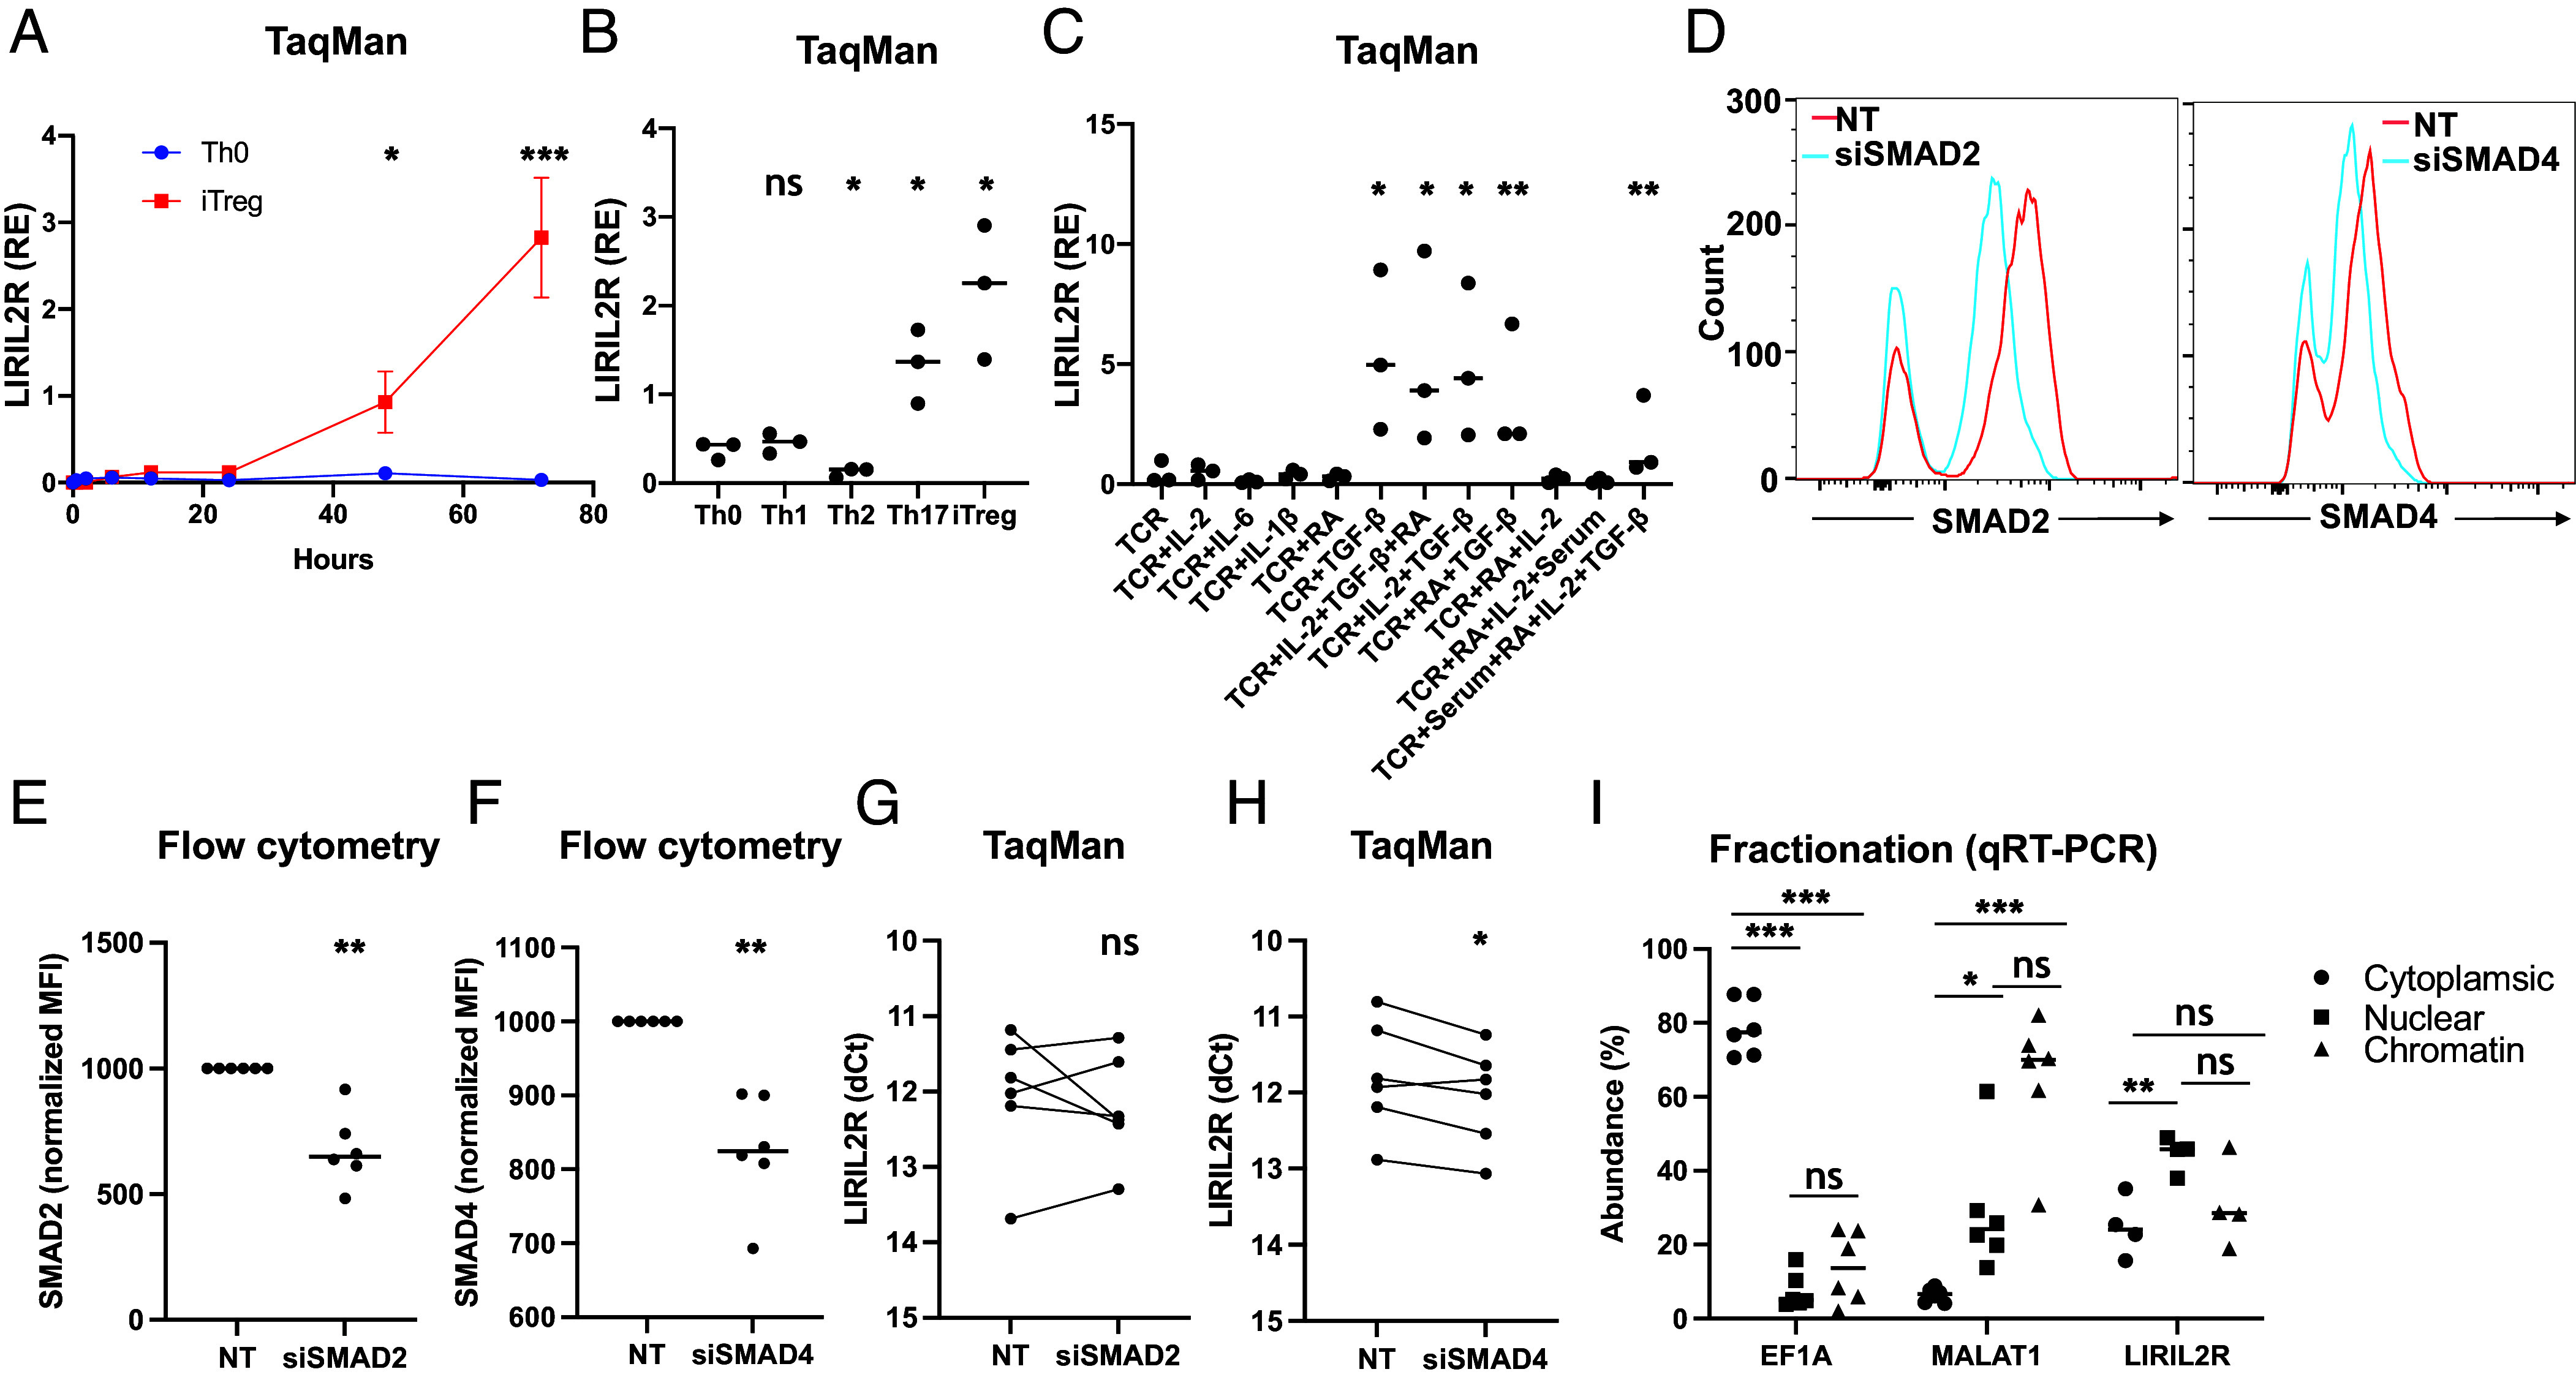
LIRIL2R is induced by TGF-β and resides in the nucleus. (A) The line plot shows the expression of LIRIL2R as obtained through TaqMan qRT-PCR analysis. Mean ± SEM are plotted from four biological replicates. (B) Univariate scatter plot shows LIRIL2R expression in different 72 h cultured Th cell subsets. The expression in each subset is compared to Th0. (C) The plot shows LIRIL2R expression, when T cells were activated in presence of the indicated cytokines. TCR refers to CD3/CD28 activation in absence of any cytokines. (D) Overlay histograms show the siRNA-mediated silencing of SMAD2 (siSAMD2) or SMAD4 (siSMAD4). (E and F) The plots show quantification of multiple experiments similar to the ones shown in D. (G and H) The plots show the effect of silencing SMAD2 or SMAD4 on LIRIL2R. Paired samples are connected with a line. (I) Cellular location of LIRIL2R as determined by cellular fractionation, followed by qRT-PCR. In all dot plots, the horizontal lines show the median. In all panels, significance was determined by the paired two-tailed t test. *P < 0.05, **P < 0.01, ***P < 0.001, “ns”: not significant.
TGF-β induces LIRIL2R expression (Fig. 2C) and promotes differentiation of Tregs (26, 27). Upon binding to its receptor, TGF-β induces phosphorylation of SMAD2 or SMAD3, which dimerizes with SMAD4. The dimer then translocates to the nucleus and activates the transcription of target genes. LIRIL2R promoter region harbors binding sites for SMAD2 and SMAD4 but not for SMAD3 (SI Appendix, Fig. S1F), and SMAD3 was down-regulated during differentiation of Tregs (7), suggesting that TGF-β induces LIRIL2R expression via activation of SMAD2/SMAD4.
To test whether SMAD2 or SMAD4 regulate LIRIL2R expression, we silenced their expression using siRNAs and measured the effect of silencing on LIRIL2R expression. The siRNA treatment led to significant reduction in the expression of the target genes both at RNA (SI Appendix, Fig. S2 A and B) and protein levels (Fig. 2 D–F). While SMAD2 silencing had no significant effect on LIRIL2R, SMAD4 silencing down-regulated its expression (Fig. 2 G and H), confirming that TGF-β induced LIRIL2R through SMAD4.
LIRIL2R Is Expressed In Vivo and Resides in the Nucleus.
To study LIRIL2R expression in vivo, we reanalyzed the published RNA-seq data of peripheral blood immune cells from 91 healthy human subjects (https://dice-database.org/) (28). Among the ex vivo CD4+ T cell subsets, the expression was highest in the Treg subset (SI Appendix, Fig. S2C). Many lncRNAs localize to the nucleus. To study the cellular location of LIRIL2R, we fractionated CD4+ T cells polarized toward iTregs for 48 h and measured the expression of LIRIL2R in cytoplasmic, nuclear, and chromatin fractions. LIRIL2R was primarily localized in nuclear fraction (Fig. 2I). Visualization of LIRIL2R by confocal microscopy, using the RNAScope method, confirmed the nuclear location of the transcript (SI Appendix, Fig. S2 D and E).
LIRIL2R Regulates FOXP3 Expression and Suppressive Capacity of iTregs.
To study the function of LIRIL2R during differentiation of Tregs, we silenced LIRIL2R using two different locked nucleic acid-modified gapmer antisense oligonucleotides (LNAs) (SI Appendix, Table S3) targeting different regions of the transcript: LNA2 targets the 5′ end of the transcript while LNA1 targets the third exon shown in Fig. 1D. Both LNAs significantly reduced LIRIL2R expression, as measured by a TaqMan assay (Fig. 3A) and an RNAScope in situ hybridization assay (SI Appendix, Fig. S2 F and G). LIRIL2R silenced cells had similar viability as that of cells treated with nontargeting LNA (NT LNA) (SI Appendix, Fig. S2H). As FOXP3 plays a crucial role in the differentiation and function of Tregs, we investigated whether LIRIL2R regulates FOXP3 expression. Silencing of LIRIL2R led to significant reduction in FOXP3 expression (Fig. 3 B and C), which cannot be attributed to decreased proliferation of LIRIL2R-deficient iTregs (SI Appendix, Fig. S3 A and B).
Fig. 3.
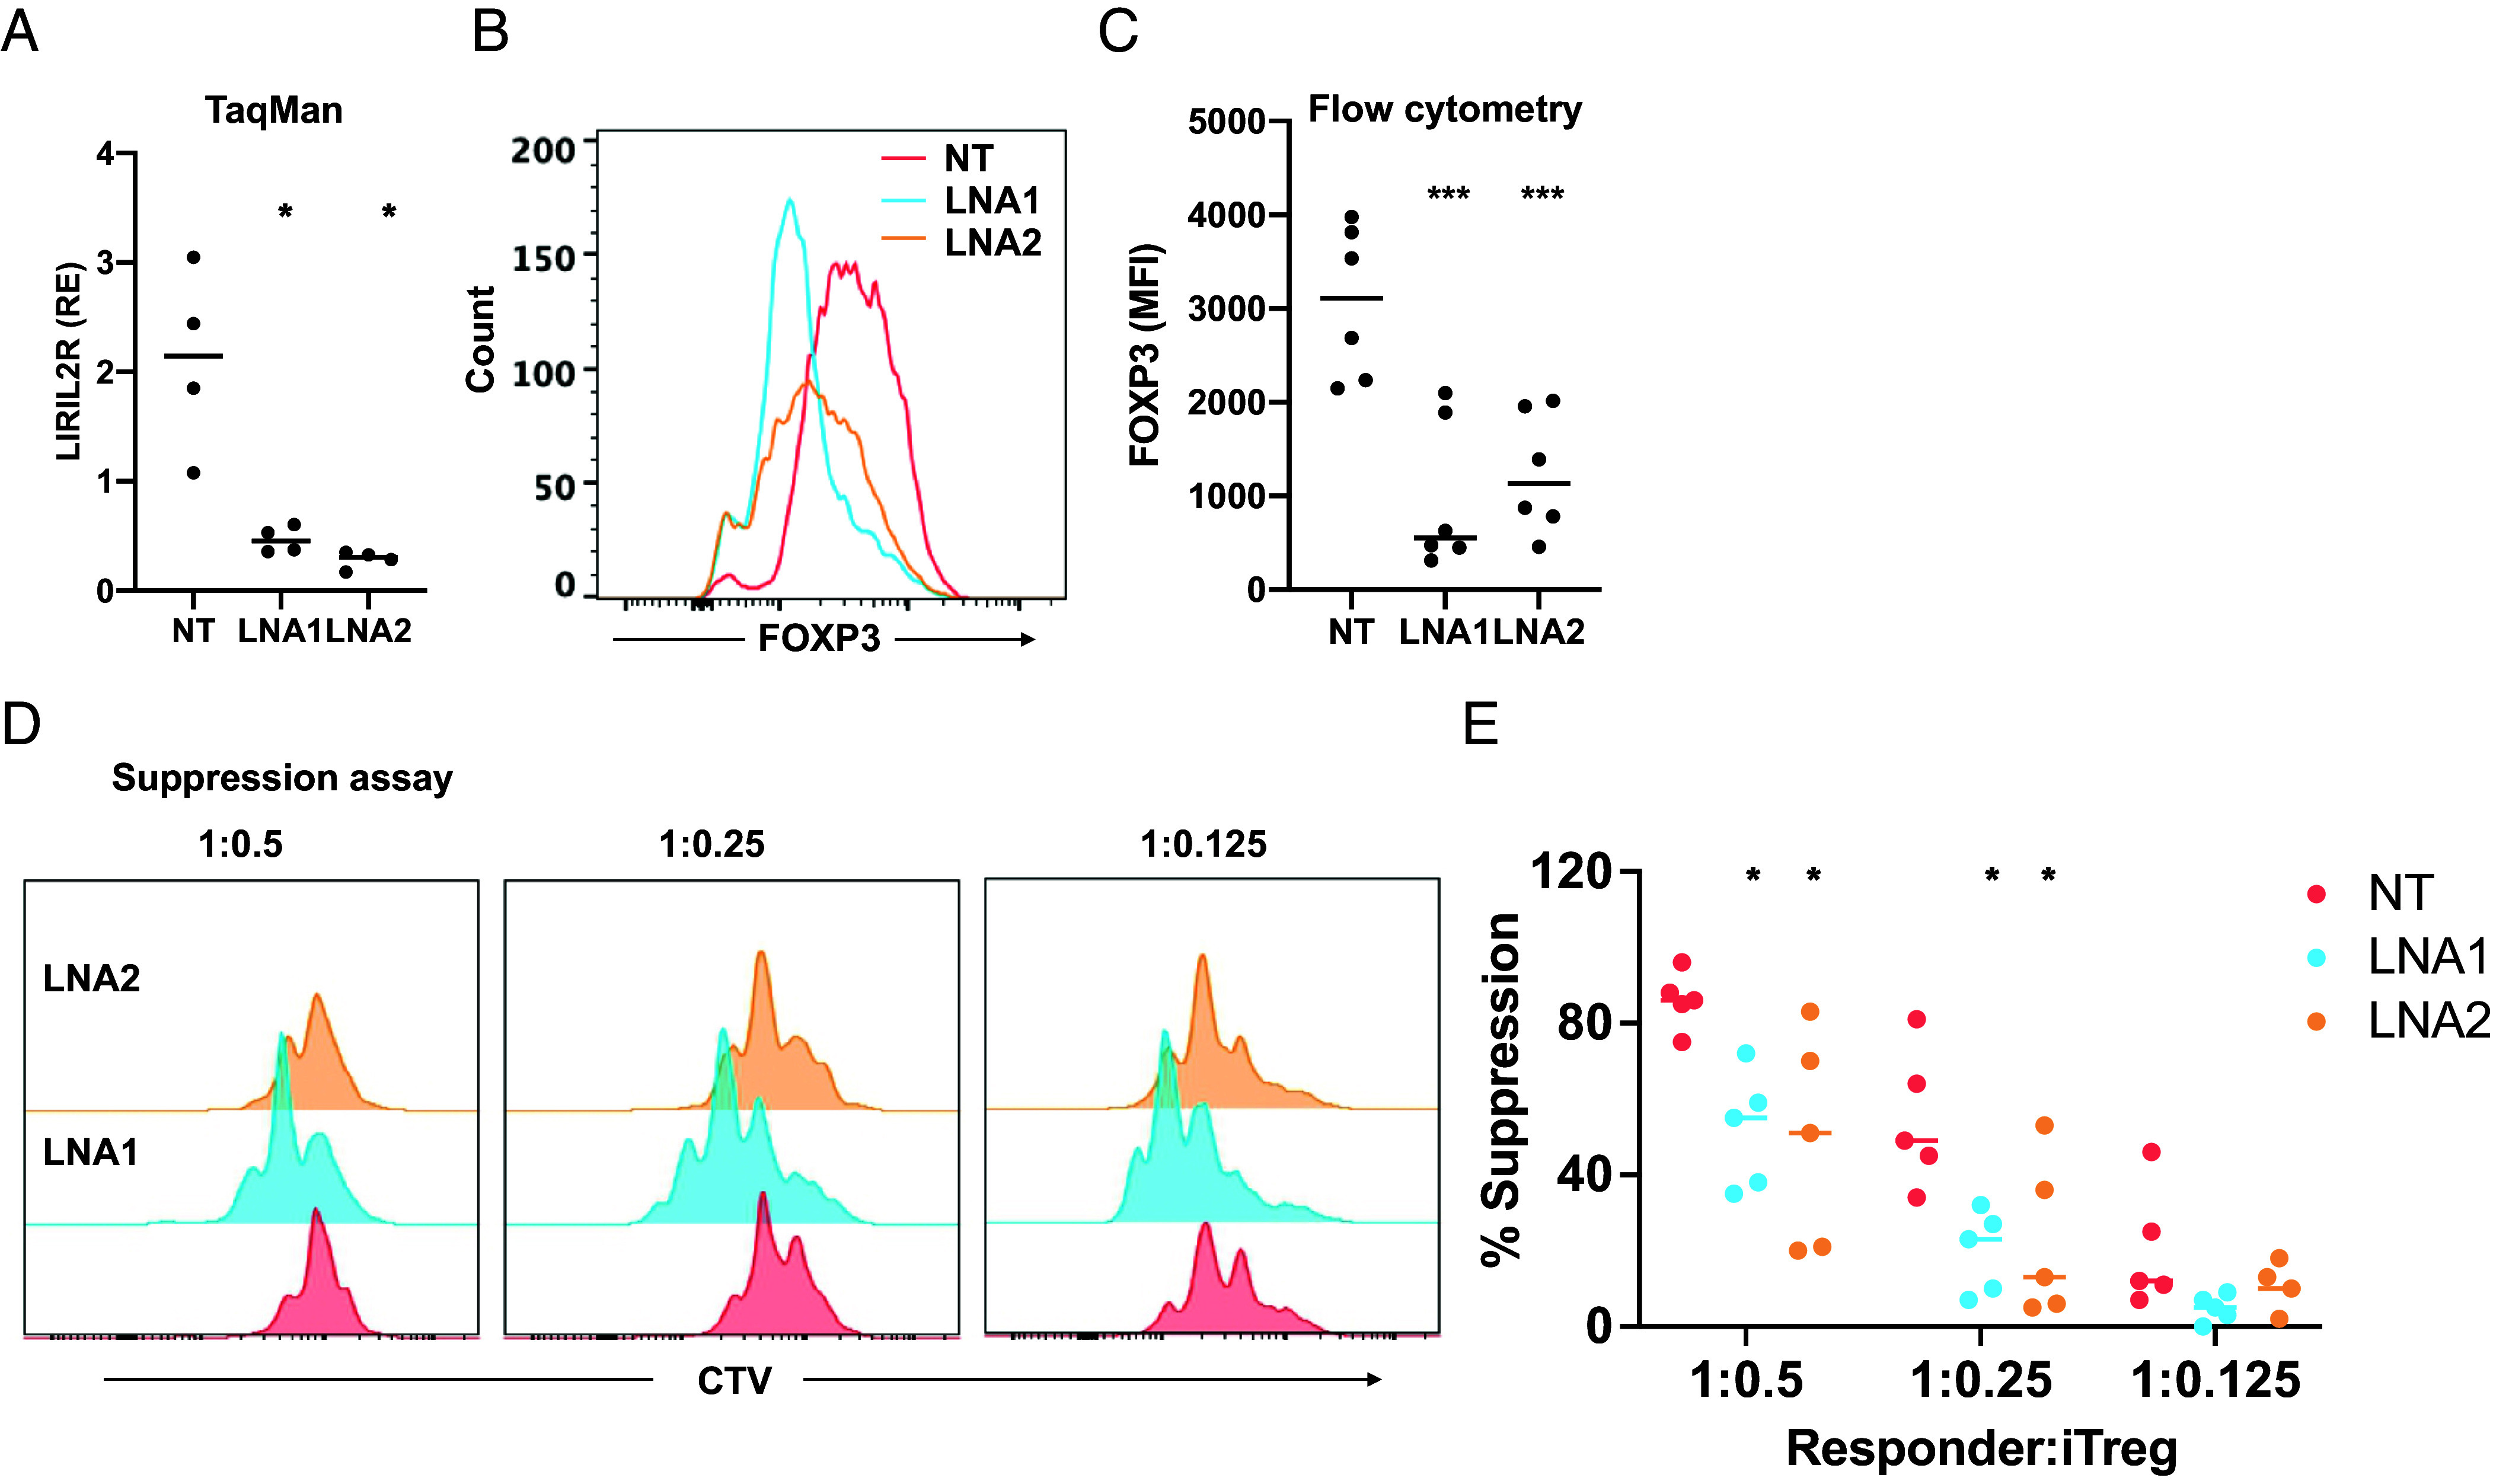
LIRIL2R regulates FOXP3 expression and suppressive ability of iTregs. (A) The plot shows the knockdown efficiency of the two LNAs targeting LIRIL2R transcript measured by TaqMan assay in 72 h cultured iTregs. (B and C) Expression of FOXP3 in LIRIL2R-silenced iTregs at 72 h, as obtained in a representative experiment (B) and the data from six independent experiments (C). (D) Histogram plots show the proliferation of responder cells at a responder/suppressor ratio of 1:0.5, 1:0.25, and 1:0.125 after 72 h of activation in presence of LIRIL2R-sufficient (NT) or LIRIL2R-deficient (LNA1/LNA2) iTregs. (E) The panel shows the quantification from five independent experiments similar to what is shown in panel D. The percentage of suppression was calculated using the following formula: % suppression = [% of dividing cells (Tres-iTreg)/% of dividing cells in Tres] × 100. In all dot plots, the horizontal lines show the median. In all panels, significance was determined by the paired two-tailed t test. *P < 0.05, ***P < 0.001.
To further investigate the impact of LIRIL2R on Treg function, we conducted an in vitro suppression assay, coculturing LIRIL2R-deficient or sufficient iTregs with CD4+ responder cells at different ratios. We found that LIRIL2R-deficient iTregs were less effective in suppressing the proliferation of responder cells, especially at ratios of 1:0.5 or 1:0.25 (Fig. 3 D and E). Our findings demonstrate that LIRIL2R plays a crucial role in regulating FOXP3 expression and Treg suppressive function, as LIRIL2R-deficient cells exhibit compromised suppressive ability and decreased FOXP3 expression.
LncRNAs may modulate the chromatin state and transcriptional activity of the nearest genes (i.e., in cis) or genes on a different locus (i.e., in trans). DUSP22 and IRF4 are the nearest protein-coding genes, located 112 kb and 211 kb downstream of LIRIL2R, respectively. We tested whether LIRIL2R exerts its function in cis by regulating the expression of these two neighboring genes. Expression levels of DUSP22 and IRF4 were not significantly altered upon LIRIL2R silencing (SI Appendix, Fig. S3 C and D), suggesting that LIRIL2R may act in trans. The regulation of hundreds of genes far away from the LIRIL2R locus in the RNA-seq and proteomics experiments described below, confirms that LIRIL2R indeed acts in trans.
RNA-seq, ATAC-seq, and Proteomics Analyses of LIRIL2R-Deficient iTregs Identified Its Targets.
To identify the targets of LIRIL2R in iTregs, we analyzed LIRIL2R-silenced iTregs by RNA-seq at 24 h, 48 h, and 72 h after the start of differentiation. Further, 48 h samples were analyzed by mass spectrometry-based data independent (DIA) proteomics in three biological replicates. Based on RNA-seq data, LIRIL2R was efficiently silenced by LNA treatment (SI Appendix, Fig. S3E) and 536, 1,878, and 617 genes were differentially expressed (DE) (FDR<0.05; FC>1.5; TPM >=1) at 24 h, 48 h, and 72 h, respectively (Dataset S1). In the proteomics data, similar samples clustered together (SI Appendix, Fig. S4 A and B), and altogether, 1,250 proteins were down-regulated and 571 proteins were up-regulated upon LIRIL2R silencing at 48 h time point (Dataset S2 and SI Appendix, Fig. S4C). Among the 1,821 (1,250 + 571) differentially regulated proteins (FDR<0.05; FC>1.5), 711 were also similarly regulated in the RNA-seq data (Fig. 4A).
Fig. 4.
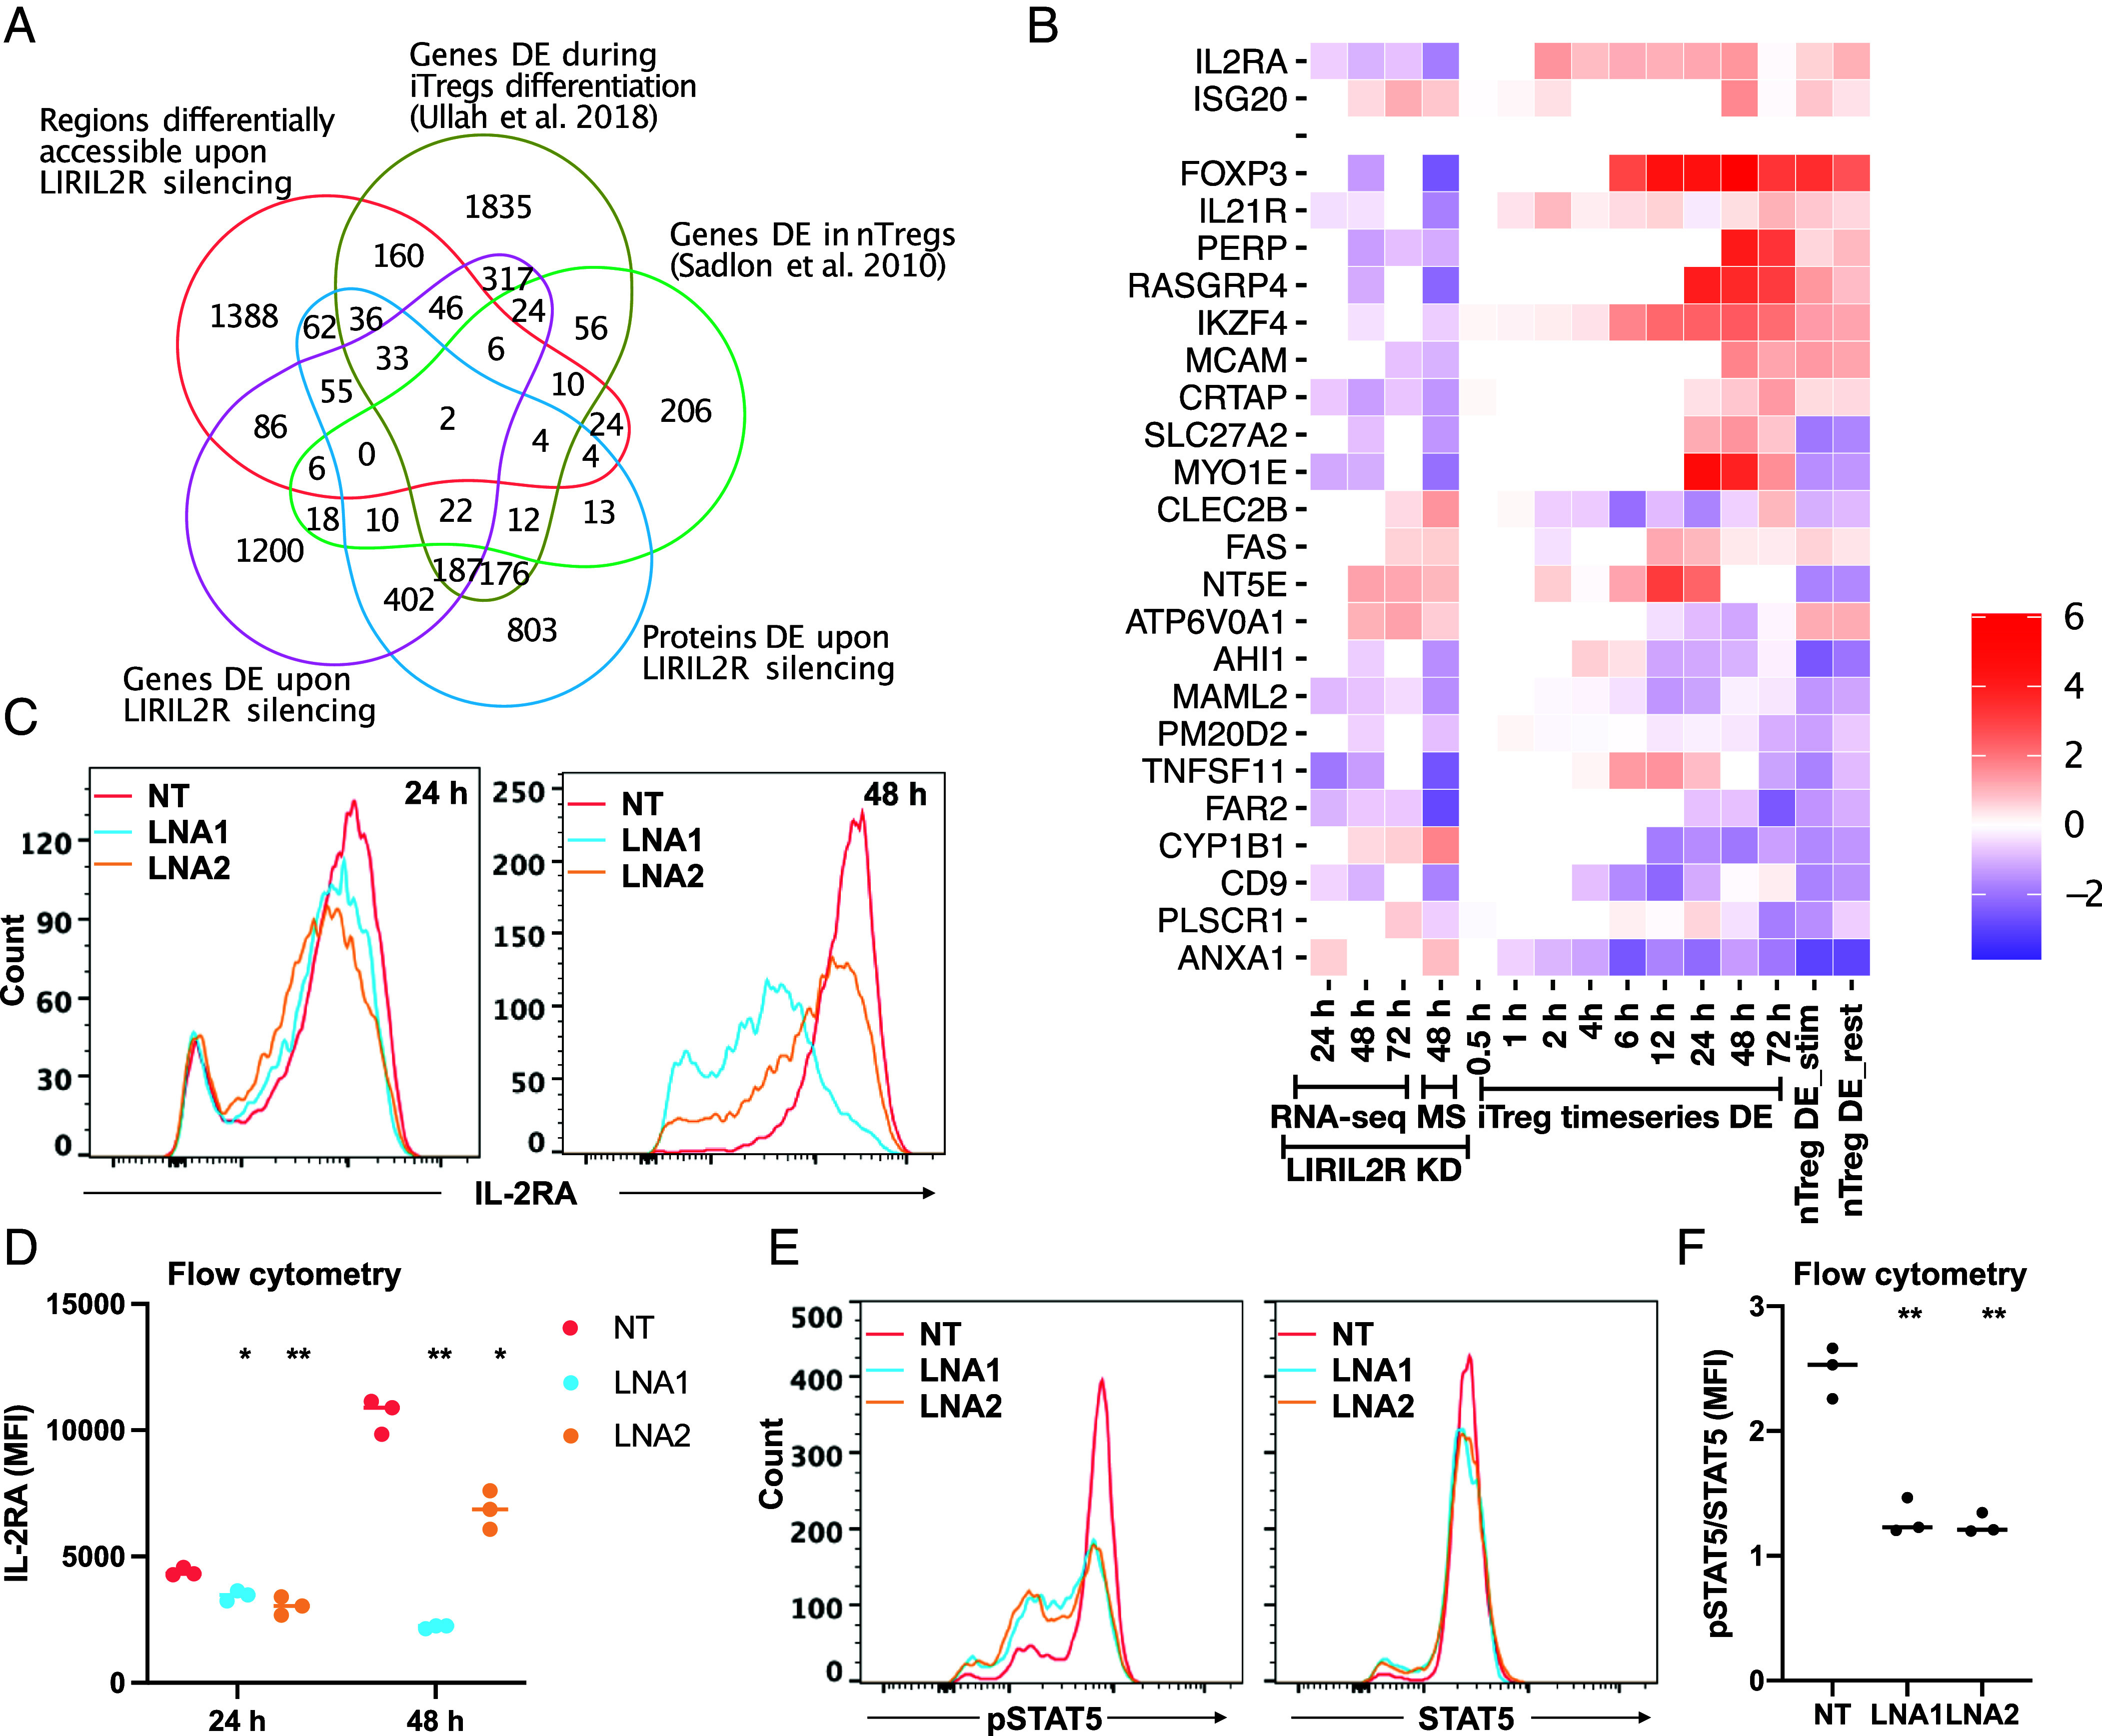
RNA-seq, ATAC-seq, and proteomics analyses identified IL2RA as a primary target of LIRIL2R. (A) The Venn diagrams show the overlap of LIRIL2R targets, the DE genes, the DE proteins the genes with differential ATAC-seq peaks and Treg-related genes as shown in the figure. (B) The heatmap shows expression of Treg-related LIRIL2R targets. The first three columns show the log2FC (compared to nontargeting control cells) upon LIRIL2R silencing from RNA-seq data at time points indicated at the Bottom and followed by a column LogFC obtained in proteomics data. The next nine columns show the log2FC of iTreg/Th0 expression in the time series data from our earlier study (7), and the remaining two columns show genes DE in nTreg as compared to other Th cells in resting or stimulated conditions (29). (C and D) The graphs show the effect of LIRIL2R silencing on IL-2RA protein surface expression in 24 h- and 48 h-cultured iTregs in a representative experiment (C). The quantification of three independent experiments, similar to the one shown in panel C, is shown in panel D. (E and F) NT and LIRIL2R-targeting LNA treated unactivated T cells were activated under iTreg culture condition for 48 h followed by cell harvesting and reactivation for 30 min under iTreg culture conditions, and thereafter phosphorylated and total STAT5 were measured using flow cytometry. Panel E shows a representative experiment, and panel F shows the MFI data from three independent experiments. In all dot plots, the horizontal lines show the median. In all panels, significance was determined by the paired two-tailed t test. *P < 0.05, **P < 0.01.
The nuclear localization of LIRIL2R suggested that it may have a direct function in the chromatin regulation of Treg cell differentiation. Thus, we used the assay for transposase-accessible chromatin with sequencing (ATAC-seq) analysis to measure the genome-wide chromatin accessibility of LIRIL2R-deficient iTregs. We identified 2,231 differentially accessible regions (DAR) in LIRIL2R-deficient cells treated with one or both LNAs (P < 0.01; FC > 1.5) targeting the transcript at 24 h or 72 h (Dataset S3). To identify the key Treg-specific LIRIL2R targets, we overlaid RNA-seq DE genes with proteomics targets and the gene’s ATAC-seq DARs along with the nTreg or iTreg genes identified earlier by us and others (7, 29). Using this approach, we identified 2 Treg-specific LIRIL2R targets (IL2RA and ISG20), where LIRIL2R regulated the accessibility as well as RNA and protein expression, and 22 targets, including FOXP3, where LIRIL2R did not regulate the chromatin accessibility but did affect the expression at RNA and protein levels (Fig. 4 A and B).
IL2RA appears to be among the primary targets of LIRIL2R as its expression was reduced upon LIRIL2R silencing at all three measured time points in the RNA-seq data as well as in the proteomics data. Further, there was a reduction in accessibility of IL2RA locus in LIRIL2R-deficient iTregs and IL2RA was up-regulated in natural Tregs (nTregs) (29) and iTregs (7) (Fig. 4B). Other targets of LIRIL2R that were up-regulated in nTregs (28) and iTregs (7) and down-regulated upon LIRIL2R silencing included the established Treg signature genes FOXP3, IKZF4, IL21R, MCAM, PERP, RASGRP4, and CRTAP (Fig. 4B). FOXP3 and IKZF4 are crucial TFs responsible for the regulatory function of Tregs (5). IL21R was down-regulated by LIRIL2R silencing in the RNA-seq and proteomics data, and was among the genes whose expression was up-regulated in iTregs (Fig. 4B). Interestingly, we previously observed reduced IL21R expression in Th17 cells (30). Among differentiated T cell subsets, Tregs have highest expression of IL21R (https://dice-database.org/). The high expression of IL21R in Tregs appears to be specific for humans as IL21R was not up-regulated in Tregs in mice (https://th-express.org/#browse). Among the genes down-regulated in nTregs and iTregs but up-regulated upon LIRIL2R silencing were CYP1B1, PLSCR1, and ANXA1 (Fig. 4B). These findings indicate that LIRIL2R regulates several genes important for the differentiation of Tregs.
LIRIL2R Silencing Led to General Loss of Treg Gene Expression Signature.
To dissect how LIRIL2R regulates Treg-related pathways, we analyzed RNA-seq data with 2,370 genes DE at any time point of the 72 h follow-up. We normalized the number of DE genes in a given category with the total number of genes expressed in our data in that category. The top categories of LIRIL2R targets were “cytokine” and “growth factor,” followed by “membrane receptors” and “ion channels” (SI Appendix, Fig. S5A). Several Treg-related Ingenuity Pathway Analysis (IPA) pathways, including T cell differentiation pathways and pathways related to autoimmune disease, such as Type 1 diabetes and systemic lupus erythematosus, were enriched among the LIRIL2R targets (SI Appendix, Fig. S5B and Dataset S4). In addition, several metabolism-related pathways were also enriched among the LIRIL2R targets. Beta oxidation of fatty acids, which is one of the major mechanisms Tregs employ to fulfill the energy demand (31, 32), was predicted to be down-regulated upon LIRIL2R silencing (Dataset S4).
To test how LIRIL2R silencing influences the overall iTreg-specific gene signature, we performed gene set enrichment analysis (GSEA), where we defined “iTregs signature genes” as those up-regulated in iTregs (48 h, FDR = 0.05, log2[FC] > 2), as we reported earlier (7). We ranked genes DE upon LIRIL2R silencing and then investigated whether iTreg signature genes lie at the top or bottom of the ranked list. The expression of iTreg signature genes was biased toward NT LNA-treated control samples at all three time points: 24 h, 48 h, and 72 h, indicating that LIRIL2R silencing led to a general loss of Treg transcriptome (SI Appendix, Fig. S5C).
To test the effect of LIRIL2R silencing on genes regulated by TGF-β, we performed a separate GSEA on gene sets up and down-regulated in CD4+ cells upon TGF-β treatment (GSE21670) (33). TGF-β induced up-regulated gene set was biased toward NT LNA-treated control samples (24 h), indicating that LIRIL2R silencing led to a reduction in the expression of a significant fraction of TGF-β-induced up-regulated genes (SI Appendix, Fig. S5D). The enrichment was not significant for TGF-β-induced down-regulated gene set (SI Appendix, Fig. S5D).
Reporter Metabolites Specific to Fatty Acids Were Altered in LIRIL2R-Deficient ITregs.
Recently, we developed genome-scale metabolic models of iTregs using genome-wide transcriptomics data (34). To understand the impact of LIRIL2R knockdown on the metabolism of iTregs, we constrained the previously developed models on the RNA-seq data of LIRIL2R-deficient and -sufficient iTregs. We performed reporter metabolite analysis to identify the metabolites that might be differentially regulated in LIRIL2R-deficient cells. We found that biosynthetic intermediates of the glycolysis (2-phospho-D-glycerate), phenylalanine, tyrosine, and tryptophan metabolism, and derivates of spermine and spermidine were up-regulated (P.adjusted < 0.05) in LIRIL2R-deficient cells (SI Appendix, Fig. S6A). In contrast, derivates of short-chain fatty acids (SCFAs: acetate, butyrate, propanoate), pentose-phosphate pathways (ribose-5-phosphate), lactate, and glycosphingolipids (e.g., ceramides) were down-regulated (SI Appendix, Fig. S6A). Intriguingly, overrepresentation analysis of reporter metabolite pathways showed that several pathways of fatty acid and glycosphingolipid metabolism were altered (hypergeometric test, q < 0.05) upon LIRIL2R deficiency (SI Appendix, Fig. S6B).
Treg-Related TFs Are Enriched at the Promoters of DE Genes.
To gain insights into the transcriptional regulation of LIRIL2R targets, we performed enrichment of TF binding site (TFBS) analysis separately on the promoters of genes up- or down-regulated in response to LIRIL2R silencing. Interestingly, Treg-related TFs, such as IKAROS and AIOLOS, were only enriched on the promoters of genes down-regulated upon LIRIL2R silencing, whereas the promoters of genes up-regulated were uniquely enriched for effector lineage-specific TFs, including STAT1/3/4, ETV3/5/6/7, AP-1 family TFs, JUN, FOS, and BHLHE40. Binding sites for NF-κB (c-Rel) and NF-κB (RelB:p52) were enriched on the promoters of down-regulated genes, whereas those for NF-κB (RelA:p65) were enriched on promoters of both the up- and down-regulated genes (SI Appendix, Fig. S7A and Dataset S5).
We also performed TFBS analysis on DARs. Motifs for STAT5A:STAT5B were preferentially enriched on the sites less open in LIRIL2R-deficient samples, consistent with the downregulation of Treg-related genes. Furthermore, motifs for SATB1 dimer were only enriched at the sites more open in LIRIL2R-deficient samples (SI Appendix, Fig. S7B), consistent with the negative regulation of Tregs by SATB1.
LIRIL2R Regulates IL2RA Levels and STAT5 Phosphorylation.
High levels of IL2RA expression are the hallmark of Tregs. During the initiation of iTreg differentiation, IL2RA is induced already at 2 h, i.e., before FOXP3, which is expressed at 6 h (Fig. 4B). IL-2RA triggering leads to phosphorylation of STAT5 through IL-2RA-associated Janus kinases (JAKs), followed by translocation of phosphorylated STAT5 to the nucleus and its binding at FOXP3 locus to induce its expression (35). Our results show IL2RA to be down-regulated by LIRIL2R silencing at all the three time points (Fig. 4B). Further, IL2-mediated signaling was inhibited upon LIRIL2R deficiency as predicted by IPA key-upstream regulator analysis of 24 h RNA-seq data (SI Appendix, Fig. S8A). In LIRIL2R-deficient cells (SI Appendix, Fig. S8B), we confirmed a remarkable downregulation of IL2RA at RNA and protein levels by both LNAs (Fig. 4 C and D and SI Appendix, Fig. S8C). Concurrently, STAT5 phosphorylation was also reduced in LIRIL2R-silenced iTregs (Fig. 4 E and F and SI Appendix, Fig. S8 D and E). We further explored whether the impact of LIRIL2R silencing on IL2RA and FOXP3 expression was exclusive to iTregs or also extended to nTregs. To investigate this, we isolated CD4+CD25+ nTregs from buffy coat samples and subjected them to LIRIL2R silencing using LNA1. Our analysis confirmed a significant downregulation of LIRIL2R expression in LNA1-treated cells (SI Appendix, Fig. S8E). Additionally, we observed a concurrent decrease in the expression levels of both IL2RA and FOXP3 in LIRIL2R-deficient nTregs (SI Appendix, Fig. S8E). These findings suggest that LIRIL2R likely exerts similar regulatory functions in both iTregs and nTregs.
LIRIL2R Directly Binds Upstream of IL2RA Promoter to Regulate Its Transcription.
Driven by the findings of the primarily nuclear localization of LIRIL2R (Fig. 2I and SI Appendix, Fig. S2 D and E) and downregulation of IL2RA in LIRIL2R-deficient iTregs, we next determined whether LIRIL2R directly binds upstream of IL2RA to regulate its transcription. We performed chromatin isolation by RNA purification, followed by sequencing (ChIRP-seq) in 48 h- cultured iTregs, using 19 tiling antisense probes covering all the regions of the transcript (SI Appendix, Table S4). We pooled them into two pools of odd and even probes and used these pooled probes in pull-down experiments. LIRIL2R RNA was clearly enriched in the pull-down samples than in input samples or samples pulled down by negative control probes antisense to LacZ (SI Appendix, Fig. S8F). To identify functionally relevant LIRIL2R binding sites, we selected ChIRP peaks with open chromatin and with H3K27ac mark (transcriptional activation signature) in LIRIL2R-deficient and sufficient iTregs. We identified 353 high-confident binding sites (FDR 0.01; Pileup > 5 and fold change over input > 5) with accessible chromatin and H3K27ac mark across the genome (Dataset S6). Over 75% of the peaks were located in intronic and intergenic regions (SI Appendix, Fig. S8G). The binding sites were equally distributed across 5′ and 3′ of transcription start sites (TSS), with some peaks detected as far as 200 Kb from TSS (SI Appendix, Fig. S8H).
Binding sites for many Treg-associated factors such as IRF4, AP1 factors, STAT5A, IKAROS, and PRDM1 were enriched on these 353 ChIRP peaks (SI Appendix, Fig. S8I), suggesting that LIRIL2R is perhaps recruited to these sites along with these TFs or it acts in concert with these factors. Importantly, ChIRP-seq analysis identified a LIRIL2R-binding site approximately 12 kb upstream from IL2RA promoter, which is a known enhancer region at IL2RA locus (36) (Fig. 5A).
Fig. 5.
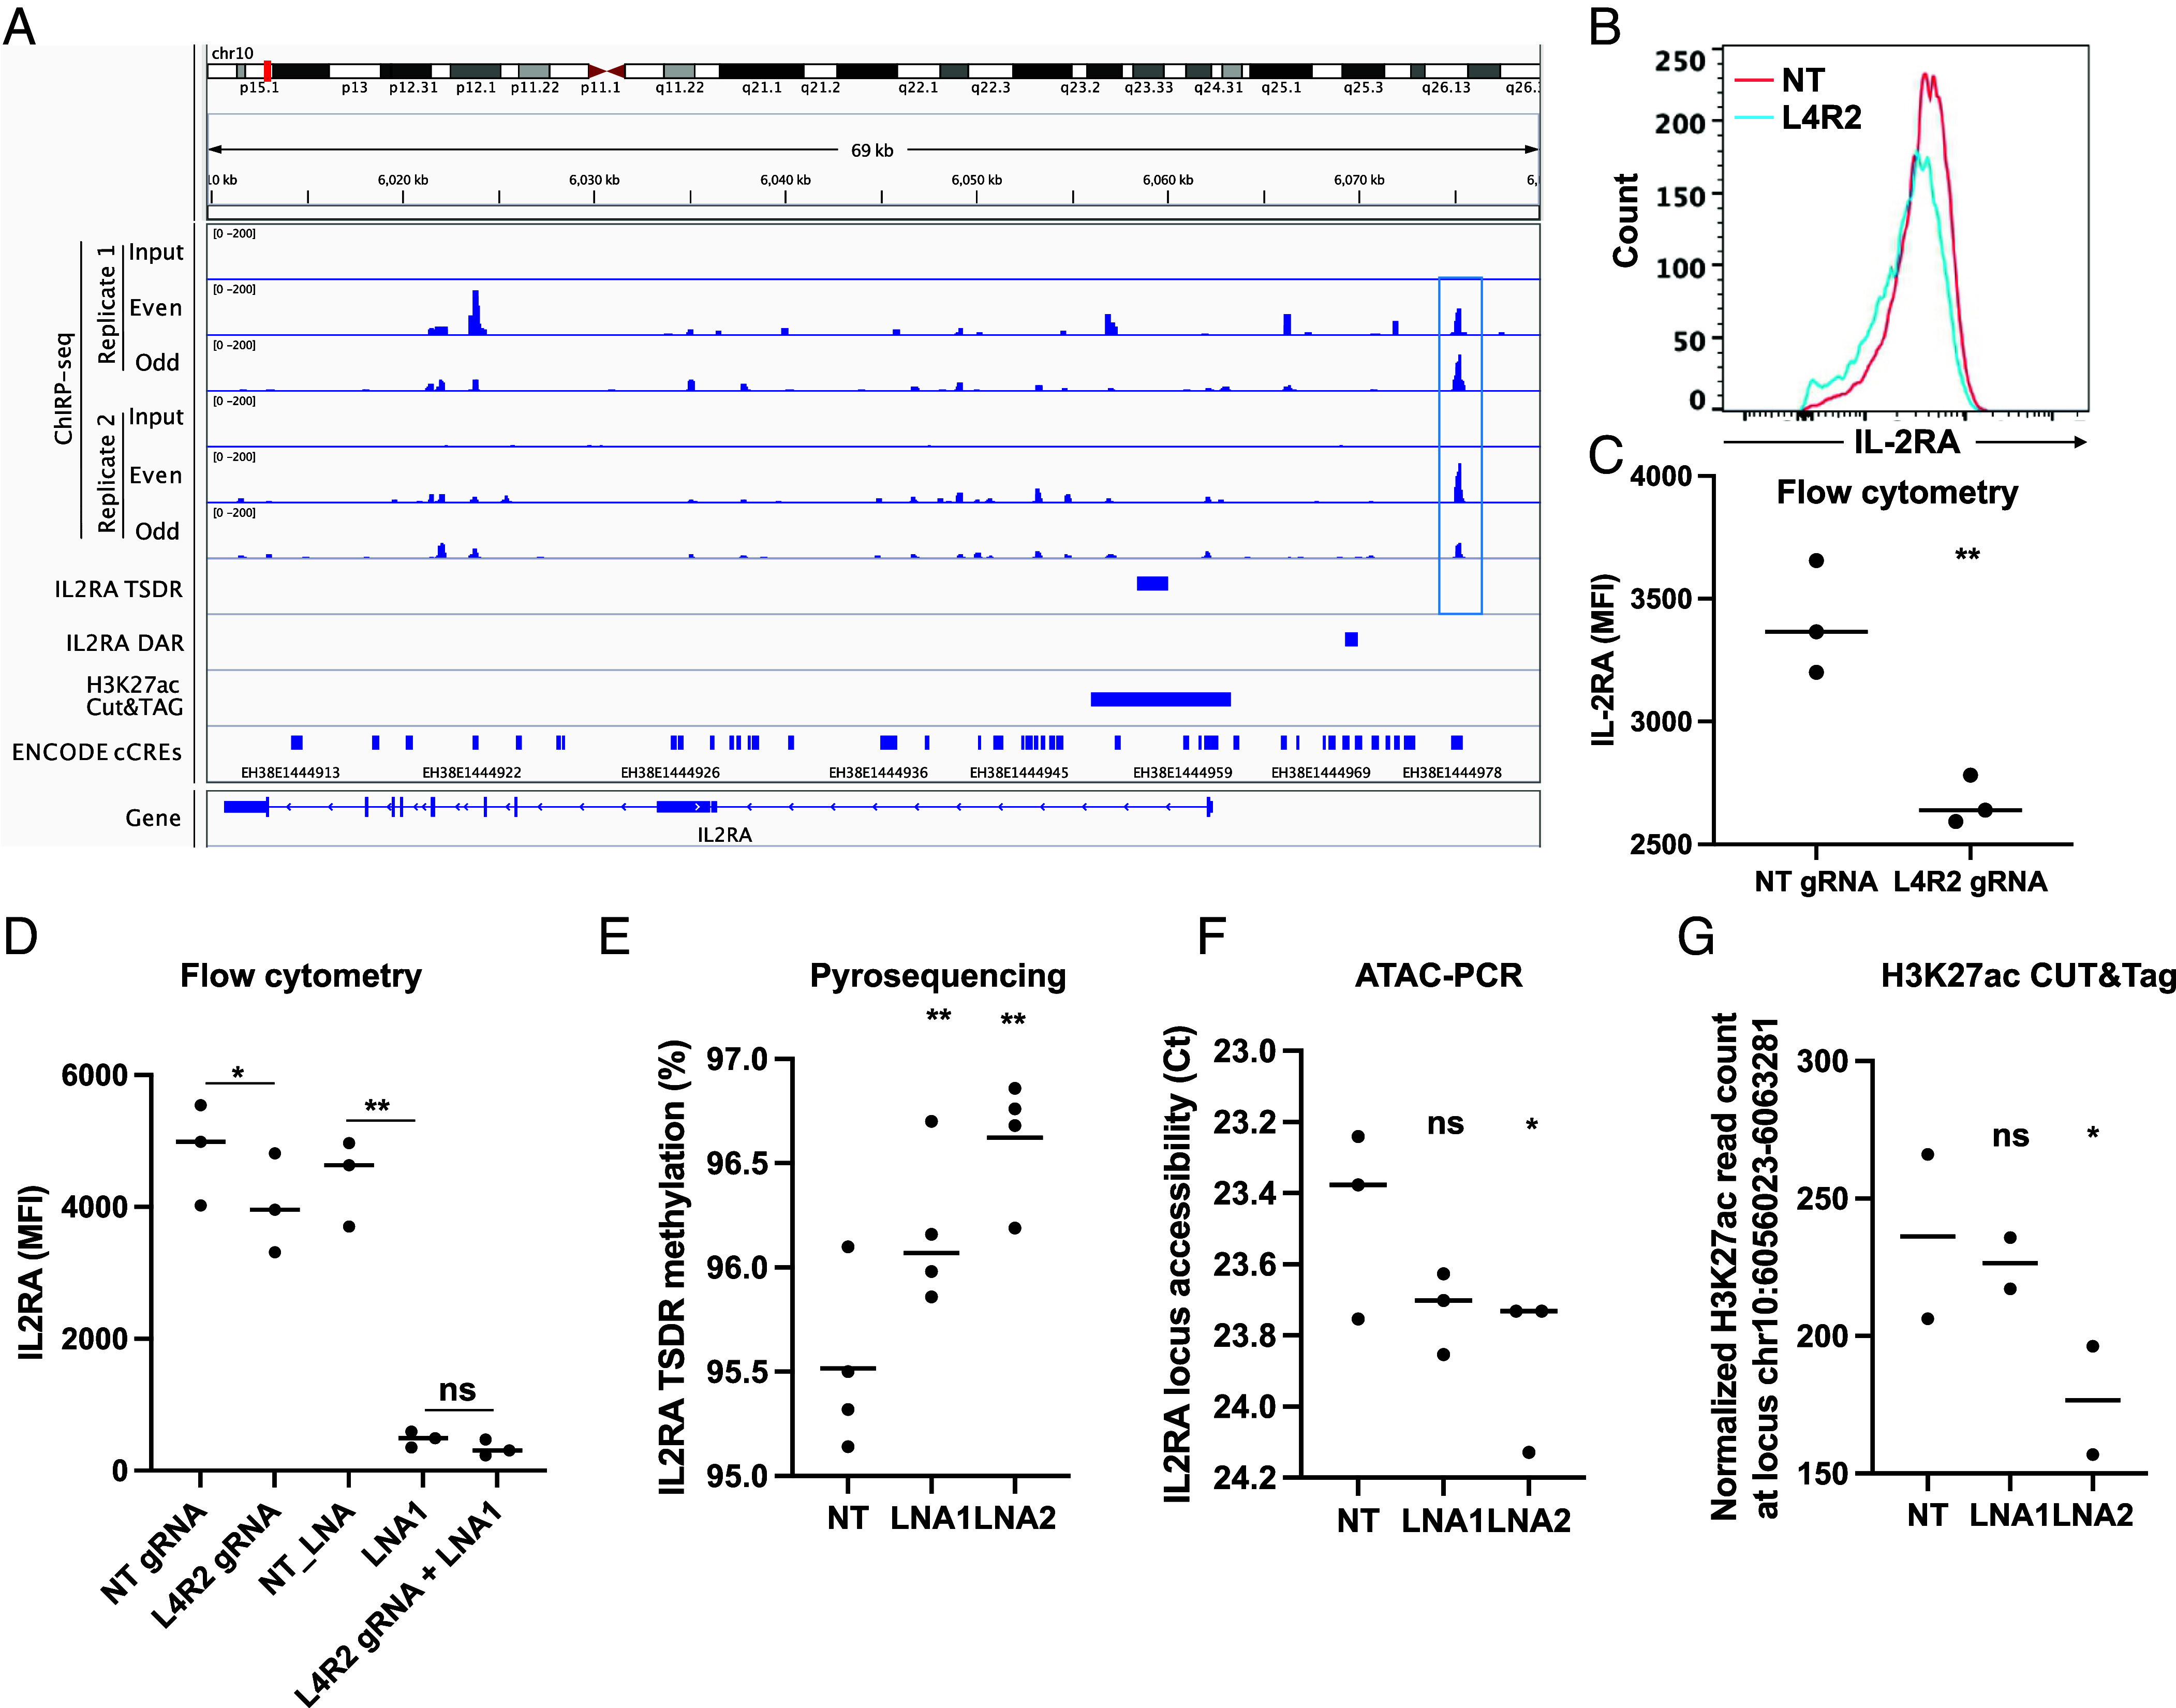
LIRIL2R binds upstream of IL2RA promoter and modulates its epigenetic landscape. (A) IGV browser shot showing the IL2RA locus. The highlighted region upstream of the promoter shows the region where LIRIL2R has occupancy in ChIRP-seq assay. The next track shows the Treg-specific DNA hypomethylation region at IL2RA locus. The next track shows the region on the IL2RA locus that was differentially accessible upon LIRIL2R silencing in ATAC-seq assays. The next track shows the region on the locus that was differentially acetylated (H3K27ac) upon LIRIL2R silencing in CUT&Tag-seq assays. (B and C) Data showing IL-2RA expression in CRISPR-edited iTregs (48 h), where ChIRP-peak region upstream of IL2RA has been targeted. Panel B shows a representative experiment and panel C shows the MFI data from three independent experiments. (D) The plot shows IL2RA surface expression under different experimental conditions shown on the x-axis, where cells were either treated with LIRIL2R-targeting LNAs or gRNAs targeting the LIRIL2R binding region upstream of IL2RA or a combination of LNA and gRNA, as obtained in three independent experiments. (E) The graph shows DNA methylation of IL2RA TSDR upon LIRIL2R silencing. (F) The graph shows the ATAC-qPCR validation of DAR at IL2RA locus shown in panel D. (G) The graph shows the normalized H3K27ac read count corresponding to the region shown in panel D, obtained from two replicates of CUT&Tag-seq experiments. In all dot plots, the horizontal lines show the median. The significance was determined using the paired two-tailed t test: *P < 0.05, **P < 0.01.
To examine whether the LIRIL2R-bound region at the IL2RA locus contributes to the expression of IL2RA, we used an in vitro assembled CRISPR-Cas9 approach targeting a region within the LIRIL2R ChIRP peak area. Cells were transfected with a pair of gRNA:Cas9 complex, where the two gRNAs (L4 and R2) were flanking a 270 bp-genomic region located within the LIRIL2R ChIRP peak area (Fig. 5A and SI Appendix, Fig. S9A). As a negative control, cells were transfected with nontargeting (NT) gRNA:Cas9 complex. While PCR amplification of the DNA from cells treated with NT-gRNA generated a single band of expected size (807 bp), the sample of cells treated with the L4/R2 gRNA pair resulted in three bands of about 800, 700, and 500 bp in size (SI Appendix, Fig. S9B). Sanger sequencing of the PCR products showed that the L4/R2 gRNA-treated sample contained a mixed population of edited cells with different insertions or deletions (indels), including cells with a complete deletion of the 270 bp targeted region, and unedited cells (SI Appendix, Fig. S9C). Importantly, the CRISPR-Cas9-mediated targeting of the LIRIL2R bound region led to a decrease in IL2RA expression by iTregs at 48 h (Fig. 5 B and C), suggesting that the targeted LIRIL2R peak region at the IL2RA locus is indeed important for the expression of IL2RA.
To test whether the effect of LIRIL2R on IL2RA is primarily mediated by its binding upstream of IL2RA promoter, we silenced LIRIL2R with LNA1 in cells where the LIRIL2R binding region has been deleted. The deletion of LIRIL2R bound region upstream of IL2RA led to a modest reduction in IL2RA expression (Fig. 5D), as shown earlier (Fig. 5 B and C). Further, silencing LIRIL2R expression with LNA1 led to a stronger reduction in IL2RA expression (Fig. 5D), similar to that shown earlier (Fig. 4 C and D). Interestingly, however, IL2RA expression in the cells where the LIRIL2R was silenced and the LIRIL2R binding region was simultaneously deleted was comparable to samples where the LIRIL2RA expression was silenced but the LIRIL2R binding region was intact (Fig. 5D). Further, the effect of LNA mediated silencing of LIRIL2R was much stronger than the effect of deleting the LIRIL2R binding region (Fig. 5D). This experiment indicated that the effect of LIRIL2R on IL2RA expression is only partially mediated by its binding upstream of IL2RA promoter.
To test whether LIRIL2R silencing affects the epigenetic landscape of IL2RA locus, we measured DNA methylation at IL2RA Treg-specific demethylated region (TSDR) near the IL2RA promoter (chr10: 6058401-6060000) (10), using pyrosequencing. We detected a small but highly significant increase in DNA methylation at the IL2RA TSDR in LIRIL2R-silenced iTregs (Fig. 5E). However, it remains to be examined whether the effect on IL2RA TSDR methylation was due to the binding of LIRIL2R upstream of IL2RA promoter. Notably, the IL2RA TSDR contains the binding sites for several Treg-related TFs, including IKZF1 and STAT5A (SI Appendix, Fig. S10), whose binding may be impacted by changes in the methylation at that locus leading to altered transcriptional state. We also studied chromatin accessibility and H3K27ac profile at the locus, using ATAC-seq and CUT&Tag-seq, respectively. Interestingly, we found a region upstream of IL2RA promoter to be less accessible upon the LIRIL2R silencing in an ATAC-seq experiment (Dataset S3), a finding which we validated using ATAC-PCR (Fig. 5F). Further, we found reduced levels of H3K27ac at IL2RA promoter in the LIRIL2R-silenced samples (Fig. 5G).
LIRIL2R Silencing Reduces Expression of the Inhibitory Receptors PD1 and CTLA4.
PD1 (encoded by PDCD1) is highly induced during iTreg differentiation starting at 6 h of differentiation (7), and it contributes to Treg generation and its suppressive function (37). Interestingly, PD1 expression was significantly down-regulated upon LIRIL2R silencing at 24 h in the RNA-seq data (Dataset S1), which we confirmed at the protein level (Fig. 6 A and B). Similarly, CTLA4 was also induced in iTregs starting at 48 h of differentiation (7). CD25+ FOXP3+ Tregs have higher CTLA4 expression than effector T cells (38), and CTLA4 depletion in Tregs leads to loss of suppression (39). To test whether LIRIL2R silencing leads to loss of CTLA4 expression, we measured intracellular and surface CTLA4 levels in LIRIL2R-deficient iTregs. LIRIL2R silencing led to significant reduction in intracellular CTLA4 expression (Fig. 6 C and D). A similar trend in the loss of surface CTLA4 expression was also observed (Fig. 6 E and F); however, iTregs were at best 10% positive for surface CTLA4, which is in agreement with an earlier study on ex vivo Tregs (40). These results suggest that the effect of LIRIL2R on the suppressive capacity of Tregs is, in part, mediated by PD1 and CTLA4.
Fig. 6.
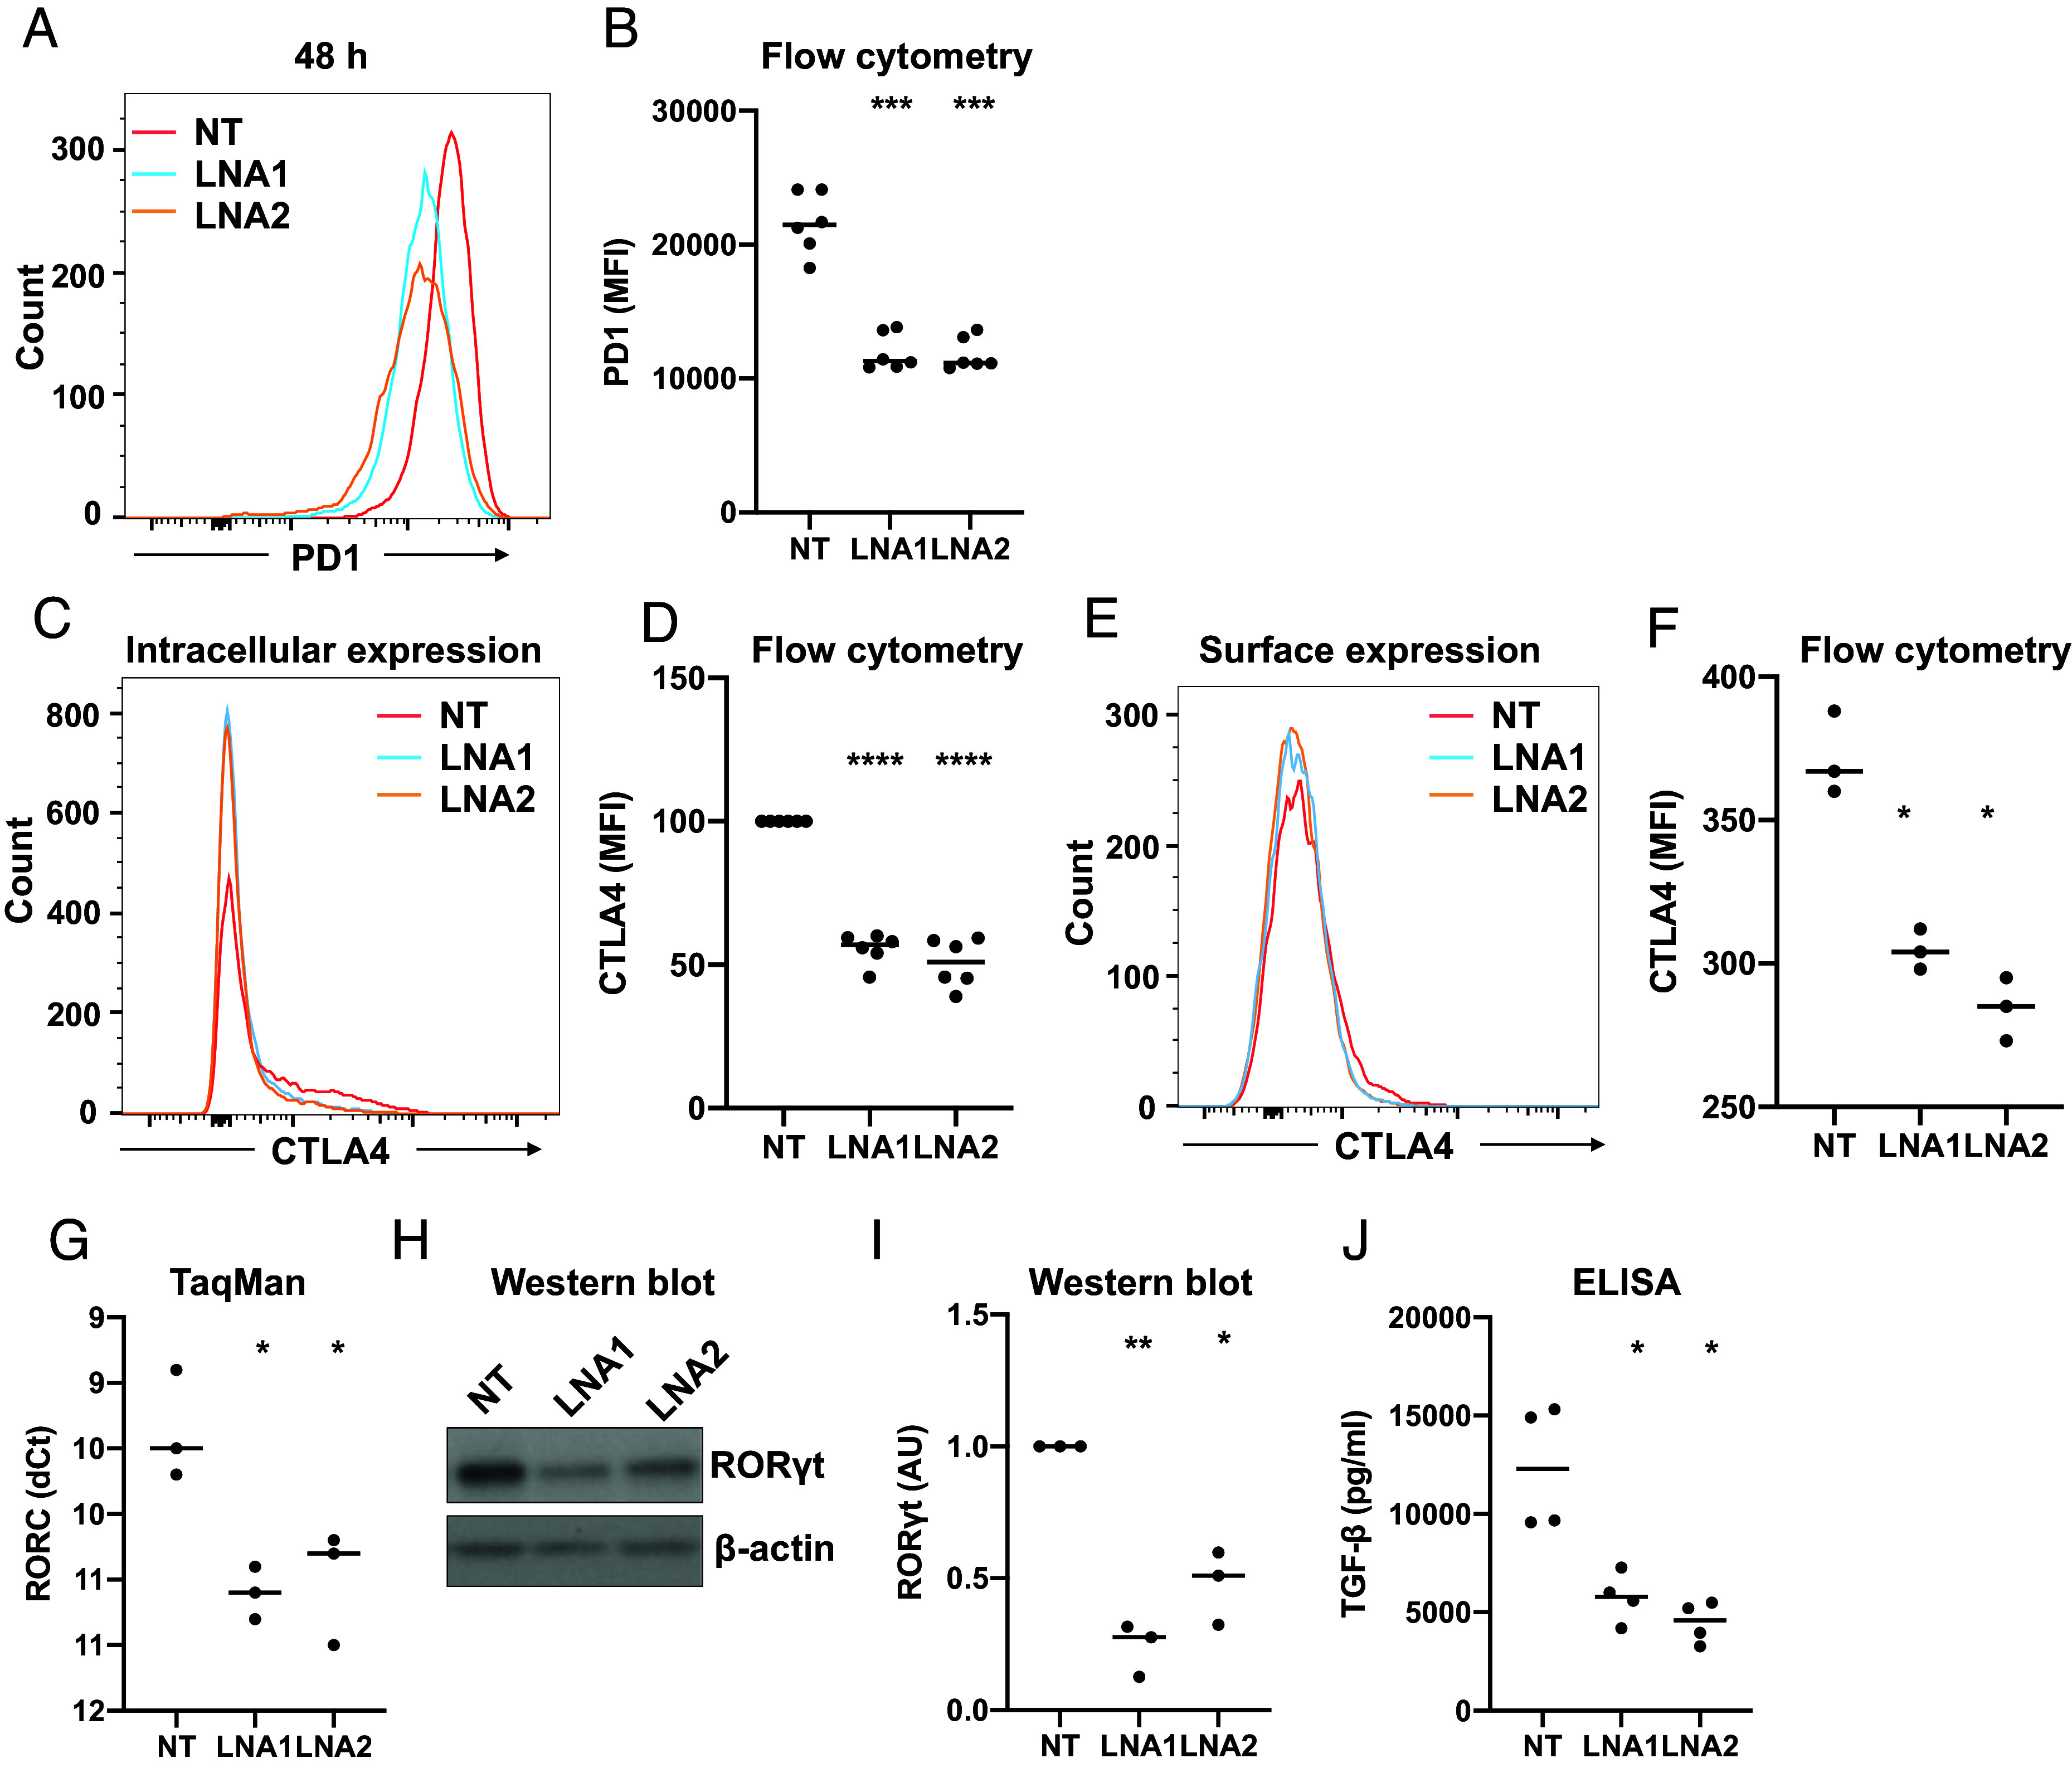
LIRIL2R regulates the expression of key Treg signature genes. (A and B) The effect of LIRIL2R silencing on PD1 surface expression in iTregs at 48 h in an individual experiment (A) and six biological replicates (B) are shown. (C–F) Intracellular (C and D) and surface (E and F) CTLA4 expression in LIRIL2R-sufficient and -deficient iTregs (48 h). The overlay histograms show an individual experiment, and the dot plots show the mean of 3 or 6 replicates. (G–I) The graphs show the effect of LIRIL2R silencing on expression of RORC mRNA (G) and protein (H and I) at 48 h. An individual western blot image is shown in panel H, whereas quantitation of three replicates is shown in panel I. The western blot images from the other two replicates are shown in SI Appendix, Fig. S11A. (J) The dot plot shows the effect of LIRIL2R silencing on secreted TGF-β expression in the culture supernatant at 72 h. The statistical significance in all panels was determined using the paired two-tailed t test: *P < 0.05, **P < 0.01, ***P < 0.001, ****P < 0.0001. In the dot plots, the horizontal lines show the median.
LIRIL2R Silencing Affects ROR-γt Expression and TGF-β Secretion by iTregs.
ROR-γt-positive Tregs are more suppressive than ROR-γt-negative Tregs (41). Interestingly, we found downregulation of RORC (gene coding for ROR-γt) upon LIRIL2R silencing in the RNA-seq data (Dataset S1), a finding that was further confirmed for the RNA and protein levels (Fig. 6 G–I and SI Appendix, Fig. S11A). Further, LIRIL2R-deficient iTregs showed a marked decrease in TGF-β secretion (Fig. 6J).
LIRIL2R Silencing Leads to Upregulation of Th2 TFs GATA3 and SATB1.
A mutation in the forkhead DNA-binding domain of the FOXP3 gene resulted in an impaired Treg program and generation of Th2-like Tregs (42). The Th2 cytokine IL-13, which we found to be down-regulated in iTregs in our previous study (7), was up-regulated upon LIRIL2R silencing in the RNA-seq data at 72 h (Dataset S1). To test whether the LIRIL2R silencing-mediated FOXP3 deficiency renders these iTregs Th2-like, we measured the expression of Th2-specific TF GATA3 in LIRIL2R-deficient iTregs. GATA3 protein expression was indeed up-regulated at 24 h and 48 h after LIRIL2R knockdown (Fig. 7 A and B and SI Appendix, Fig. S11B).
Fig. 7.
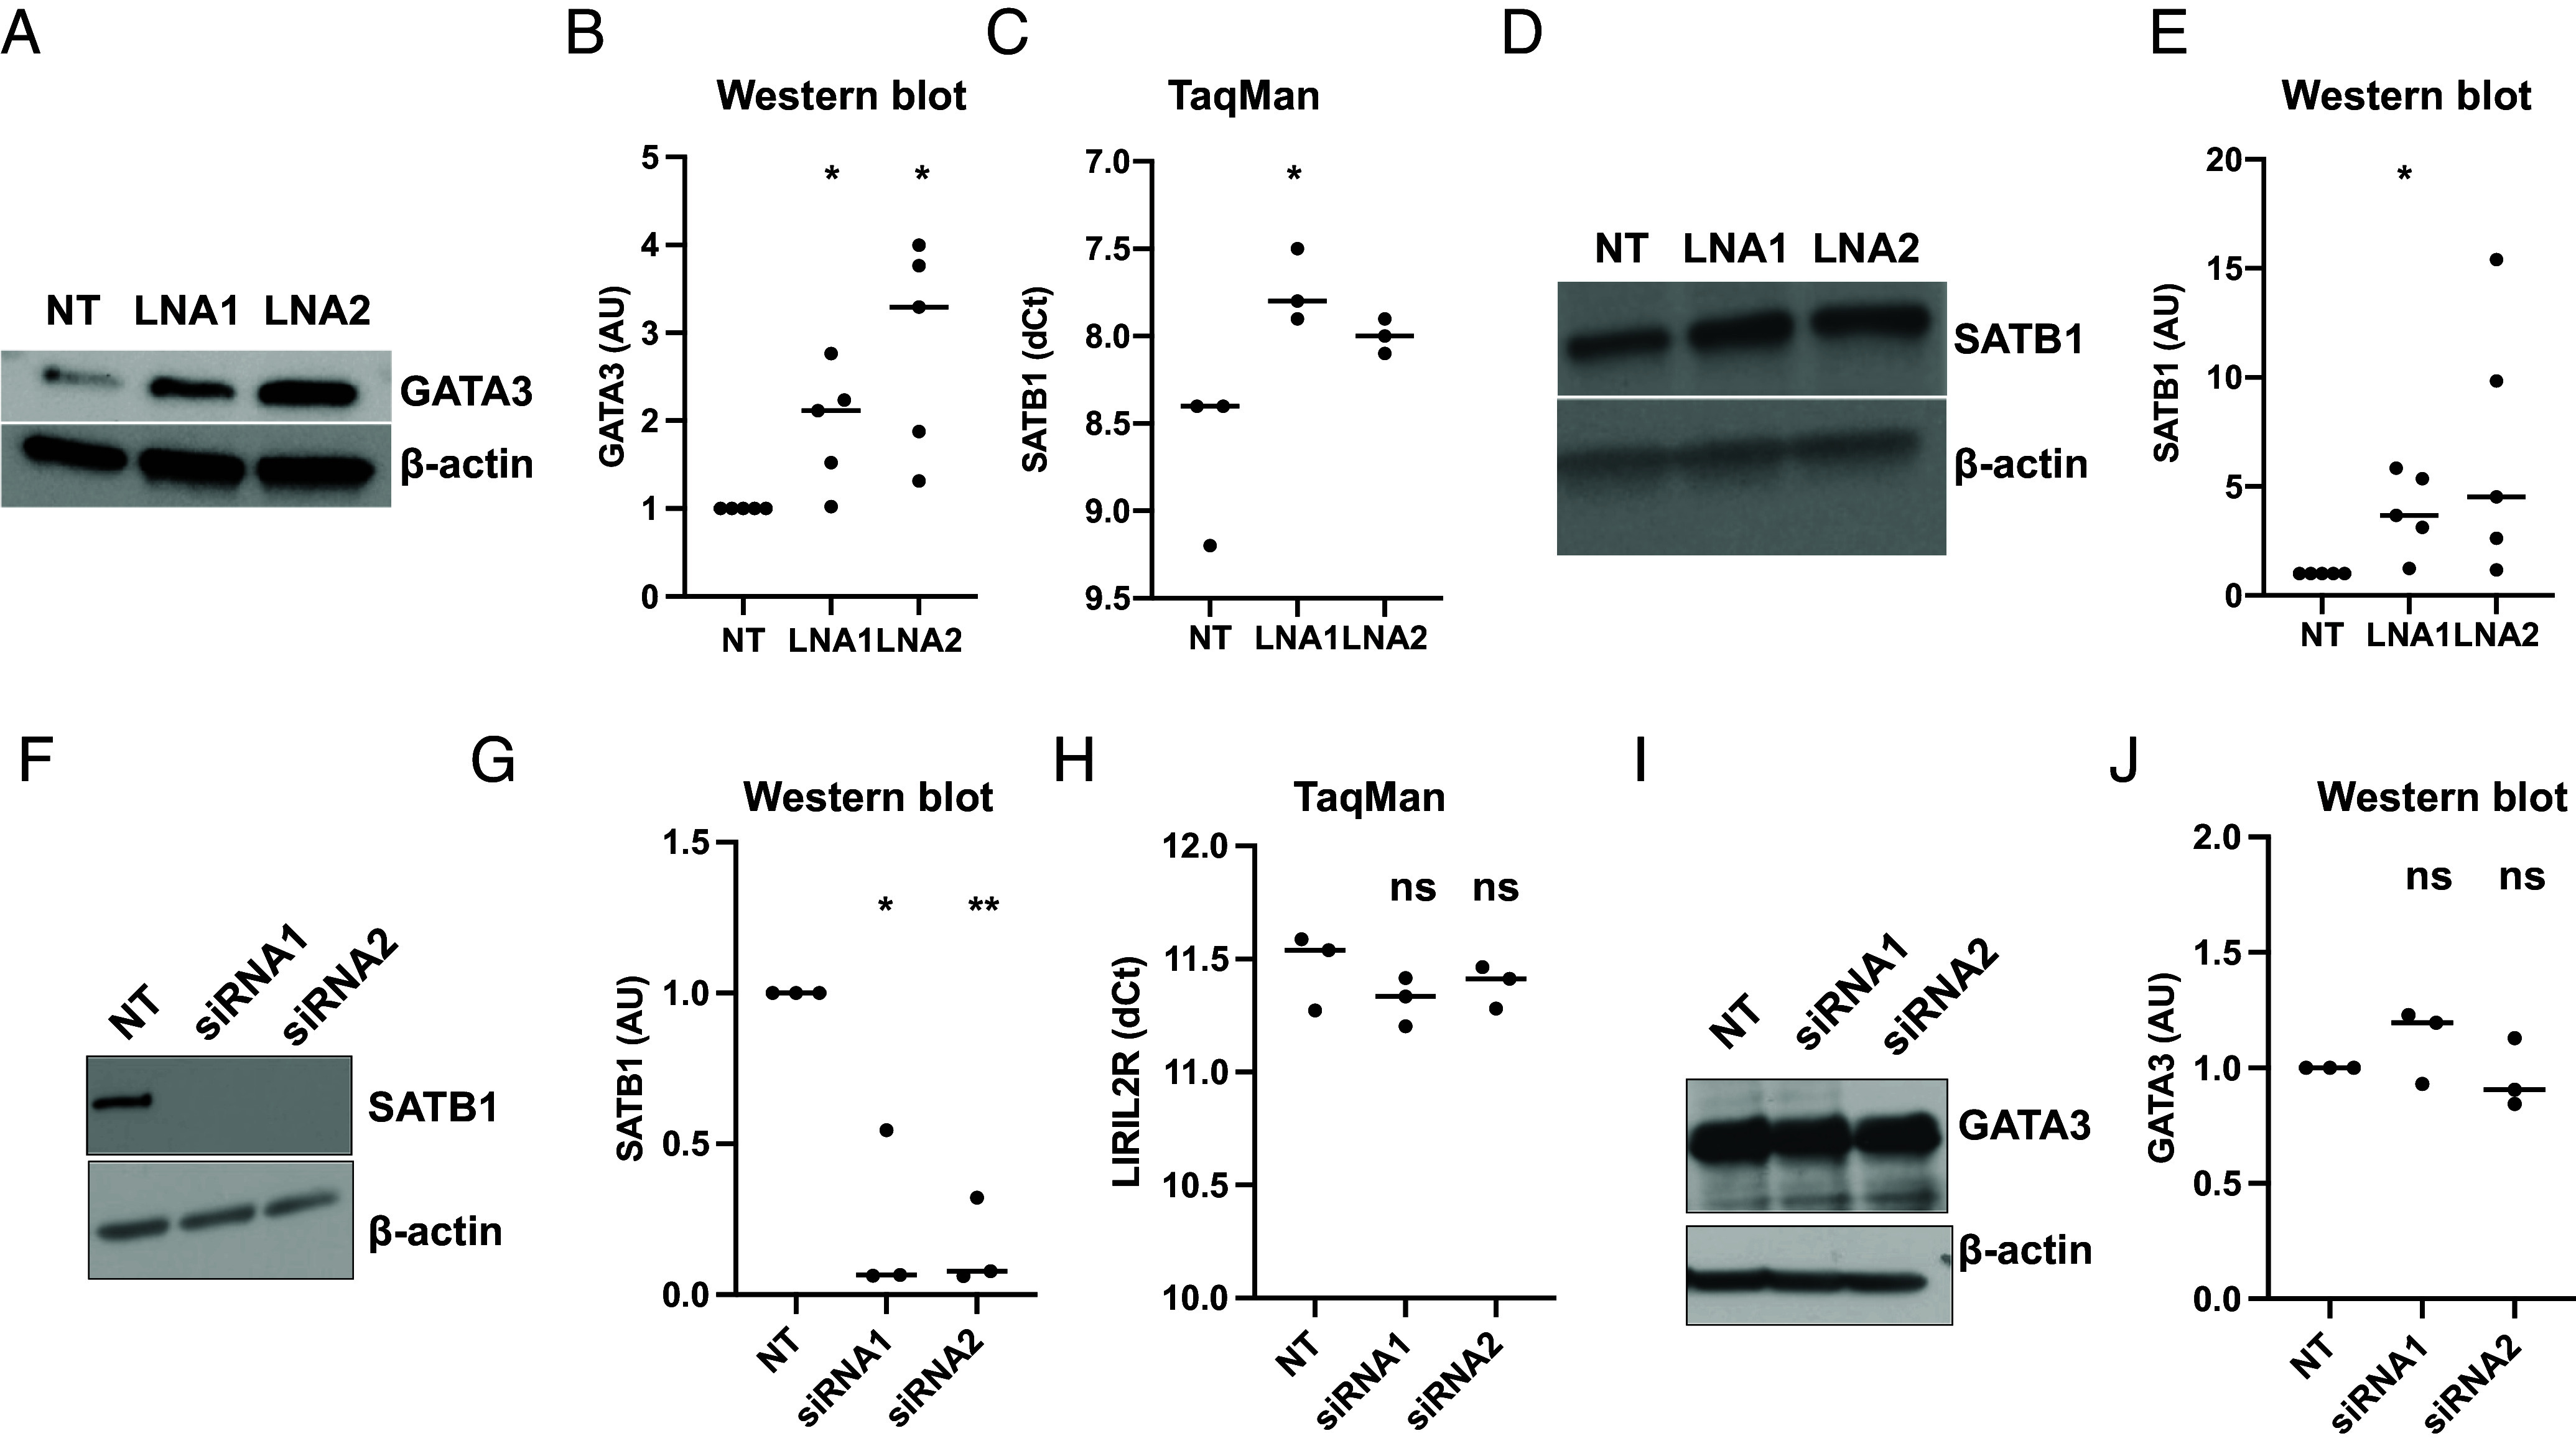
LIRIL2R silencing up-regulates the expression of Th2 TFs SATB1 and GATA3 in iTregs. (A and B) The data show the effect of LIRIL2R silencing on GATA3 protein expression, measured by western blotting, at 24 h during iTreg differentiation. An individual western blot image is shown in panel A, whereas quantitation of five replicates is shown in panel B. The western blot images from other replicates are shown in SI Appendix, Fig. S11B. (C–E) The graph is showing the effect of LIRIL2R silencing on expression of SATB1 mRNA (C) or protein (D and E), in 12 h cultured iTregs. An individual western blot image is shown in panel D whereas quantitation of five replicates is shown in panel E. The western blot images from other replicates are shown in SI Appendix, Fig. S11C. (F and G) The figures show the silencing efficiency of STAB1 siRNAs at 48 h. An individual western blot image is shown in panel F whereas quantitation of three replicates is shown in panel G. The western blot images from other replicates are shown in SI Appendix, Fig. S11D. (H) The figure shows the effect of SATB1 silencing on LIRIL2R at 48 h. (I and J) The graphs show the effect of STAB1 silencing on GATA3 at 48 h. An individual western blot image is shown in panel I, whereas quantitation of three replicates is shown in panel J. The western blot images from other replicates are shown in SI Appendix, Fig. S11E. Statistical significance was determined by the paired two-tailed t test. *P < 0.05, **P < 0.01, ns: nonsignificant. In the dot plots, the horizontal lines show the median.
Another Th2 supporting factor SATB1, that up-regulates GATA3 by recruiting beta-catenin and p300 acetyltransferase on GATA3 promoter and influences Th2 lineage commitment and production of Th2-specific cytokines IL-4, IL-5, and IL-13 (43), was up-regulated in LIRIL2R-deficient iTregs at both the RNA and protein levels at 12 h (Fig. 7 C–E, SI Appendix, Fig. S11C, and Dataset S1). Notably, other studies showed that in differentiated Tregs, SATB1 repression was crucial for keeping GATA3 in control and inhibiting effector cell differentiation (44). Since the effect of LIRIL2R knockdown on SATB1 expression was seen earlier (at 12 h) than the effect on GATA3 expression (at 24 h), we hypothesized that the effect of LIRIL2R on GATA3 could be mediated through SATB1. However, silencing of SATB1 (Fig. 7 F and G and SI Appendix, Fig. S11D) did not affect the expression of LIRIL2R (Fig. 7H) or GATA3 (Fig. 7 I and J and SI Appendix, Fig. S11E) in iTregs. Further to test whether the effect of LIRIL2R on GATA3 is dependent on SATB1, we performed double-silencing of LIRIL2R and SATB1 in iTregs and measured LIRIL2R expression. LIRIL2R and SATB1 were silenced with LNA1 and siRNA1, respectively (SI Appendix, Fig. S11 F–H). As earlier, SATB1 silencing did not affect GATA3 expression (SI Appendix, Fig. S11G) and LIRIL2R silencing increased GATA3 expression (SI Appendix, Fig. S11H). Furthermore, dual silencing of LIRIL2R and SATB1 did not change the expression of GATA3 as compared to that of only LIRIL2R silenced cells (SI Appendix, Fig. S11H), indicating that effect of LIRIL2R on GATA3 expression is independent of SATB1.
Discussion
We identified a gene encoding a lincRNA LIRIL2R that binds upstream of IL2RA and positively regulates its expression. LIRIL2R silencing led to alterations in the epigenetic landscape of IL2RA locus, including an increase in TSDR methylation and a decrease in chromatin accessibility and histone acetylation. CRISPR-mediated deletion of LIRIL2R binding region upstream of IL2RA promoter led to a clear reduction in the expression of IL2RA, suggesting that the LIRIL2R binding region indeed contributes to IL2RA expression. The silencing of LIRIL2R resulted in subtle alterations in the epigenetic profile of the IL2RA locus, while the impact on IL2RA expression was substantial. This suggests that LIRIL2R silencing may also exert its influence on IL2RA expression through alternative mechanisms that are yet to be elucidated. Our data further suggest that this reduced IL2RA, in turn, affects the phosphorylation of STAT5 and expression of downstream genes. LIRIL2R deficiency led to reduced expression of Treg-signature genes (e.g., FOXP3, CTLA4, and PDCD1), upregulation of genes associated with effector T cells (e.g., SATB1 and GATA3), and loss of Treg-mediated suppression. This study identified LIRIL2R as a key player in Treg differentiation and function. Modulating expression of LIRIL2R may lead to better therapeutic strategies for autoimmunity and cancer.
Signaling through IL-2R has a critical role in Treg function: conditional removal of IL-2Rα (CD25) or IL-2Rβ (CD122) in Tregs leads to lethal autoimmunity, similar to Foxp3-deficient scurfy mice (35, 45). Tregs require continuous IL-2R signaling for their survival, lineage maintenance, and suppressor function. Our results suggest that the effects of LIRIL2R on FOXP3 and suppressive capacity are through IL-2R signaling, as a significant defect on pSTAT5 levels was observed upon LIRIL2R silencing. Reduced IL-2RA levels in LIRIL2R-deficient iTregs would also hamper their competitive advantage in taking up IL-2 from the extracellular milieu leading to loss of suppressive capacity. Further, downstream effects of LIRIL2R, including regulation of SATB1 and CTLA4 are probably mediated through FOXP3 as FOXP3 regulates the expression of these genes (44, 46).
Other mechanisms for the suppressive function of Tregs include CTLA4-mediated inhibition of T cell activation, Treg-derived TGF-β secretion, and adenosine-mediated suppression of effector T cells. CTLA4 is critically required for in vivo and in vitro suppression by Tregs, which is mediated at least in part by downregulation of CD80 and CD86 on antigen-presenting cells (47). LIRIL2R also affects this module of suppressive mechanism by regulating CTLA4 expression. TGF-β was essential for suppressive function of Tregs (48, 49), and we found that LIRIL2R silencing reduces TGF-β secretion by iTregs, suggesting that the loss of suppression in LIRIL2R-deficient cells could partly be due to reduced TGF-β production. In contrast, LIRIL2R silencing did not reduce CD73 or CD39 expression, the genes encoding ecto-5′-nucleotidase and ectonucleoside triphosphate diphosphohydrolase-1 enzymes required for extracellular adenosine generation and involved in adenosine-mediated suppression.
Short-chain fatty acids, which we found to be down-regulated in LIRIL2R-deficient iTregs, are produced by gut microbes that are involved in the regulation of T cell differentiation into effector and regulatory T cells (50). In addition, mice and human studies showed that SCFAs are essential regulators of iTregs. SCFAs potentiated the development of functional human iTregs (51). These results suggest that LIRIL2R deficiency might decrease the synthesis of SCFAs, which in turn impairs the functional development and augmentation of iTregs.
Loss of LIRIL2R increases expression of GATA3 and IL-13, the key TF and characteristic cytokine for Th2 cells, respectively. This is likely to make the cells more prone toward Th2 lineage. Additionally, SATB1, which is a global chromatin organizer and supports Th2 differentiation (43), was up-regulated in LIRIL2R-deficient iTregs. Thus, it is possible that increased expression of SATB1 in LIRIL2R-deficient iTregs leads to a change in chromatin organization that favors development of Th2-cell gene expression program. Interestingly, among the Th cell subsets, LIRIL2R had lowest expression in Th2 cells (Fig. 2B), in line with this idea. However, the possible role of LIRIL2R in regulating Th2 differentiation remains to be studied.
Based on comprehensive analysis of the data presented here, several key observations emerged. First, IL2RA expression consistently showed a reduction across all three measured time points in both the RNA-seq and proteomics datasets upon silencing of LIRIL2R. Additionally, we observed alterations in the accessibility and DNA methylation patterns of the IL2RA locus in LIRIL2R-deficient iTregs. Moreover, the presence of a high-confidence binding site upstream of IL2RA, coupled with its established role in regulating genes important for Tregs, such as FOXP3, CTLA4, and PDCD1, led us to speculate that IL2RA is one of the primary targets of LIRIL2R. However, it is important to note that the RNA-seq and DIA proteomics analyses revealed a substantial number of targets affected by LIRIL2R deficiency. Additionally, LIRIL2R was found to bind to hundreds of loci, suggesting the possibility of direct regulation of Treg signature genes. Therefore, while we here focused on IL2RA as a LIRIL2R target, it is likely that LIRIL2R exerts its regulatory influence on multiple targets.
It remains to be determined whether LIRIL2R binding upstream of IL2RA is responsible for changing the epigenetic landscape of the locus. In addition, the effect of LIRIL2R silencing on IL2RA expression was much stronger than the effect observed from the CRISPR-Cas9-mediated deletion of LIRIL2R bound region upstream of IL2RA, suggesting that LIRIL2R regulates IL2RA expression with yet unknown mechanisms, warranting further studies. Identification of putative protein interactors of LIRIL2R may shed further mechanistic insights into its function. Further, the contribution of LIRIL2R to human immune-mediated diseases remains to be studied. Since most of the current gene expression studies do not quantify LIRIL2R expression owing to lack of its annotation in the databases, the data on its expression in different diseases are unexplored. Furthermore, lack of a mouse homolog of LIRIL2R limits our ability to perform in vivo experiments.
Materials and Methods
CD4+ Cell Isolation, Differentiation to iTregs, and Suppression Assay.
CD4+ T cell isolation and culture have been described previously (7).
Identification of LIRIL2R.
The transcript was identified from RNA-seq reads and then confirmed using RACE-PCR and regular PCR followed by Pacific Bio long read sequencing and northern blotting. Please see SI Appendix for details.
ChIRP-seq Sample Preparation and Data Analysis.
A total of 19 ChIRP probes (SI Appendix, Table S4) tiling LIRIL2R were designed at BIOSEARCH TECHNOLOGIES. ChIRP was performed as described earlier (52).
Gene Knockdown.
LIRIL2R was silenced using two Locked Nucleic Acid-modified gapmer antisense oligonucleotides (LNA) (QIAGEN) as described previously (22). SATB1 and SMAD2/4 were silenced using siRNAs (SI Appendix, Table S3). Four million cells were transfected with siRNAs or LNAs using nucleofection system. Please see details in SI Appendix.
CRISPR-Cas9-Mediated DNA Edition.
Guide RNAs (gRNAs) were in vitro-assembled with the Cas9 protein and nucleofected as described (53). gRNA-treated cells were cultured under iTreg culture condition for 48 h followed by cell harvesting and DNA extraction. A 807 bp long genomic region, including the CRISPR targeted region, was PCR amplified using the KAPA HiFi HotStart PCR Kit (#KR0369, Roche). Generated PCR products were analyzed on 1.2% agarose gel, and bands were cut out and DNA was extracted and then analyzed by Sanger Sequencing. Please see details in SI Appendix.
Intracellular Staining and Flow Cytometry.
Intracellular staining was performed with buffer sets of the Human Regulatory T Cell Staining Kit (eBioscience/ThermoFisher Scientific, Cat# 88-8999-40) by following the manufacturer’s protocol. Samples were acquired by BD LSR II or BD LSR Fortessa analyzer (BD Biosciences, Franklin Lakes, NJ) and analyzed either with FlowJo (BD). For viability staining, the cells were stained with ANNEXIN-V and PI as described (54).
Western Blotting.
Western blotting was performed as described earlier (54).
RNA Isolation and TaqMan Assay.
RNA isolation and TaqMan assay were performed as described earlier (22). Relative expression was calculated using formula 10000*2^-dCt. TaqMan primers are shown in SI Appendix, Table S2.
RNA-seq Sample Preparation and Data Analysis.
Libraries for RNA-seq were prepared using Illumina TruSeq® Stranded mRNA Sample Preparation Guide. The data were pseudoaligned with kallisto (55). Differential expression analysis on the kallisto-quantified count data between NT and LIRIL2R LNA-treated samples was performed using sleuth (56). Genes with FDR 0.05; FC >1.5; TPM (gene level) >=1 were considered significant. For more details, please see SI Appendix.
Sample Preparation for Proteomics Protein Identification and Quantification.
Sample preparation and s-trap mass spectrometry was performed as described earlier (57). For more details, please see SI Appendix.
Analysis of TF Binding Sites, Pathway Analysis, and GSEA.
Overrepresentation of TFBS was determined with a commercial version of an Fmatch tool at the TRANSFAC database (Release 2020.1). Pathway analysis was performed using IPA (https://www.ingenuity.com/). The enrichment in LIRIL2R-deficient RNA-seq data was calculated using GSEA tool (58).
CUT&Tag Sample Preparation and Data Analysis.
CUT&Tag was performed as described earlier (59). Alignment, sorting, filtering, and deduplication for the CUT&Tag analysis was performed using Bowtie2 (v2.3.5.1) (60), Samtools (v1.9) (61), and Picard (http://broadinstitute.github.io/picard/) MarkDuplicates (v2.21.7) with the same parameters as described in the ATAC-seq analysis. However, no removal of reads from ENCODE blacklist regions was done before deduplication.
RNAScope.
RNAScope experiments were performed using the RNAScope multiplex fluorescent reagent kit v2 ACD a Bio-Techne brand (Cat# 323100), following the manufacturer’s recommendations.
Genome-Scale Metabolic Models.
Previously developed genome-scale metabolic models of iTregs (34) was contextualized using transcriptomics data for LIRIL2R-deficient and sufficient iTregs using t-INIT algorithm as discussed earlier (62). Reporter metabolite analysis was performed using the “reporterMetabolites” function of the RAVEN 2.0 suite (63).
ATAC-seq Sample Preparation and Data Analysis.
ATAC-seq was performed as described (64) with some modifications. Data analysis was performed as described earlier (22). Differentially accessible regions were identified using limma (v3.42.2) R package (65) with |logFC| > 1 and a P-value < 0.01.
Statistical Inference and Plotting.
Unless stated otherwise, the data were plotted using Prism version 9, and the statistical significance of mean was determined by the two-tailed paired t test.
Ethical Approval.
The Ethics Committee of Hospital District of Southwest Finland approved the usage of blood from anonymous donors.
Supplementary Material
Appendix 01 (PDF)
Dataset S01 (XLSX)
Dataset S02 (XLSX)
Dataset S03 (XLSX)
Dataset S04 (XLSX)
Dataset S05 (XLSX)
Dataset S06 (XLSX)
Acknowledgments
We would like to thank Professor Irving L. Weissman from Stanford University for support, feedback, and fruitful scientific discussions during this project. We would also like to thank Professor Mark Ansel and Dr. Sanjeev Galande for reviewing our manuscript and providing constructive suggestions for improvements. We acknowledge the core facilities at Turku Bioscience Centre: The Finnish Functional Genomics Centre, Cell Imaging and Cytometry Core, and Proteomics Facility, supported by Biocenter Finland, for their assistance in next-generation sequencing, flow cytometry and imaging, and mass spectrometry analyses, respsectively. The Finnish Centre for Scientific Computing is duly acknowledged for its efficient servers and data analysis resources. R.L. is supported by Centre of Excellence in Molecular Systems Immunology and Physiology Research (2012 to 2017) grant 250114; Academy of Finland grants 250114, 292335, 294337, 292482, 319280, 329277, 331793, 335435, and 31444; Juvenile Diabetes Research Foundation grant; the Novo Nordisk Foundation grant NNF19OC0057218; Jane and Aatos Erkko Foundation grant; and the Finnish Cancer Foundation grant. L.L.E. is supported by European Research Council ERC 677943, European Union’s Horizon 2020 research and innovation programme 955321; and Academy of Finland grants 310561, 314443, 329278, 335434, 335611, and 341342. R.L. and L.L.E. were supported by the Sigrid Juselius Foundation, Turku Graduate School University of Turku, Åbo Akademi University InFLAMES Flagship Programme of the Academy of Finland 337530, Biocenter Finland, and ELIXIR Finland. The Marson laboratory has received research support from Juno Therapeutics, Epinomics, Sanofi, GlaxoSmithKline, Gilead, and Anthem and reagents from Illumina and Genscript.
Author contributions
S.B.A.A., U.U.K., S.P., M.M.K., M.H.K., K.B., T.B., T.G., T.A., V.K., J.E.E.T., O.R., and R.L. designed research; S.B.A.A., U.U.K., S.P., M.M.K., M.H.K., J.F., J.O., N.P., K.B., S.J., T.B., T.G., L.T., T.A., P.S., V.K., J.E.E.T., R.S., O.R., and R.L. performed research; M.O. and A.M. contributed new reagents/analytic tools; S.B.A.A., U.U.K., S.P., M.M.K., M.H.K., N.P., K.B., S.J., T.B., T.G., L.T., T.A., P.S., V.K., J.E.E.T., O.R., L.L.E., and R.L. analyzed data; and S.B.A.A., U.U.K., M.M.K., M.H.K., K.B., S.J., L.T., R.S., A.M., O.R., L.L.E., and R.L. wrote the paper.
Competing interests
A.M. is a cofounder of Arsenal Biosciences, Function Bio, Spotlight Therapeutics, and Survey Genomics; serves on the boards of directors at Function Bio, Spotlight Therapeutics, and Survey Genomics; is a member of the scientific advisory boards of Arsenal Biosciences, Function Bio, Spotlight Therapeutics, Survey Genomics, NewLimit, Amgen, Tenaya, and Lightcast; owns stock in Arsenal Biosciences, Function Bio, Spotlight Therapeutics, NewLimit, Survey Genomics, Tenaya, and Lightcast; and has received fees from Arsenal Biosciences, Spotlight Therapeutics, NewLimit, Amgen, 23andMe, PACT Pharma, Juno Therapeutics, Tenaya, Survey Genomics, Lightcast, Gilead, Trizell, Vertex, Merck, Genentech, AlphaSights, Rupert Case Management, Bernstein, GLG, ClearView Healthcare Partners, and ALDA. A.M. is an investor in and informal advisor to Offline Ventures and a client of EPIQ. S.B.A.A., U.U.K., S.P., V.K., O.R., and R.L. are inventors in a European patent (Oligonucleotides for Modulating Regulatory T Cell Mediated Immunosuppression, patent number: WO2023242469A1) related to this manuscript. All other authors declare no competing interests.
Footnotes
This article is a PNAS Direct Submission.
Data, Materials, and Software Availability
The sequence corresponding to LIRIL2R isoforms 1-6 of LIRIL2R have been submitted to GenBank and can be accessed through accession number OR078434 (66), OR078435 (67), OR078436 (68), OR078437 (69), OR078438 (70), and OR078439 (71), respectively. RNA-seq, ATAC-seq, CUT&Tag-seq, and ChIRP-seq data have been submitted to GEO under a superseries GSE221759 (72). The mass spectrometry proteomics data have been deposited to the ProteomeXchange Consortium via the PRIDE (73) partner repository with the dataset identifier PXD038477 (74).
Supporting Information
References
- 1.Nishikawa H., Sakaguchi S., Regulatory T cells in cancer immunotherapy. Curr. Opin. Immunol. 27, 1–7 (2014). [DOI] [PubMed] [Google Scholar]
- 2.Sakaguchi S., Yamaguchi T., Nomura T., Ono M., Regulatory T cells and immune tolerance. Cell 133, 775–787 (2008). [DOI] [PubMed] [Google Scholar]
- 3.Haribhai D., et al. , A requisite role for induced regulatory T cells in tolerance based on expanding antigen receptor diversity. Immunity 35, 109–122 (2011), 10.1016/j.immuni.2011.03.029. [DOI] [PMC free article] [PubMed] [Google Scholar]
- 4.Abbas A. K., et al. , Regulatory T cells: Recommendations to simplify the nomenclature. Nat. Immunol. 14, 307–308 (2013). [DOI] [PubMed] [Google Scholar]
- 5.Gokhale A. S., Gangaplara A., Lopez-Occasio M., Thornton A. M., Shevach E. M., Selective deletion of Eos (Ikzf4) in T-regulatory cells leads to loss of suppressive function and development of systemic autoimmunity. J. Autoimmun. 105, 102300 (2019). [DOI] [PMC free article] [PubMed] [Google Scholar]
- 6.Sekiya T., et al. , Nr4a receptors are essential for thymic regulatory T cell development and immune homeostasis. Nat. Immunol. 14, 230–237 (2013). [DOI] [PubMed] [Google Scholar]
- 7.Ullah U., et al. , Transcriptional repressor HIC1 contributes to suppressive function of human induced regulatory T cells. Cell Rep. 22, 2094–2106 (2018). [DOI] [PMC free article] [PubMed] [Google Scholar]
- 8.Andrabi S. B. A., et al. , HIC1 interacts with FOXP3 multi protein complex: Novel pleiotropic mechanisms to regulate human regulatory T cell differentiation and function. Immunol. Lett. 263, 123–132 (2023). [DOI] [PubMed] [Google Scholar]
- 9.Ohkura N., et al. , T cell receptor stimulation-induced epigenetic changes and Foxp3 expression are independent and complementary events required for treg cell development. Immunity 37, 799 (2012). [DOI] [PubMed] [Google Scholar]
- 10.Ohkura N., et al. , Regulatory T cell-specific epigenomic region variants are a key determinant of susceptibility to common autoimmune diseases. Immunity 52, 1119–1132.e4 (2020). [DOI] [PubMed] [Google Scholar]
- 11.Guttman M., et al. , lincRNAs act in the circuitry controlling pluripotency and differentiation. Nature 477, 295–300 (2011). [DOI] [PMC free article] [PubMed] [Google Scholar]
- 12.Khalil A. M., et al. , Many human large intergenic noncoding RNAs associate with chromatin-modifying complexes and affect gene expression. Proc. Natl. Acad. Sci. U.S.A. 106, 11667–11672 (2009). [DOI] [PMC free article] [PubMed] [Google Scholar]
- 13.Rinn J. L., et al. , Functional demarcation of active and silent chromatin domains in human HOX loci by noncoding RNAs. Cell 129, 1311–1323 (2007). [DOI] [PMC free article] [PubMed] [Google Scholar]
- 14.Pagani M., et al. , Role of microRNAs and long-non-coding RNAs in CD4+T-cell differentiation. Immunol. Rev. 253, 82–96 (2013). [DOI] [PubMed] [Google Scholar]
- 15.Liu C., Zhang Y., Ma Z., Yi H., Long noncoding RNAs as orchestrators of CD4+ T-cell fate. Front. Cell Dev. Biol. 10, 1–11 (2022). [DOI] [PMC free article] [PubMed] [Google Scholar]
- 16.Ranzani V., et al. , The long intergenic noncoding RNA landscape of human lymphocytes highlights the regulation of T cell differentiation by linc-MAF-4. Nat. Immunol. 16, 318–325 (2015). [DOI] [PMC free article] [PubMed] [Google Scholar]
- 17.Gibbons H. R., et al. , Divergent lncRNA GATA3-AS1 regulates GATA3 transcription in T-helper 2 cells. Front. Immunol. 9, 1–9 (2018). [DOI] [PMC free article] [PubMed] [Google Scholar]
- 18.Collier S. P., Collins P. L., Williams C. L., Boothby M. R., Aune T. M., Cutting edge: Influence of Tmevpg1, a long intergenic noncoding RNA, on the expression of Ifng by Th1 cells. J. Immunol. 189, 2084–2088 (2012). [DOI] [PMC free article] [PubMed] [Google Scholar]
- 19.Liu Z., et al. , LncRNA H19 over-expression inhibited Th17 cell differentiation to relieve endometriosis through miR-342-3p/IER3 pathway. Cell Biosci. 9, 1–10 (2019). [DOI] [PMC free article] [PubMed] [Google Scholar]
- 20.Shui X., et al. , Knockdown of lncRNA NEAT1 inhibits Th17/CD4+ T cell differentiation through reducing the STAT3 protein level. J. Cell. Physiol. 234, 22477–22484 (2019). [DOI] [PubMed] [Google Scholar]
- 21.Qiu Y.-Y., et al. , LncRNA-MEG3 functions as a competing endogenous RNA to regulate Treg/Th17 balance in patients with asthma by targeting microRNA-17/ RORγt. Biomed. Pharmacother. 111, 386–394 (2019). [DOI] [PubMed] [Google Scholar]
- 22.Khan M. M., et al. , Long intergenic noncoding RNA MIAT as a regulator of human Th17 cell differentiation. Front. Immunol. 13, 2785 (2022). [DOI] [PMC free article] [PubMed] [Google Scholar]
- 23.Zemmour D., Pratama A., Loughhead S. M., Mathis D., Benoist C., Flicr, a long noncoding RNA, modulates Foxp3 expression and autoimmunity. Proc. Natl. Acad. Sci. U.S.A. 114, E3472–E3480 (2017). [DOI] [PMC free article] [PubMed] [Google Scholar]
- 24.Brajic A., et al. , The long non-coding RNA Flatr anticipates Foxp3 expression in regulatory T cells. Front. Immunol. 9, 1–12 (2018). [DOI] [PMC free article] [PubMed] [Google Scholar]
- 25.Qiao Y. Q., et al. , LncRNA DQ786243 affects Treg related CREB and Foxp3 expression in Crohn’s disease. J. Biomed. Sci. 20, 1–7 (2013). [DOI] [PMC free article] [PubMed] [Google Scholar]
- 26.Huter E. N., et al. , TGF-beta-induced Foxp3+ regulatory T cells rescue scurfy mice. Eur. J. Immunol. 38, 1814–1821 (2008). [DOI] [PMC free article] [PubMed] [Google Scholar]
- 27.Shevach E. M., Tran D. Q., Davidson T. S., Andersson J., The critical contribution of TGF-β to the induction of Foxp3 expression and regulatory T cell function. Eur. J. Immunol. 38, 915–917 (2008). [DOI] [PMC free article] [PubMed] [Google Scholar]
- 28.Schmiedel B. J., et al. , Impact of genetic polymorphisms on human immune cell gene expression. Cell 175, 1701–1715.e16 (2018). [DOI] [PMC free article] [PubMed] [Google Scholar]
- 29.Sadlon T. J., et al. , Genome-wide identification of human FOXP3 target genes in natural regulatory T cells. J. Immunol. 185, 1071–1081 (2010). [DOI] [PubMed] [Google Scholar]
- 30.Tuomela S., et al. , Comparative analysis of human and mouse transcriptomes of Th17 cell priming. Oncotarget 7, 13416–13428 (2016). [DOI] [PMC free article] [PubMed] [Google Scholar]
- 31.Kempkes R. W. M., Joosten I., Koenen H. J. P. M., He X., Metabolic pathways involved in regulatory T cell functionality. Front. Immunol. 10, 2839 (2019). [DOI] [PMC free article] [PubMed] [Google Scholar]
- 32.Cluxton D., Petrasca A., Moran B., Fletcher J. M., Differential regulation of human treg and Th17 cells by fatty acid synthesis and glycolysis. Front. Immunol. 10, 1–12 (2019). [DOI] [PMC free article] [PubMed] [Google Scholar]
- 33.Durant L., et al. , Diverse targets of the transcription factor STAT3 contribute to T cell pathogenicity and homeostasis. Immunity 32, 605–615 (2010). [DOI] [PMC free article] [PubMed] [Google Scholar]
- 34.Sen P., et al. , Quantitative genome-scale metabolic modeling of human CD4+ T cell differentiation reveals subset-specific regulation of glycosphingolipid pathways. Cell Rep. 37, 109973 (2021). [DOI] [PubMed] [Google Scholar]
- 35.Chinen T., et al. , An essential role for the IL-2 receptor in T reg cell function. Nat. Immunol. 17, 1322–1333 (2016). [DOI] [PMC free article] [PubMed] [Google Scholar]
- 36.Simeonov D. R., et al. , Discovery of stimulation-responsive immune enhancers with CRISPR activation. Nature 549, 111–115 (2017). [DOI] [PMC free article] [PubMed] [Google Scholar]
- 37.Gianchecchi E., Fierabracci A., Inhibitory receptors and pathways of lymphocytes: The role of PD-1 in Treg development and their involvement in autoimmunity onset and cancer progression. Front. Immunol. 9, 1–12 (2018). [DOI] [PMC free article] [PubMed] [Google Scholar]
- 38.Kolar P., et al. , CTLA-4 ( CD152) controls homeostasis and suppressive capacity of regulatory T cells in mice. ARTHRITIS Rheum. 60, 123–132 (2009). [DOI] [PubMed] [Google Scholar]
- 39.Wing K., et al. , CTLA-4 control over Foxp3+ regulatory T cell function. Science 322, 271–275 (2008). [DOI] [PubMed] [Google Scholar]
- 40.Ha D., et al. , Differential control of human Treg and effector T cells in tumor immunity by Fc-engineered anti—CTLA-4 antibody. Proc. Natl. Acad. Sci. U.S.A. 116, 609–618 (2019). [DOI] [PMC free article] [PubMed] [Google Scholar]
- 41.Yang B.-H., et al. , Foxp3+ T cells expressing ROR[gamma]t represent a stable regulatory T-cell effector lineage with enhanced suppressive capacity during intestinal inflammation. Mucosal Immunol. 9, 444–457 (2016), 10.1038/mi.2015.74. [DOI] [PubMed] [Google Scholar]
- 42.Van Gool F., et al. , A mutation in the transcription factor Foxp3 drives T helper 2 effector function in regulatory T cells. Immunity 50, 362–377.e6 (2019). [DOI] [PMC free article] [PubMed] [Google Scholar]
- 43.Ahlfors H., et al. , SATB1 dictates expression of multiple genes including IL-5 involved in human T helper cell differentiation. Blood 116, 1443–1453 (2010). [DOI] [PMC free article] [PubMed] [Google Scholar]
- 44.Beyer M., et al. , Repression of the genome organizer SATB1 in regulatory T cells is required for suppressive function and inhibition of effector differentiation. Nat. Immunol. 12, 898–907 (2011). [DOI] [PMC free article] [PubMed] [Google Scholar]
- 45.Toomer K. H., et al. , Essential and non-overlapping IL-2Rα-dependent processes for thymic development and peripheral homeostasis of regulatory T cells. Nat. Commun. 10, 1037 (2019). [DOI] [PMC free article] [PubMed] [Google Scholar]
- 46.Dolsten G. A., Pritykin Y., Genomic analysis of Foxp3 function in regulatory T cells. J. Immunol. 210, 880–887 (2023). [DOI] [PMC free article] [PubMed] [Google Scholar]
- 47.Tekguc M., Wing J. B., Osaki M., Long J., Sakaguchi S., Treg-expressed CTLA-4 depletes CD80/CD86 by trogocytosis, releasing free PD-L1 on antigen-presenting cells. Proc. Natl. Acad. Sci. U.S.A. 118, e2023739118 (2021). [DOI] [PMC free article] [PubMed] [Google Scholar]
- 48.Marie J. C., Letterio J. J., Gavin M., Rudensky A. Y., TGF-β1 maintains suppressor function and Foxp3 expression in CD4 +CD25+ regulatory T cells. J. Exp. Med. 201, 1061–1067 (2005). [DOI] [PMC free article] [PubMed] [Google Scholar]
- 49.So L., et al. , Regulatory T cells suppress CD4+ effector T cell activation by controlling protein synthesis. J. Exp. Med. 220, e20221676 (2023). [DOI] [PMC free article] [PubMed] [Google Scholar]
- 50.Park J., et al. , Short-chain fatty acids induce both effector and regulatory T cells by suppression of histone deacetylases and regulation of the mTOR-S6K pathway. Mucosal Immunol. 8, 80–93 (2015). [DOI] [PMC free article] [PubMed] [Google Scholar]
- 51.Hu M., et al. , Short-chain fatty acids augment differentiation and function of human induced regulatory T cells. Int. J. Mol. Sci. 23, 1–17 (2022). [DOI] [PMC free article] [PubMed] [Google Scholar]
- 52.Chu C., Quinn J., Chang H. Y., Chromatin isolation by RNA purification (ChIRP). J. Vis. Exp. 61, 1–6 (2012), 10.3791/3912. [DOI] [PMC free article] [PubMed] [Google Scholar]
- 53.Roth T. L., et al. , Reprogramming human T cell function and specificity with non-viral genome targeting. Nature 559, 405–409 (2018). [DOI] [PMC free article] [PubMed] [Google Scholar]
- 54.Khan M. M., et al. , CIP2A constrains Th17 differentiation by modulating STAT3 signaling. iScience 23, 100947 (2020). [DOI] [PMC free article] [PubMed] [Google Scholar]
- 55.Bray N. L., Pimentel H., Melsted P., Pachter L., Near-optimal probabilistic RNA-seq quantification. Nat. Biotechnol. 34, 525–527 (2016). [DOI] [PubMed] [Google Scholar]
- 56.Pimentel H., Bray N. L., Puente S., Melsted P., Pachter L., Differential analysis of RNA-seq incorporating quantification uncertainty. Nat. Methods 14, 687–690 (2017). [DOI] [PubMed] [Google Scholar]
- 57.Hailemariam M., et al. , S-trap, an ultrafast sample-preparation approach for shotgun proteomics. J. Proteome Res. 17, 2917–2924 (2018). [DOI] [PubMed] [Google Scholar]
- 58.Subramanian A., et al. , Gene set enrichment analysis: A knowledge-based approach for interpreting genome-wide expression profiles. Proc. Natl. Acad. Sci. U.S.A. 102, 15545–15550 (2005). [DOI] [PMC free article] [PubMed] [Google Scholar]
- 59.Kaya-Okur H. S., et al. , CUT&Tag for efficient epigenomic profiling of small samples and single cells. Nat. Commun. 10, 1–10 (2019). [DOI] [PMC free article] [PubMed] [Google Scholar]
- 60.Langmead B., Salzberg S. L., Fast gapped-read alignment with Bowtie 2. Nat. Methods 9, 357–359 (2012). [DOI] [PMC free article] [PubMed] [Google Scholar]
- 61.Danecek P., et al. , Twelve years of SAMtools and BCFtools. Gigascience 10, 1–4 (2021). [DOI] [PMC free article] [PubMed] [Google Scholar]
- 62.Agren R., et al. , Reconstruction of genome-scale active metabolic networks for 69 human cell types and 16 cancer types using INIT. PLoS Comput. Biol. 8, e1002518 (2012). [DOI] [PMC free article] [PubMed] [Google Scholar]
- 63.Wang H., et al. , RAVEN 2.0: A versatile toolbox for metabolic network reconstruction and a case study on Streptomyces coelicolor. PLoS Comput. Biol. 14, 1–17 (2018). [DOI] [PMC free article] [PubMed] [Google Scholar]
- 64.Henriksson J., et al. , Genome-wide CRISPR screens in T helper cells reveal pervasive crosstalk between activation and differentiation. Cell 176, 882–896.e18 (2019). [DOI] [PMC free article] [PubMed] [Google Scholar]
- 65.Ritchie M. E., et al. , Limma powers differential expression analyses for RNA-sequencing and microarray studies. Nucleic Acids Res. 43, e47 (2015). [DOI] [PMC free article] [PubMed] [Google Scholar]
- 66.Kalim U. U., Rasool O., Kumpulainen V., Lahesmaa R., Homo sapiens LIRIL2R isoform 1 lncRNA, complete sequence. GenBank. https://www.ncbi.nlm.nih.gov/nuccore/OR078434. Accessed 15 May 2024.
- 67.Kalim U. U., Rasool O., Kumpulainen V., Lahesmaa R., Homo sapiens LIRIL2R isoform 2 lncRNA, complete sequence. GenBank. https://www.ncbi.nlm.nih.gov/nuccore/OR078435. Accessed 15 May 2024.
- 68.Kalim U. U., Rasool O., Kumpulainen V., Lahesmaa R., Homo sapiens LIRIL2R isoform 3 lncRNA, complete sequence. GenBank. https://www.ncbi.nlm.nih.gov/nuccore/OR078436. Accessed 15 May 2024.
- 69.Kalim U. U., Rasool O., Kumpulainen V., Lahesmaa R., Homo sapiens LIRIL2R isoform 4 lncRNA, complete sequence. GenBank. https://www.ncbi.nlm.nih.gov/nuccore/OR078437. Accessed 15 May 2024.
- 70.Kalim U. U., Rasool O., Kumpulainen V., Lahesmaa R., Homo sapiens LIRIL2R isoform 5 lncRNA, complete sequence. GenBank. https://www.ncbi.nlm.nih.gov/nuccore/OR078438. Accessed 15 May 2024.
- 71.Kalim U. U., Rasool O., Kumpulainen V., Lahesmaa R., Homo sapiens LIRIL2R isoform 6 lncRNA, complete sequence. GenBank. https://www.ncbi.nlm.nih.gov/nuccore/OR078439. Accessed 15 May 2024.
- 72.Lahesmaa R., Long noncoding RNA LIRIL2R modulates FOXP3 levels and suppressive function of human CD4+ regulatory T cells by regulating IL2RA. GEO. https://www.ncbi.nlm.nih.gov/geo/query/acc.cgi?acc=GSE221759. Deposited 15 May 2024. [DOI] [PMC free article] [PubMed]
- 73.Perez-Riverol Y., et al. , The PRIDE database resources in 2022: A hub for mass spectrometry-based proteomics evidences. Nucleic Acids Res. 50, D543–D552 (2022). [DOI] [PMC free article] [PubMed] [Google Scholar]
- 74.Batkulwar K., Lahesmaa R., FAIMS-DIA proteomics of LIRIL2R-deficent induced regulatory T cells. PRIDE. https://www.ebi.ac.uk/pride/archive/projects/PXD038477. Accessed 16 May 2024.
Associated Data
This section collects any data citations, data availability statements, or supplementary materials included in this article.
Supplementary Materials
Appendix 01 (PDF)
Dataset S01 (XLSX)
Dataset S02 (XLSX)
Dataset S03 (XLSX)
Dataset S04 (XLSX)
Dataset S05 (XLSX)
Dataset S06 (XLSX)
Data Availability Statement
The sequence corresponding to LIRIL2R isoforms 1-6 of LIRIL2R have been submitted to GenBank and can be accessed through accession number OR078434 (66), OR078435 (67), OR078436 (68), OR078437 (69), OR078438 (70), and OR078439 (71), respectively. RNA-seq, ATAC-seq, CUT&Tag-seq, and ChIRP-seq data have been submitted to GEO under a superseries GSE221759 (72). The mass spectrometry proteomics data have been deposited to the ProteomeXchange Consortium via the PRIDE (73) partner repository with the dataset identifier PXD038477 (74).