

Significance
Phenotypic transformation in lung cancer refers to a clinical phenomenon that patients with non–small cell lung cancer appear small cell lung cancer phenotype after tyrosine kinase inhibitor (TKI) treatment, which would lead to failure of therapy. At present, the underlying mechanism of phenotypic transformation is limited, and there is no effective treatment. In this work, we found that the epigenetic regulatory enzyme EHMT2 was involved in phenotypic transformation through epiregulating SFRP1 to activate the WNT/β-catenin pathway, whereas targeting EHMT2 would reverse NE phenotype and sensitize TKI treatment. In conclusion, our study reveals the underlying mechanism of NE transformation and provides a potential strategy to reverse TKI resistance in lung cancer.
Keywords: non–small cell lung cancer, small cell lung cancer, neuroendocrine transformation, EHMT2, WNT/β-catenin pathway
Abstract
The transformation of lung adenocarcinoma to small cell lung cancer (SCLC) is a recognized resistance mechanism and a hindrance to therapies using epidermal growth factor receptor tyrosine kinase inhibitors (TKIs). The paucity of pretranslational/posttranslational clinical samples limits the deeper understanding of resistance mechanisms and the exploration of effective therapeutic strategies. Here, we developed preclinical neuroendocrine (NE) transformation models. Next, we identified a transcriptional reprogramming mechanism that drives resistance to erlotinib in NE transformation cell lines and cell-derived xenograft mice. We observed the enhanced expression of genes involved in the EHMT2 and WNT/β-catenin pathways. In addition, we demonstrated that EHMT2 increases methylation of the SFRP1 promoter region to reduce SFRP1 expression, followed by activation of the WNT/β-catenin pathway and TKI-mediated NE transformation. Notably, the similar expression alterations of EHMT2 and SFRP1 were observed in transformed SCLC samples obtained from clinical patients. Importantly, suppression of EHMT2 with selective inhibitors restored the sensitivity of NE transformation cell lines to erlotinib and delayed resistance in cell-derived xenograft mice. We identify a transcriptional reprogramming process in NE transformation and provide a potential therapeutic target for overcoming resistance to erlotinib.
Lung cancer is among the most common cancers in the world (1, 2). For patients affected by non–small cell lung cancer (NSCLC) with activating mutations in epidermal growth factor receptor (EGFR), tyrosine kinase inhibitors (TKIs) can be beneficial. TKIs are effective treatments with fewer side effects than chemotherapy medicines; for example, erlotinib, a first-generation EGFR-TKI, can rapidly improve symptoms and achieve better outcomes. However, following initial efficacy, resistance to TKIs develops after about 10 to 12 mo (3, 4).
To date, there are three common mechanisms of acquired resistance in patients. About half of the patients will develop the EGFR T790M mutation, which abrogates the responsiveness to erlotinib (5). A subset of patients has MET or HER2 amplification, which activates downstream signaling independent of EGFR (6–8). 5 to 15% of patients acquire resistance through transformation to small cell lung cancer (SCLC) (9–11). The histological transformation of lung adenocarcinoma (LUAD) to an aggressive neuroendocrine (NE) derivative resembling SCLC is a signature example of lineage plasticity in cancer. At present, therapeutic strategies have been developed to counteract EGFR-TKI resistance driven by T790M and MET amplification (12–14). There has been limited research progress on phenotypic transformation, which is mainly due to the small number of relevant clinical samples and difficulty in obtaining them. Therefore, it is important to establish a feasible preclinical model and explore the mechanism of phenotypic transformation in lung cancer. Another important goal of this study is to explore possible treatment options based on the uncovered mechanism.
Here, we first report the role of EHMT2 in phenotypic transformation in a cell model. We reveal the underlying mechanisms of epigenetic regulation, and we leverage these mechanisms to develop a potential strategy to reverse TKI resistance resulting from phenotypic transformation.
Results
Establishment of Transformed Cell Models and Confirmation of Potential Biomarkers of NE Transformation.
Erlotinib-resistant NSCLC cell lines were generated by exposing cells to escalating doses of erlotinib during one year. However, the resulting population contains a mixture of cells with different resistance mechanisms, which is not conducive to the study of NE transformation. To establish cell clones that exhibit characteristics of NE transformation, SCLC-like monoclonal cells (unclear cell boundary, high nuclear-to-cytoplasmic ratio, granular chromatin, and high mitotic counts, etc.) were isolated from four different NSCLC cell lines by limiting dilution (SI Appendix, Fig. S1 A and B). DNA sequencing (DNA-seq) analysis was then performed, and the clonal resistant cells were compared with their isogenic parental cells (Fig. 1 A and B and SI Appendix, Fig. S2A). The results showed that certain clonal cells did not develop EGFR-depended mutations which lead to TKI resistance, such as mutations in exons 18 to 21 (including T790M). The other underlying mechanisms, including MET and HER2 amplification, mutation in PIK3CA, BRAF, and KRAS genes, were also excluded (Fig. 1C and SI Appendix, Fig. S2 B and C). Next, these cell lines were selected for further study and designated as T-H1650, T-4006, T-PC9, and T-827. We detected the expression of classical SCLC markers in these cell models (Fig. 1D). As we expected, CHGA was highly expressed in transformed cells, and RB was poorly expressed compared with the parental cells. CHGA and RB are usually used as markers for SCLC, but there is no marker to represent the pretransformation NSCLC. A previous study showed that the expression and mutation of EGFR are rarely detected in SCLC (15). Besides, YAP expression was higher in never-transformed LUADs than transformed SCLC (16). We considered that EGFR and YAP have potential as markers for pretransformation NSCLC. To evaluate this possibility, we compared the expression of CHGA, EGFR, and YAP. As expected, we observed increased mRNA expression of EGFR and YAP in NSCLC vs. SCLC, consistent with NE transformation. The expression of CHGA was higher in SCLC than in NSCLC (Fig. 1E). For in-depth characterization of the progress of NE transformation in the transformed cell models, we detected the expression of EGFR, YAP, RB, and CHGA proteins. We found that the transformed cells typically express higher levels of CHGA, while the parental cells express higher levels of EGFR, YAP, and RB (Fig. 1 D and F).
Fig. 1.
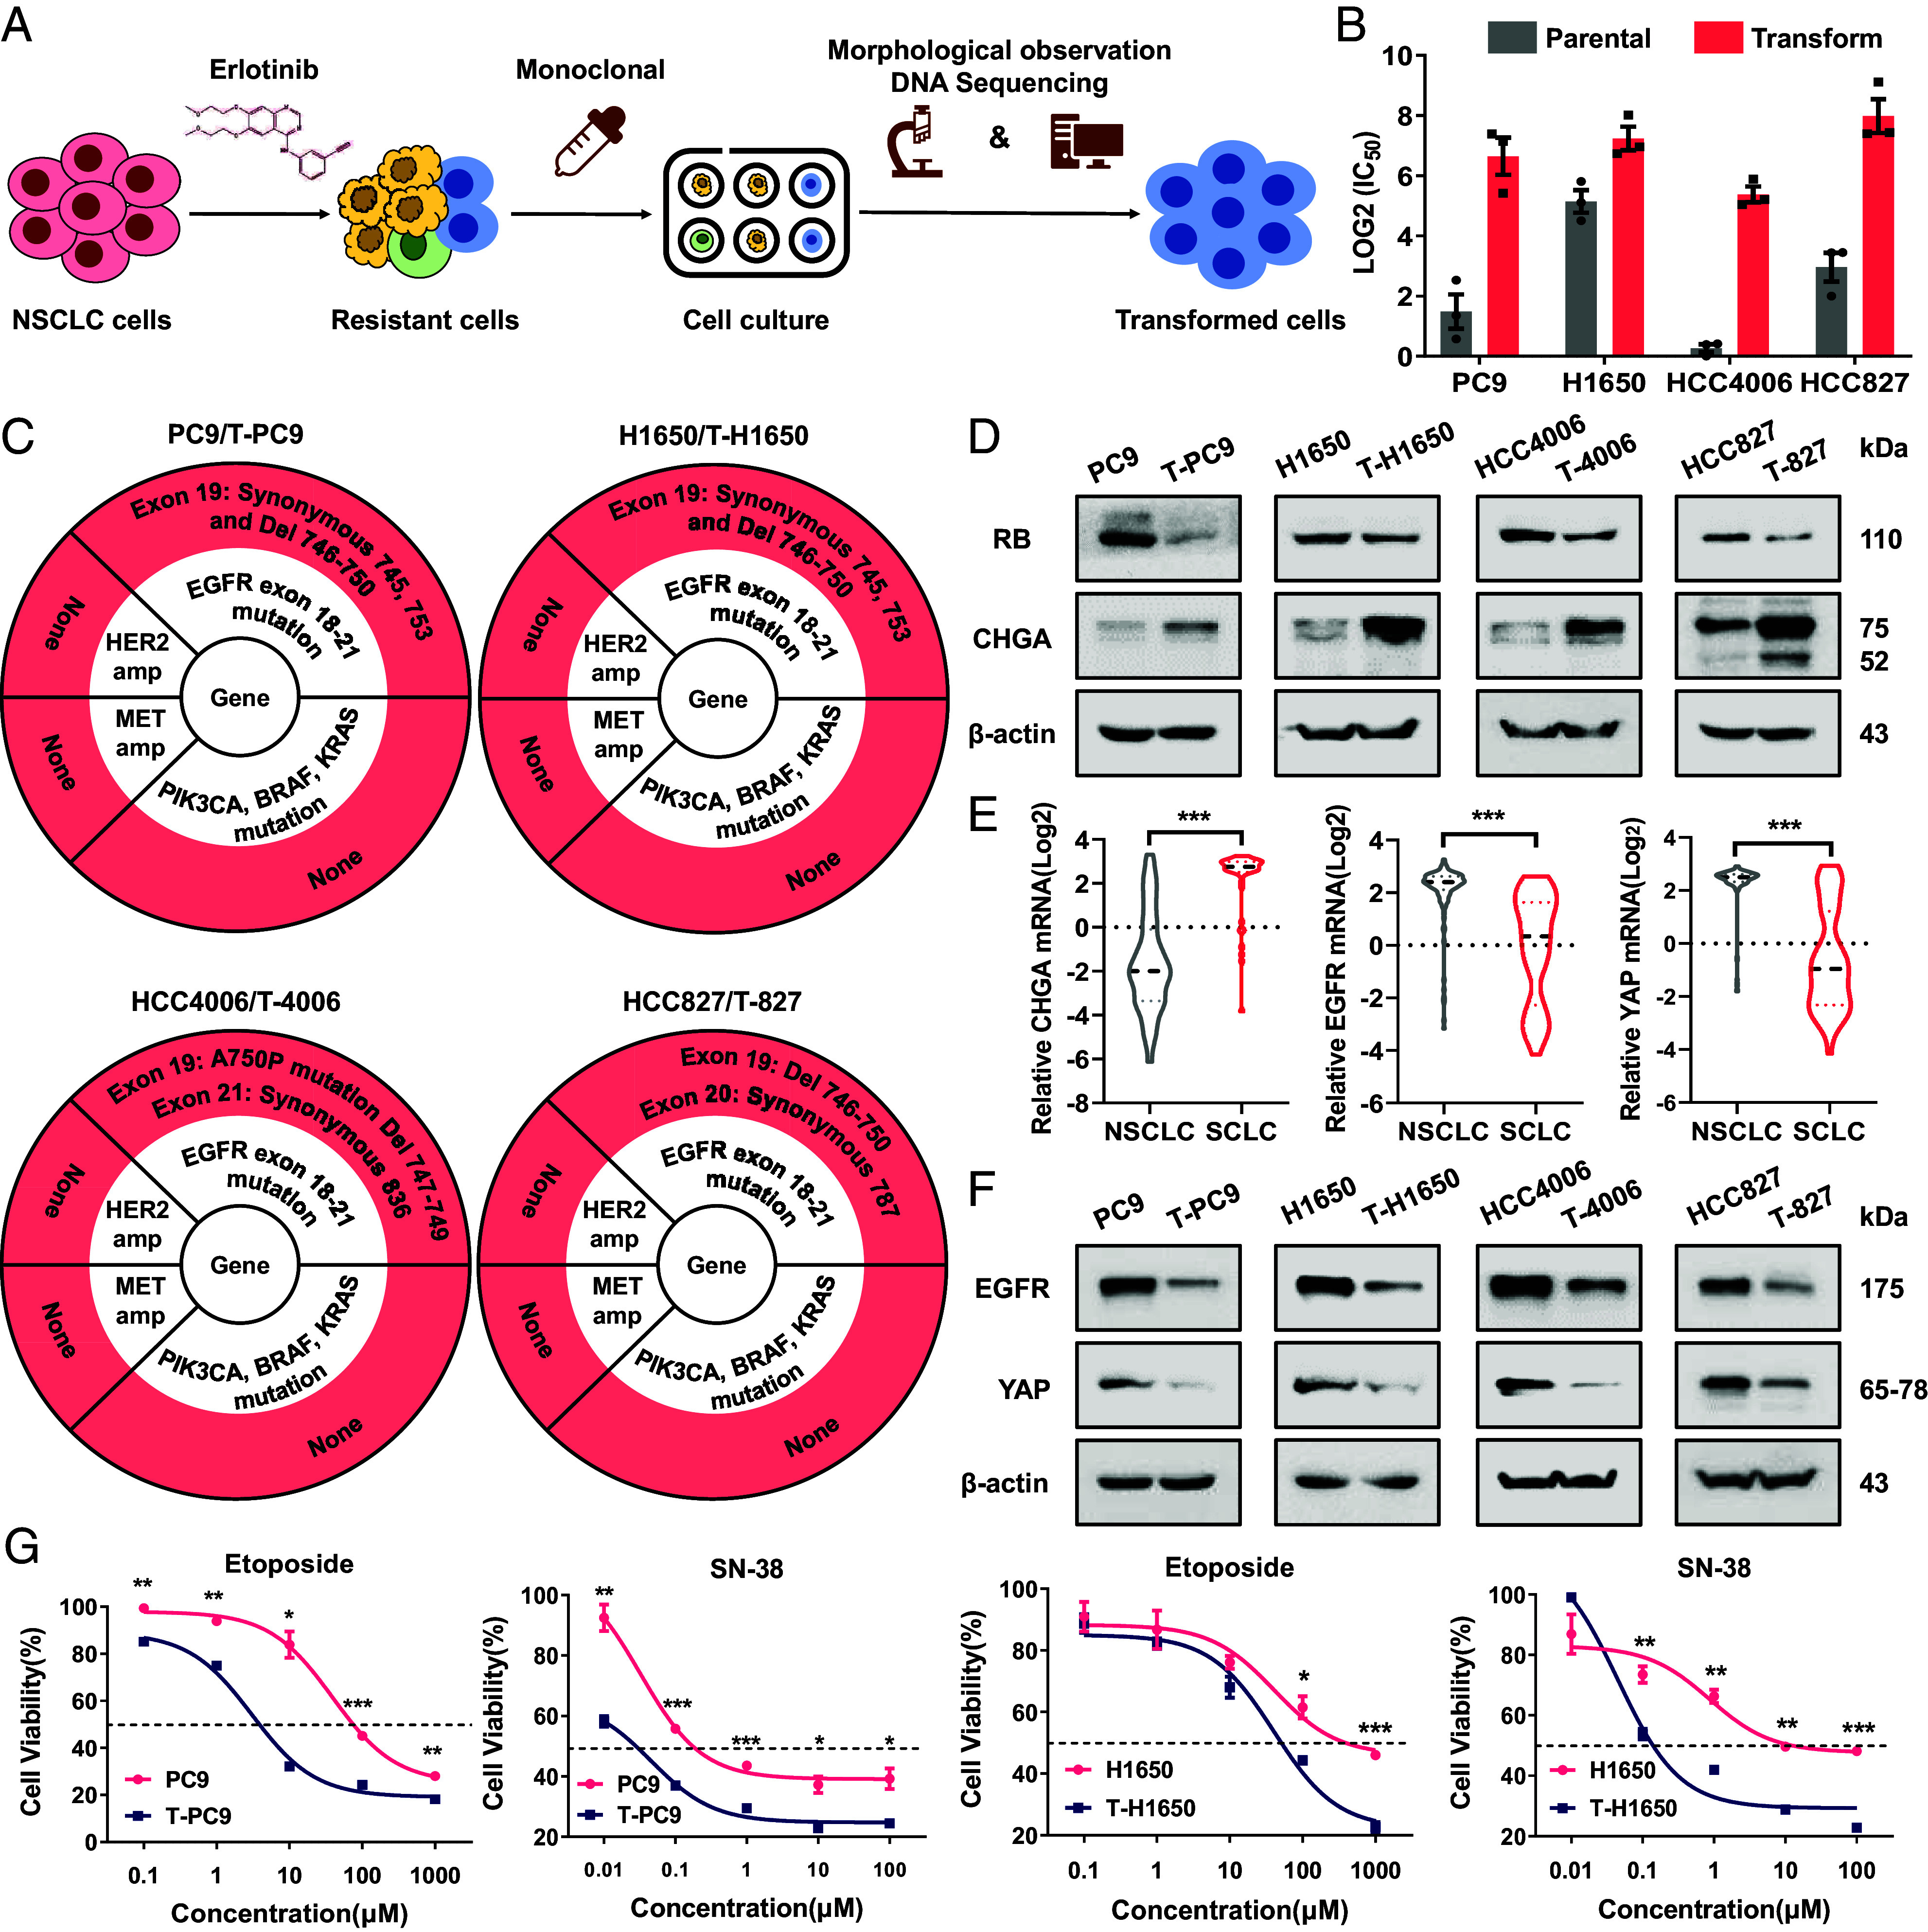
Establishment of transformed cell models and confirmation of potential biomarkers of NE transformation. (A) SCLC-like cells were selected by monoclonal selection from erlotinib-resistant cells, and resistant cells driven by mutation were excluded by DNA-seq. (B) Log2(IC50) values for erlotinib treatment (48 h) of parental (H1650, HCC4006, HCC827, and PC9) cells and NE transformation (T) variants. (C) Mutations at EGFR exon 18 to 21 and gene amplifications of MET and HER2 in parental and NE-transformed cells were determined by DNA sequencing and qPCR. PIK3CA, BRAF, and KRAS mutation detection by WES. (D) Western blots showing the levels of NE transformation biomarkers in paired parental cells and NE-transformed cells. (E) CHGA, EGFR, and YAP mRNA levels in NSCLC (n = 135, 135, and 135) and SCLC (n = 50, 50, and 49). Data are from the CCLE 22Q2 Public. (F) Western blots showing the levels of EGFR and YAP in paired parental cells and NE-transformed cells. (G) Dose–response curves for parental and NE-transformed cells treated with etoposide or SN-38 for 48 h (n = 3). Data are graphed as means ± SEM. *P < 0.05, **P < 0.01, ***P < 0.001, two-tailed Student’s t test.
It is noteworthy that previous articles reported that TP53 and RB play an important role in phenotypic plasticity, and most patients with SCLC transformation had RB and TP53 inactivation mutations (17, 18). Therefore, we think it is necessary to clarify the status of TP53 and RB in transformed cells. Through whole exon sequencing (WES) and western blot, we found that the transformed cells had TP53 mutation and low expression of TP53, but no RB mutation compared with the parental cell (SI Appendix, Fig. S2D). Furthermore, we explored the mechanism of decreased expression of TP53 and RB. It has been reported that RB inactivation is related to DNA methylation. Consistently, we found that DNA methylation in transformed cells was higher than parental cells through dot blot, and the methylation of CpG island region of TP53 and RB in T-H1650 and T-4006 cells increased significantly compared with the parental cells through the methylation-specific PCR (MS-PCR) (SI Appendix, Fig. S2 E and F). Although there is still a small amount of RB protein in SCLC-transformed cells, we guess it exists in phosphorylated state (Inactive). We detected the expression of pRB and confirmed that its expression increased in transformed cells. In addition, we found that the expression of CDK4, CyclinD1, CDK2, and CyclinE1 was up-regulated in transformed cells, which mediate RB phosphorylation (SI Appendix, Fig. S3A). This may be the main reason for the increase of pRB. Active RB hinders the progress of cell cycle by inhibiting the transcription of cell cycle-related genes and becomes inactive once it is phosphorylated (19). Therefore, we detected the mRNA expression of cell cycle-related genes and the changes of cell cycle. The results showed that the mRNA expression of cell cycle-related genes was up-regulated in transformed cells. Flow cytometry showed that the proportion of S phase increased, while the proportion of G0/G1 phase decreased in transformed cells (SI Appendix, Fig. S3 B and C). In addition, we transfected different concentrations of RB siRNA and detected the changes of cell cycle-related genes in parental cells and transformed cells. The results showed that the change of cell cycle-related genes in parental cells was more significant than in transformed cells in concentration-dependent manner (SI Appendix, Fig. S3 D and E). This reflects that RB has a more complete function in parental cells and exists in transformed cells as, at least partially, inactive pRB. Thus, we confirmed that these cell models have the characteristics of NE transformation.
To evaluate these cell models more comprehensively, we determined the efficacy of etoposide and SN-38 (the active metabolite of irinotecan) in paired cell lines. As drugs for the treatment of SCLC, both agents are highly effective against SCLC cells but have limited efficacy in NSCLC cells. Indeed, the efficacy of etoposide and SN-38 was significantly increased in the transformed cells (Fig. 1G). Together, these data confirm that we developed four cell lines with characteristics of NE transformation. This is similar to what is observed clinically when NSCLC is exposed to long-term TKI treatment.
Pathological and Transcriptomic Characteristics of the Transformed SCLC Cell Models.
Similar to NE markers, histomorphology is an important indicator for the evaluation of phenotypic transformation (20). To confirm that the SCLC transformation models can simulate the transformation of clinical samples, we analyzed the histomorphological changes of xenograft tumors derived from SCLC cells. In PC9 cell–derived xenograft tumors, we observed that the cells were mainly round or oval in shape, with conspicuous nucleoli, clear cell borders, and other characteristics of LUAD (Fig. 2A). However, xenograft tumors derived from T-PC9 cells presented morphological features of SCLC such as enlarged nucleus, inconspicuous nucleoli, indistinct cell boundaries, and cells clustering into nests (Fig. 2A). In addition, it should be noted that the histomorphology of T-PC9 cell–derived xenograft tumors is highly consistent with that of xenograft tumors derived from two SCLC cell lines (H446 and SHP77) and shows few of the features of LUAD. This indicates that the NE transformation model shows features of SCLC transformation and has the potential to simulate clinical samples. Then, we examined the expression of markers by immunohistochemical (IHC) and observed higher expression of NE biomarkers CHGA and ASCL1 after transformation. In contrast, RB and YAP were more highly expressed in xenograft tissue derived from parental cells. In addition, according to the SCLC pathological evaluation of National Comprehensive Cancer Network (NCCN), it is necessary to detect tumor proliferation. We found that compared with parental xenograft tissue, Ki67 and PCNA were enriched in xenograft tumors derived from T-PC9 cells (Fig. 2B and SI Appendix, Fig. S4 A and B). This is consistent with the Cancer Cell Line Encyclopedia (CCLE) (SI Appendix, Fig. S4C). Next, we conducted experiments to explore drug selectivity using an in vivo model. The sensitivity of tumors to irinotecan was not significantly different in the PC9 xenograft model compared with the control group. However, irinotecan significantly reduced the tumor burden in the T-PC9 xenograft model (Fig. 2C). This is consistent with results obtained in vitro (Fig. 1F). Multiple studies have reported that the gene expression pattern of NSCLC is significantly different from that of classical SCLC and the expression of transformed SCLC is similar to classical SCLC (21, 22). Gene Set Enrichment Analysis (GSEA) on paired cell lines indicated that SCLC-related gene expression was significantly enriched in T-PC9 and T-H1650 (Fig. 2D and SI Appendix, Fig. S4D). In addition, we compared the expression of four genes in the cell model by RNA-seq. These genes have generally been reported to be differentially expressed between NSCLC and SCLC cell lines. The results showed that the expression profile of the T-H1650 was similar to classical SCLC (SI Appendix, Fig. S4E). Altogether, these findings reveal that the SCLC-transformed cell models are similar to classical SCLC in morphology, mRNA expression, and chemosensitivity.
Fig. 2.
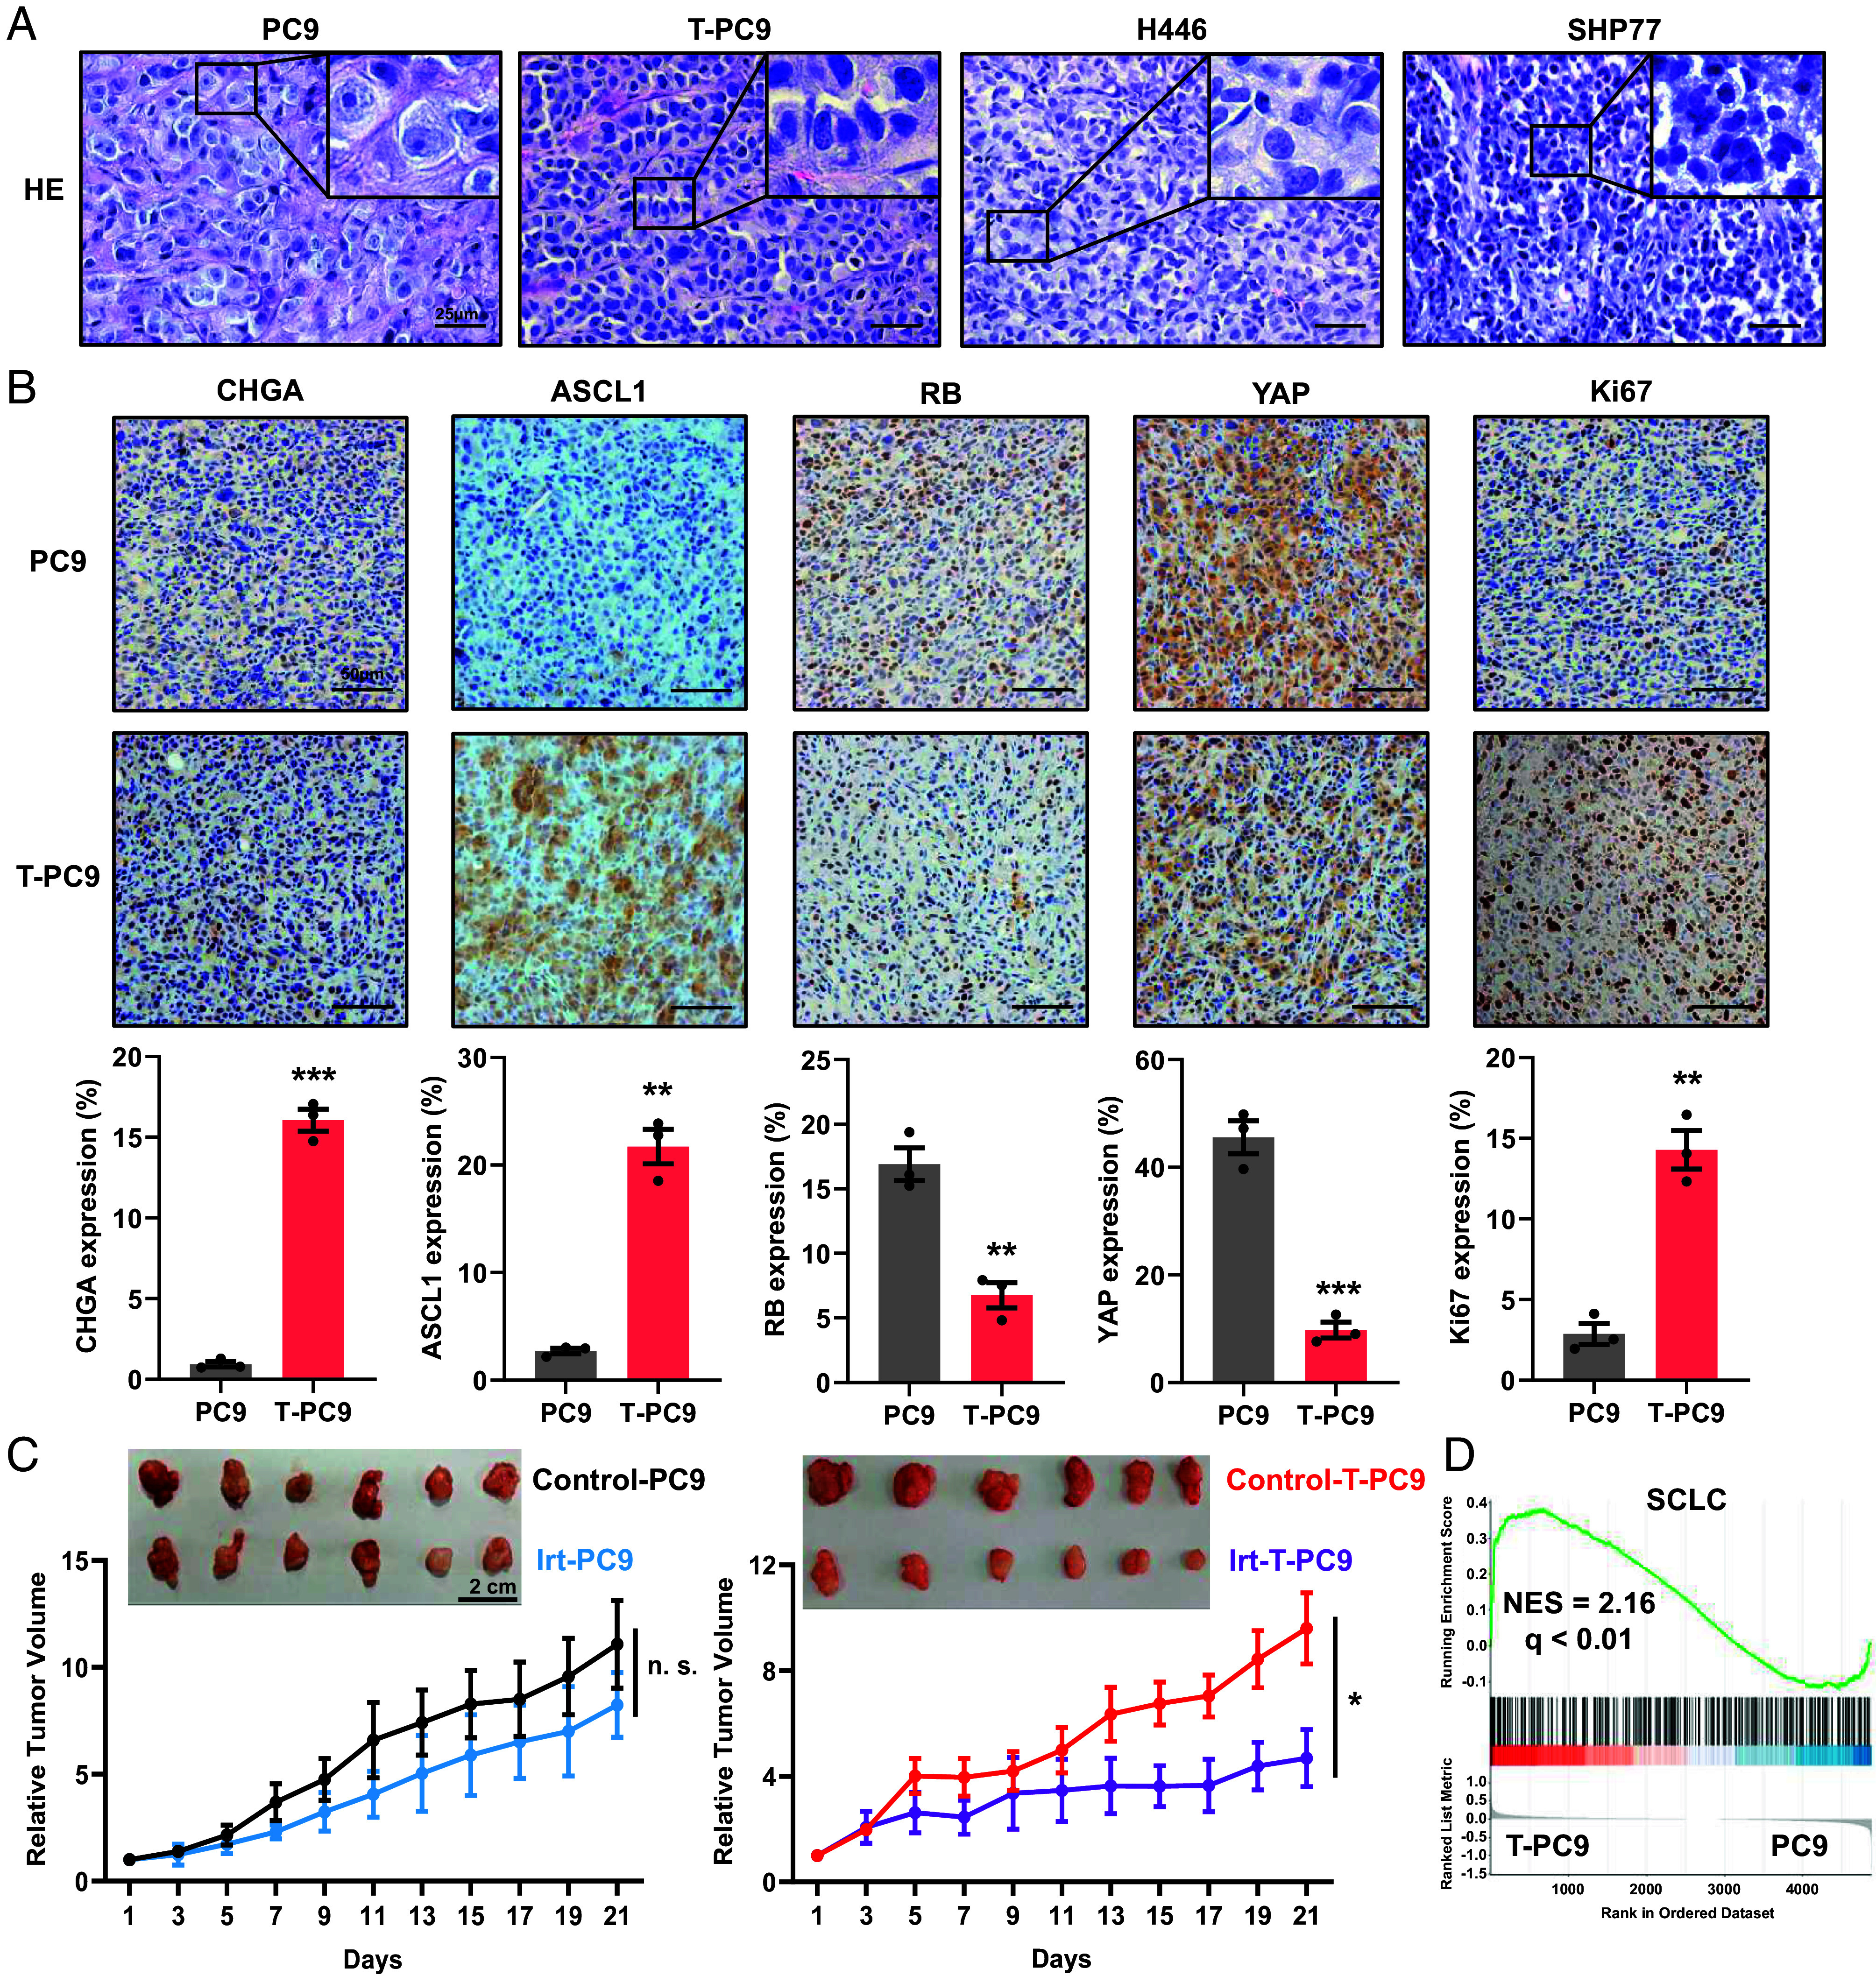
Histological analyses of tumors derived from transformed cell lines, and RNA-seq analysis of transformed cell lines. (A) HE was performed on xenograft tumors derived from PC9, T-PC9, H446 (SCLC cells), and SHP77 cells (SCLC cells). (B) IHC of CHGA, ASCL1, RB, YAP, and Ki67 for in situ analysis of NE transformation status and cell proliferation in xenograft tumors. (Scale bar, 50 μm.) (C) The inhibitory efficacy of irinotecan treatment on relative tumor volume in mice with PC9- and T-PC9-driven xenografts (n = 6). Irinotecan (10 mg/kg) was administered through intraperitoneal injection every 2 d. (D) GSEA enrichment plot of the SCLC gene set with the corresponding statistical metrics shown. The analysis was carried out on paired cell lines (T-PC9/PC9). Data are graphed as means ± SEM. *P < 0.05, **P < 0.01, ***P < 0.001, two-tailed Student’s t test.
In NE Transformation, Acquired Resistance to EGFR-TKIs Is Associated with EHMT2.
Epigenetic therapy has been suggested for treatment of solid tumors. Notably, it has been reported that histone methyltransferase (HMT) inhibitors can suppress NE transformation in prostate cancer (23). We suspected that epigenetics may play an important role in SCLC transformation. We screened a library of 294 epigenetics-related compounds to search for agents that inhibited the growth of the transformed cell lines. The results showed that eight compounds were able to inhibit ≥80% of the growth of T-PC9 cells (Fig. 3A). To exclude the cytotoxic effects of compounds in the cell. Then, we compared the sensitivity of T-PC9 and the parental PC9 cells to these compounds. The results showed that EHMT2 inhibitors (UNC0638 and UNC0642) and EZH2 inhibitors (GSK126) had higher sensitivity in transformed cells (Fig. 3B). This suggests that the histone methyltransferases EHMT2 and EZH2 could be potential targets. This possibility was confirmed by results from the Genomics of Drug Sensitivity in Cancer (GDSC) (Fig. 3C). To define the role of EHMT2 and EZH2 in NE transformation, we tested the sensitivity differences of parental cells and transformed cells to UNC0638, UNC0642, and GSK126 at different concentrations (Fig. 3D and SI Appendix, Fig. S5 A and B). UNC0638 or UNC0642 treatment can make the four cell models have strong and consistent difference effects. But the effect of GSK126 is slight, which suggests that the role of EZH2 in NE transformation may be limited. Western blotting revealed an increase in the abundance of EHMT2 in NE-transformed cells compared to parental cells (Fig. 3E). The expression of EZH2 was not up-regulated in NE-transformed T-PC9, T-H1650, and T-827 cells compared to the parental cells (Fig. 3E and SI Appendix, Fig. S5C). However, there was an increase in the abundance of EZH2 in T-4006 cells compared to parental cells (Fig. 3E). This may explain why T-4006 cells are more sensitive to GSK126 than their parental cells. To examine whether the SCLC transformed depended on EHMT2, the expression of biomarkers were evaluated after pharmacological suppression of EHMT2 by selective inhibitors. The results showed that the expression of EGFR, RB, and YAP increased after UNC0638 treatment, while the expression of CHGA decreased after UNC0638 treatment (Fig. 3F and SI Appendix, Fig. S5D). However, the effect of GSK126 on expression of biomarkers was limited (Fig. 3G and SI Appendix, Fig. S5E). In addition, we observed that the expression of RB was significantly up-regulated in the parental cells treated with UNC0638 or EHMT2 siRNA (SI Appendix, Fig. S4 F and G). To determine whether EHMT2 expression is commonly overexpression in EGFR mutant lung cancers that transform to SCLC, we performed IHC analysis on pretransformation LUADs (n = 3) and posttransformation SCLCs (n = 5) derived from patients, including one matched case (patient #1). The result showed that the expression of EHMT2 and CHGA in post-SCLC is higher than pre-LUAD, whereas the expression of YAP is decreased in pre-LUAD (Fig. 3H). The heatmap shows the H score of seven patients (Fig. 3I). Taken together, these results demonstrate that EHMT2 may play an important role in NE transformation.
Fig. 3.
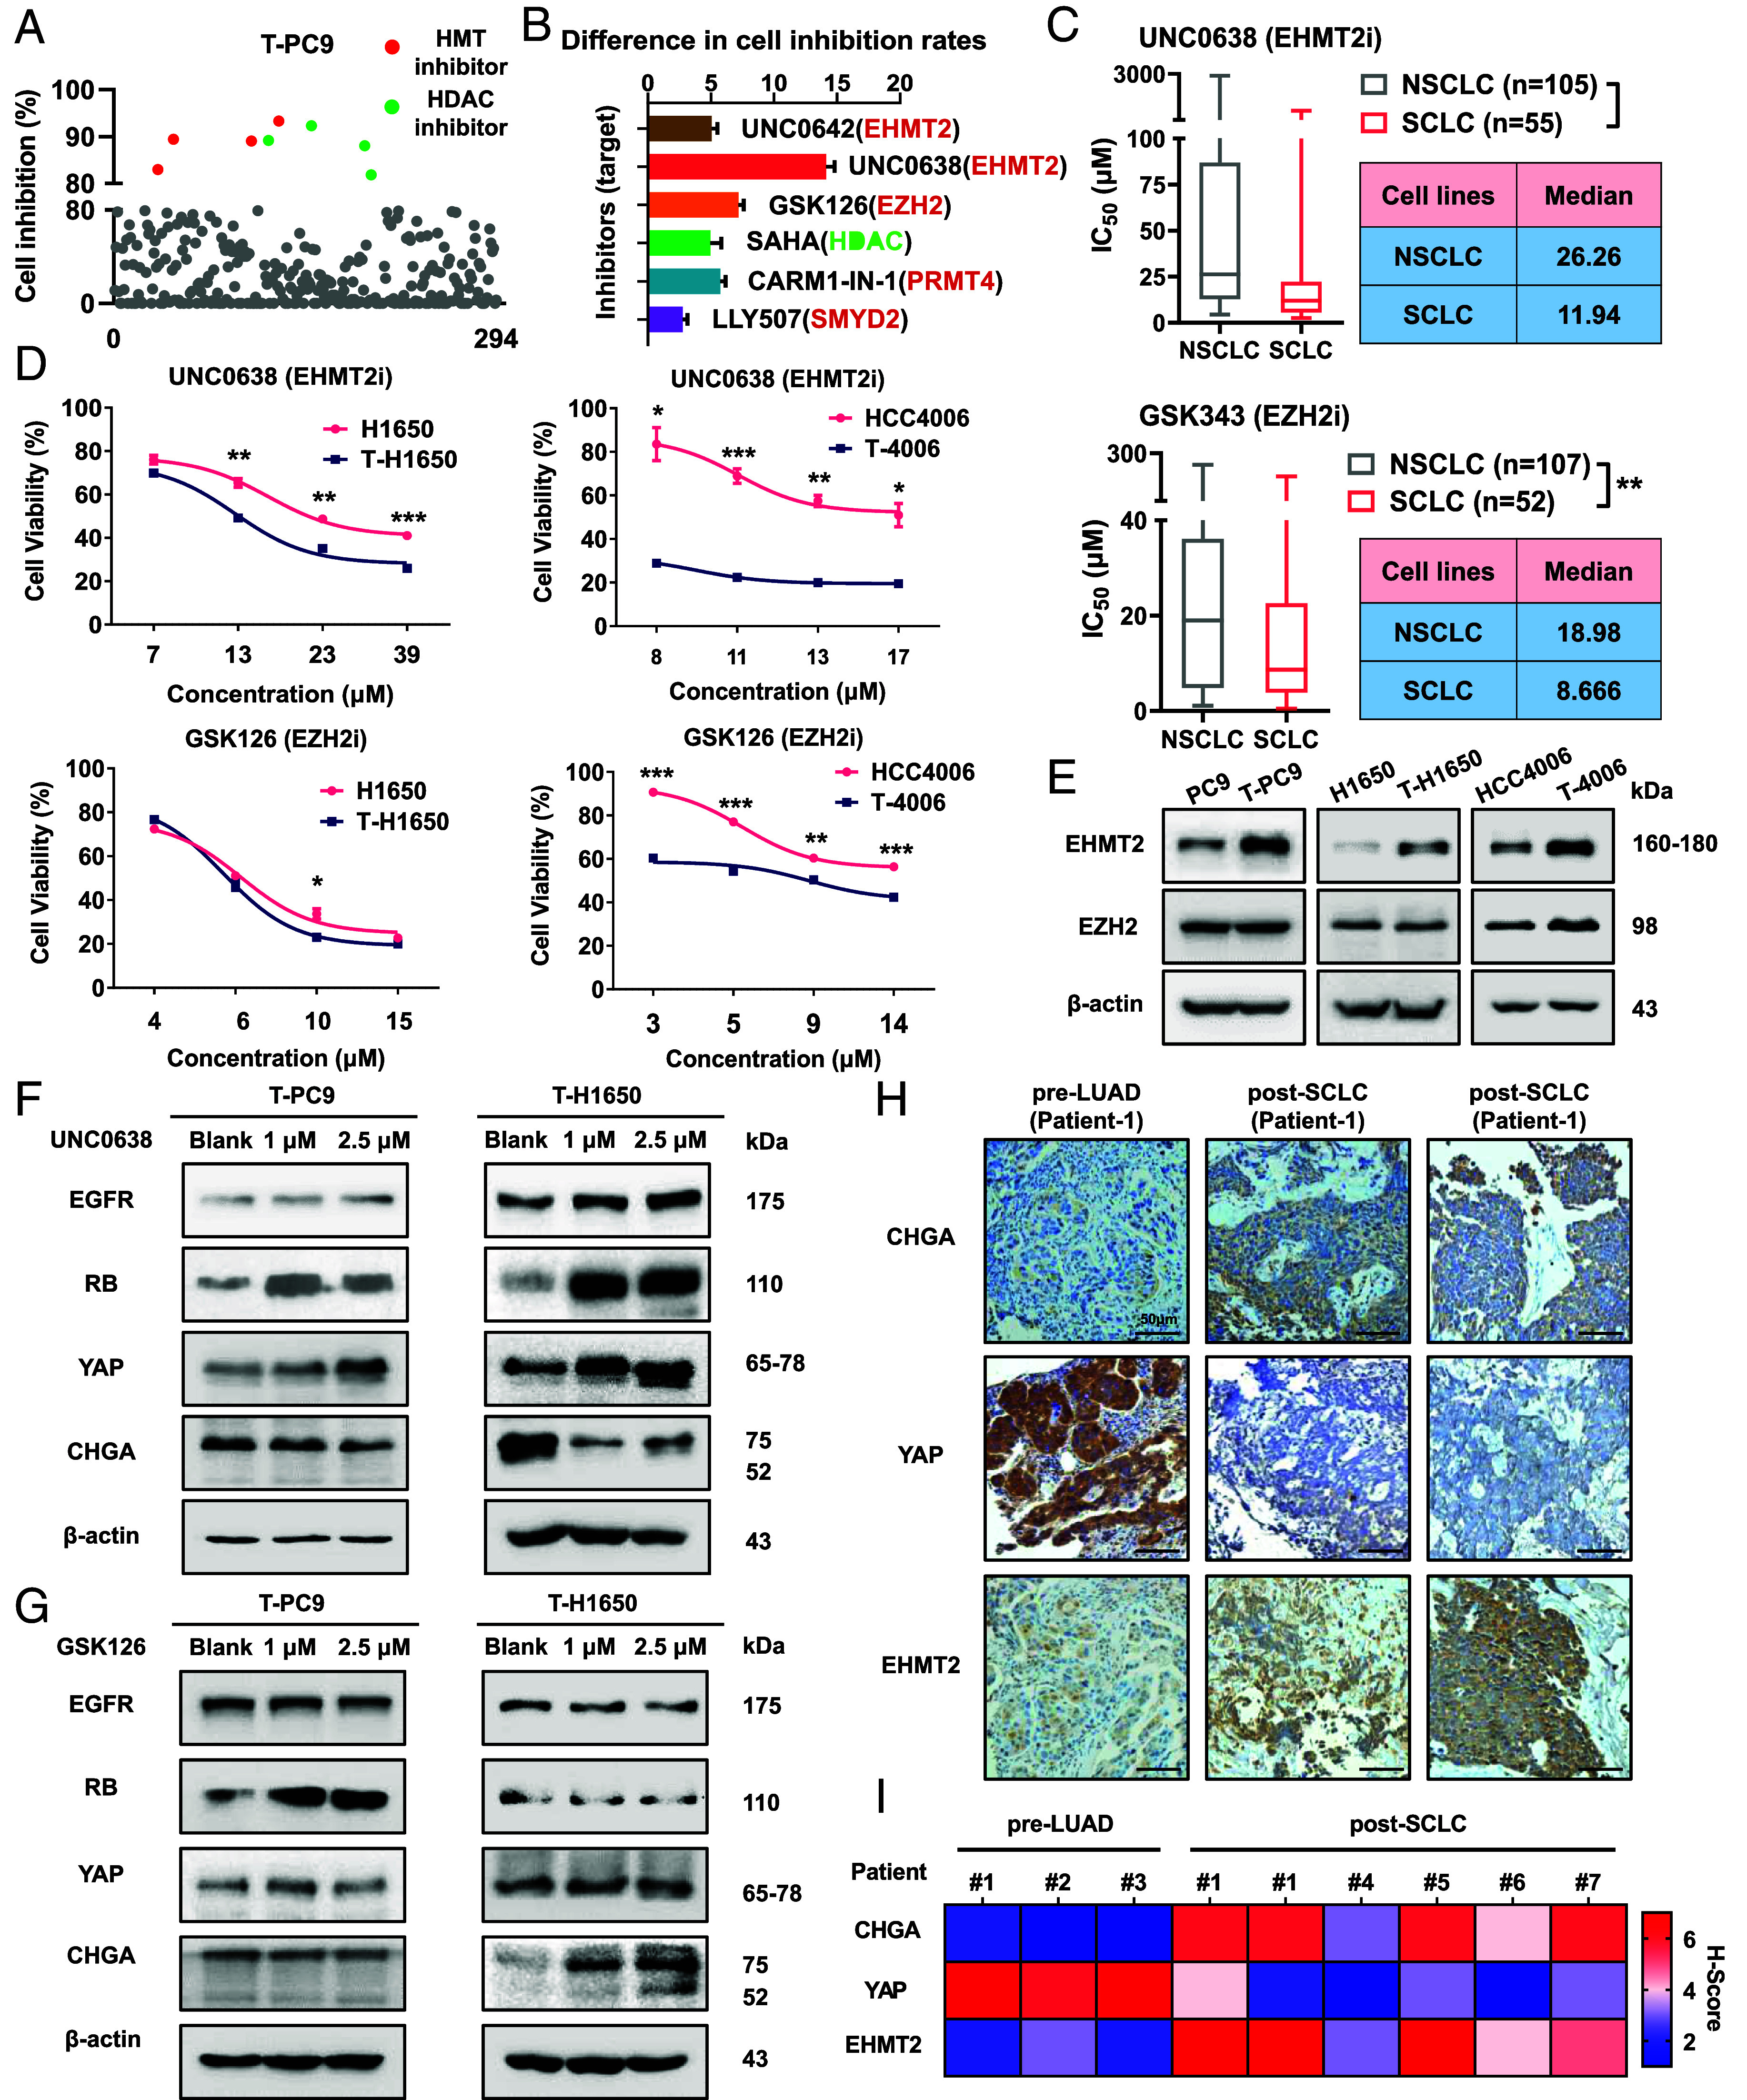
In NE transformation, acquired resistance to EGFR TKIs is associated with EHMT2. (A) Sensitivity of T-PC9 cells to 294 agents (10 μM, 48 h) targeting epigenetics-related processes from an epigenetics compound library. (B) Difference in inhibition rates of the six inhibitors (10 μM, 72 h) between T-PC9 and PC9 cells. (C) IC50 values for UNC0638 and GSK343 in NSCLC and SCLC cell lines. Data are from the GDSC. (D) Sensitivity of NE-transformed cells compared to parental cells to inhibitors at IC20, IC30, IC40, and IC50 values (n = 3). (E) The expression of EHMT2 and EZH2 in paired parental cells and transformed cells. (F and G) Effect of UNC0638 (F) or GSK126 (G) on the protein levels of NE transformation biomarkers (48 h). (H) IHC for total CHGA, YAP, and EHMT2 on a representative pair of matched pre- and postresistant samples from a patient whose resistant EGFR mutant cancer transformed from NSCLC to SCLC (Patient #1). [Scale bar, 50 μm (IHC).] (I) Heatmap showing IHC characterization of CHGA, YAP, and EHMT2 alterations. Data are graphed as means ± SEM. *P < 0.05, **P < 0.01, ***P < 0.001, two-tailed Student’s t test.
Gene Manipulation of Catalytically Active EHMT2 Affects EGFR TKI Resistance in NE Transformation.
Next, we investigated whether EHMT2 affects NE transformation and mediates EGFR-TKI resistance in NE-transformed cells. We treated NE-transformed cells with short hairpin RNA (shRNA) targeting EHMT2 and observed decrease of the H3K9me2 modification (SI Appendix, Fig. S6A). Results from colony formation indicated that EHMT2 knockdown resulted in a higher sensitivity to erlotinib in NE-transformed cells compared with parental cells (Fig. 4A). We wanted to know whether this change results from the reversal of NE transformation. Western blotting revealed an increase in the abundance of EGFR, RB, and YAP and a reduction in CHGA in EHMT2 knockdown cells compared to scramble cells (Fig. 4B and SI Appendix, Fig. S6B). Then, we overexpressed the EHMT2 wild type in parental cells and detected the expression of four biomarkers. The results showed that compared with the control cells, the expressions of EGFR, RB, and YAP in EHMT2-OE parental cells decreased, while the expression of CHGA increased. The above results indicated that EHMT2 overexpression can promote the transformation in EGFR mutant cells (SI Appendix, Fig. S6C). Next, we evaluated the effect of EHMT2 knockdown on sensitivity to both SCLC agent etoposide and irinotecan. Cell viability showed that the knockdown of EHMT2 increased the sensitivity of T-PC9 cells and T-H1650 cells to these agents (Fig. 4C). Consistent results were obtained from colony formation on T-4006 and T-827 (SI Appendix, Fig. S6D).
Fig. 4.
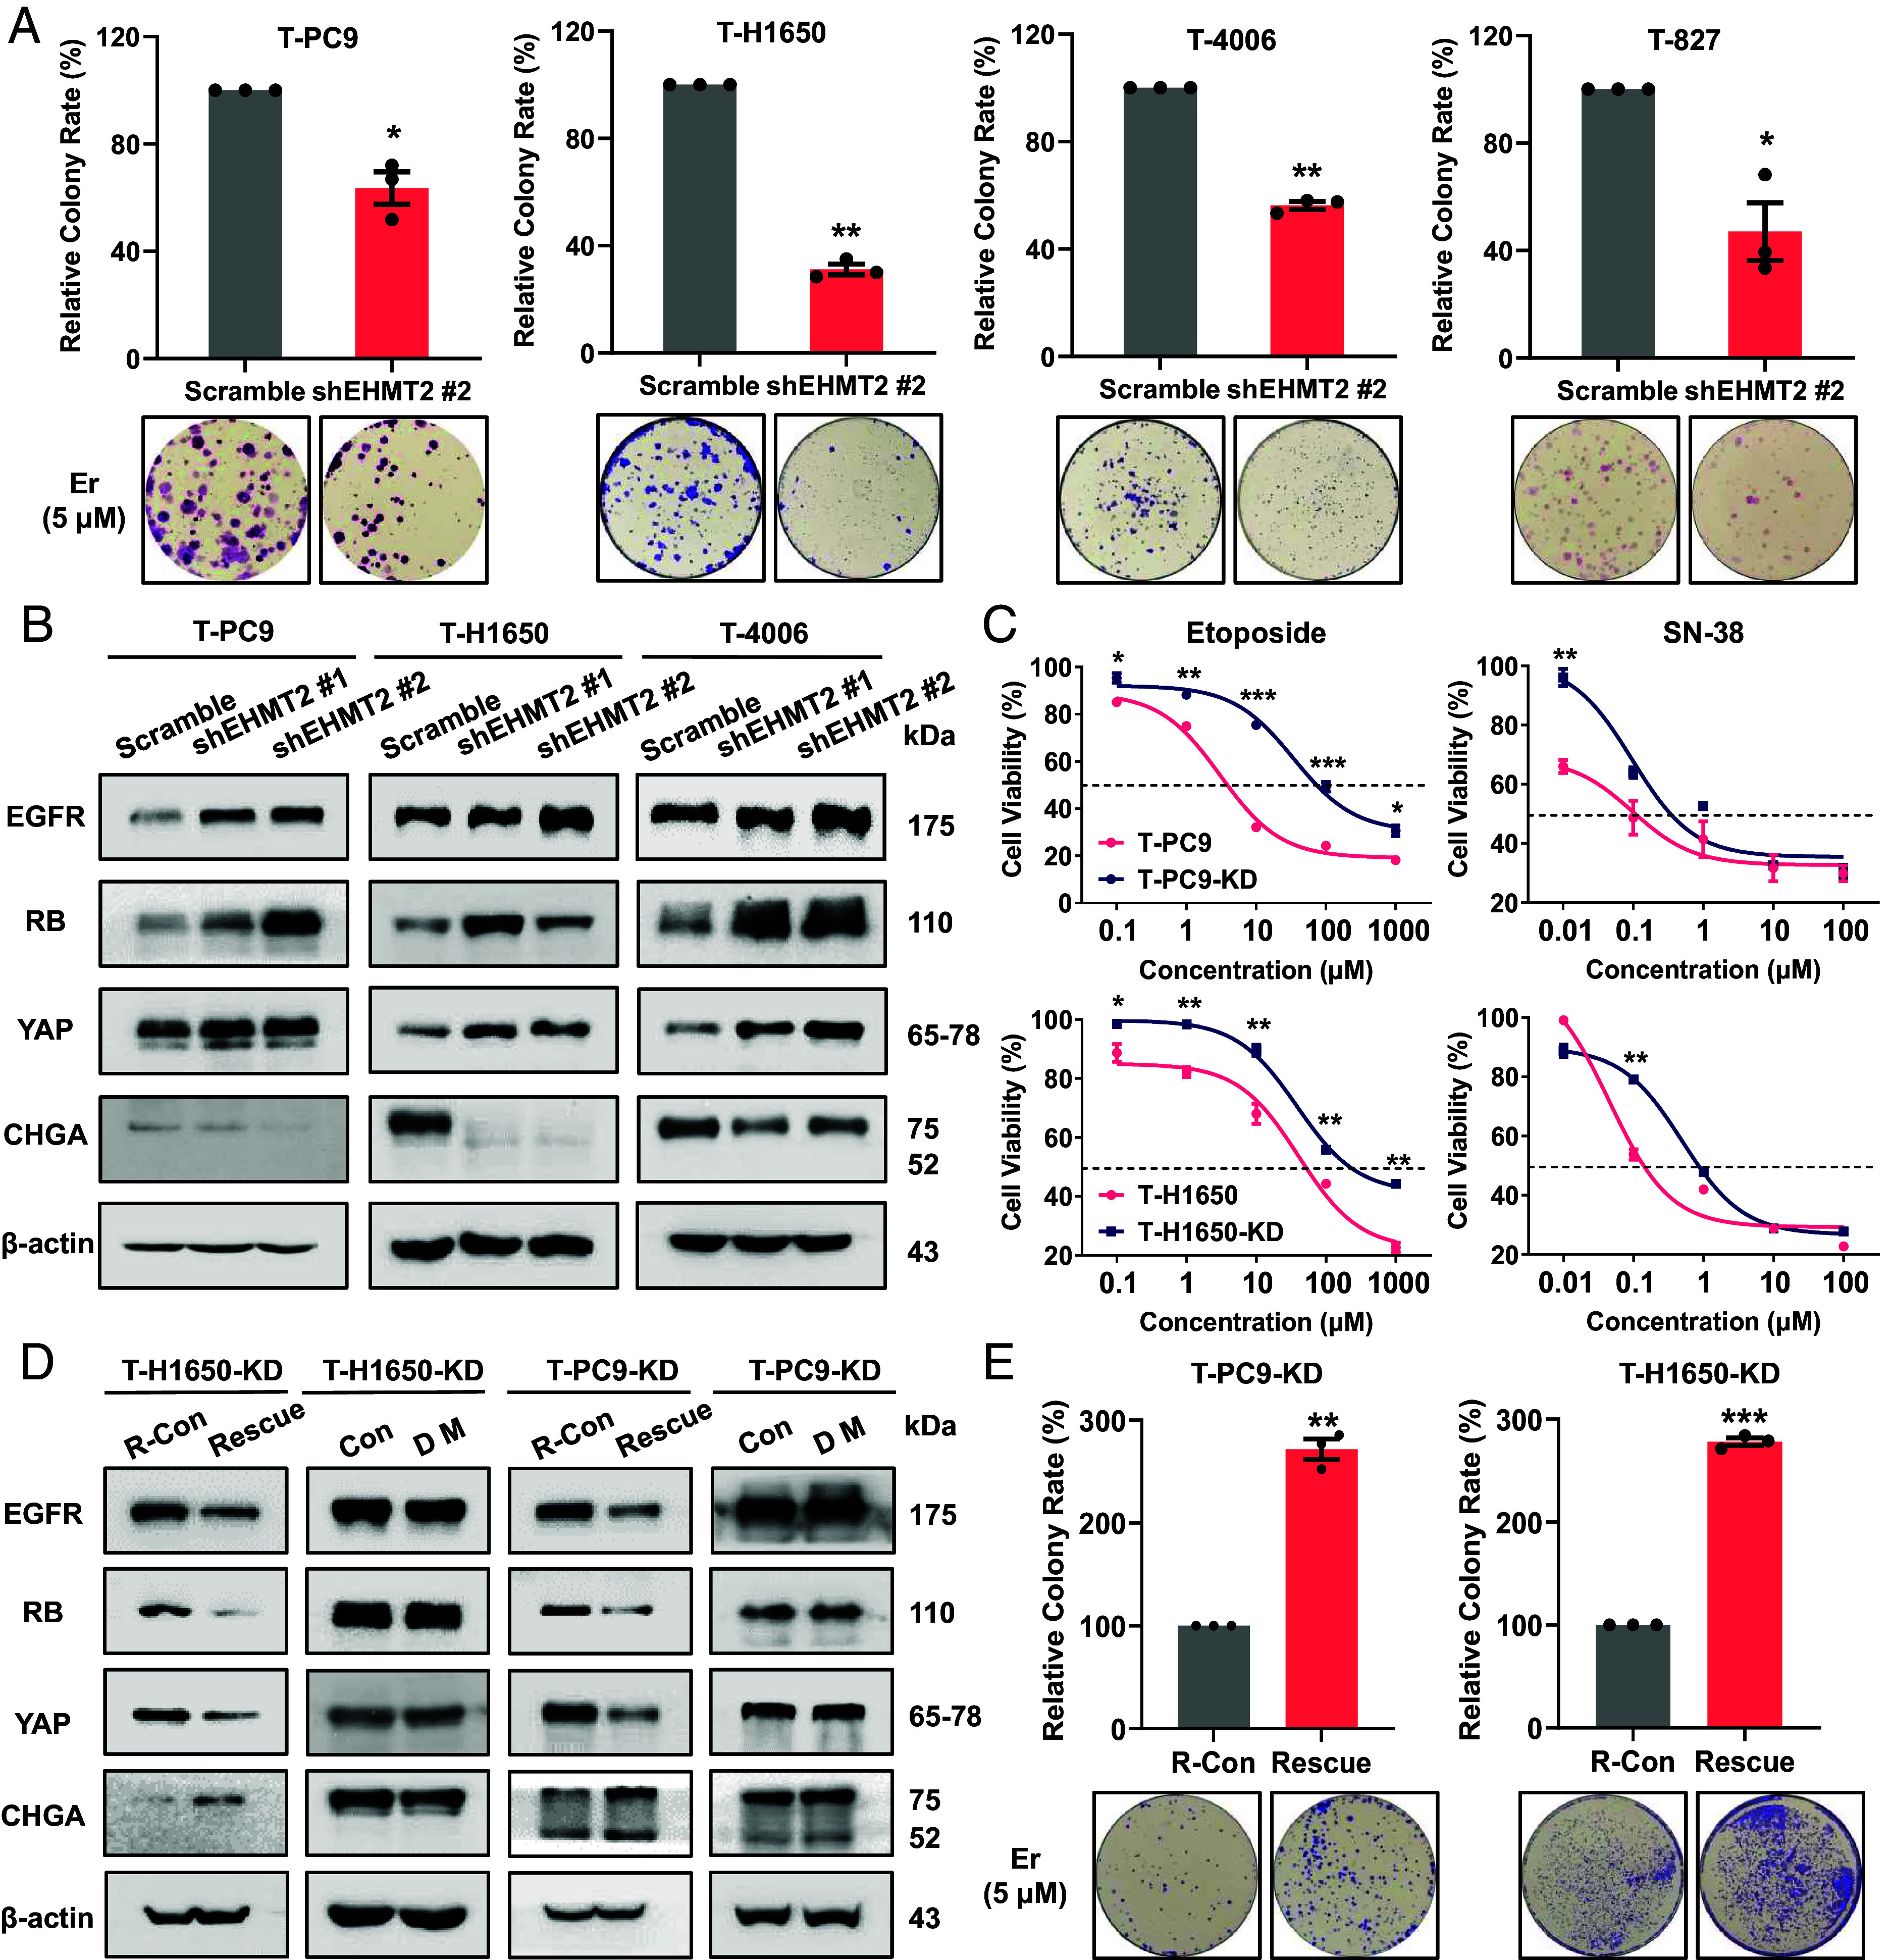
Increased expression of catalytically active EHMT2 contributes to the EGFR-TKI resistance in NE transformation. (A) Colony formation showing the effect of EHMT2 knockdown on erlotinib sensitivity in four NE-transformed cell lines (5 μM, 2 wk). (B) Western blots showing the effect of EHMT2 knockdown on the protein abundance of SCLC transformation markers in NE-transformed cells. (C) Dose–response curves for parental and NE-transformed cells treated with etoposide, and SN-38 for 48 h. (D) EHMT2 knockdown cell lines were subjected to expression of wild-type EHMT2 (R-Con/Rescue) or the catalytically dead mutant H1113K (Con/DM). (E) Colony formation showing the effect of EHMT2 rescue on erlotinib sensitivity in NE transformed cells with EHMT2 knockdown (5 μM, 2 wk). Data are graphed as means ± SEM (n = 3). *P < 0.05, **P < 0.01, ***P < 0.001, two-tailed Student’s t test.
It has been reported that EHMT2 is associated with paclitaxel resistance in NSCLC by catalyzing methylation of H3K9 in a target gene promoter (24). To further determine whether the effect of EHMT2 in NE transformation is dependent on enzyme activity, we overexpressed the EHMT2 wild-type and dead mutant (H1113K) in four EHMT2 knockdown cell lines (SI Appendix, Fig. S7 A and B). The expression of SCLC transformation markers varied significantly in the cells expressing wild-type EHMT2, but not in the cells expressing the dead mutant (Fig. 4D and SI Appendix, Fig. S7C). Predictably, in T-PC9 and T-H1650 knockdown cell lines, overexpression of wild-type EHMT2 significantly increased the sensitivity to erlotinib (Fig. 4E). To rule out the possible influence of different EHMT2 expression levels on NE transformation, we determined the levels of EHMT2 protein in the transformed cell lines without and with expression of wild-type EHMT2 and the dead mutant (SI Appendix, Fig. S7D). The results showed that there were no obvious differences in the expression of EHMT2 in the genetically manipulated cells. These observations highlight that NE transformation is determined not only by the expression level but also by EHMT2 catalytic activity.
EHMT2 Activates the WNT/β-Catenin Pathway in NE Transformation.
To elucidate the underlying mechanism of EHMT2-mediated erlotinib resistance in NE transformation, we performed microarray analysis in T-PC9 (T), UNC0638-treated T-PC9 (RT), and PC9 (P) (Fig. 5A). The gene expression profile in reversed cells (UNC0638-treated T-PC9) may be like parental cells (PC9). Compared with transformed cells, the pathways that are reduced in both parental and reversed cells may be crucial for NE transformation, and they may provide information about therapeutic targets. Pathway analysis showed significant enrichment of 110 pathways in transformed cells compared to parent cells and significant enrichment of 104 pathways in transformed cells compared to UNC0638-treated T-PC9 cells (Fig. 5B). We found that a total of 55 pathways were enriched in overlapping area (SI Appendix, Table S1). The overlapping area occupies half of the T vs. P set or T vs. RT set, which suggests that EHMT2 may play a crucial role in NE transformation. According to the cancer-related characteristics such as stronger cell proliferation and higher cell differentiation after transformation, we reasoned that the WNT/β-catenin pathway, mTOR pathway, TGF-β pathway, and Hippo pathway may be related to NE transformation (Fig. 5B). Then, we examined pathway-related proteins in T-PC9 and PC9 cells. The results indicated that the expression of P-Smad2 and P-Smad3 (TGF-β pathway-related proteins) did not change consistently in T-PC9 cells compared to PC9 cells (SI Appendix, Fig. S8A). Expression changes of other pathway-related proteins were also limited. However, we found a significant increase in the abundance of total and nuclear β-catenin in transformed cells (Fig. 5C and SI Appendix, Fig. S8B). This was supported by protein analyses of patient samples and patient-derived xenografts (PDXs) in the report of Sen et al. (22). The above results suggest that compared with other pathways, the WNT/β-catenin pathway is more likely to play an important role in NE transformation.
Fig. 5.
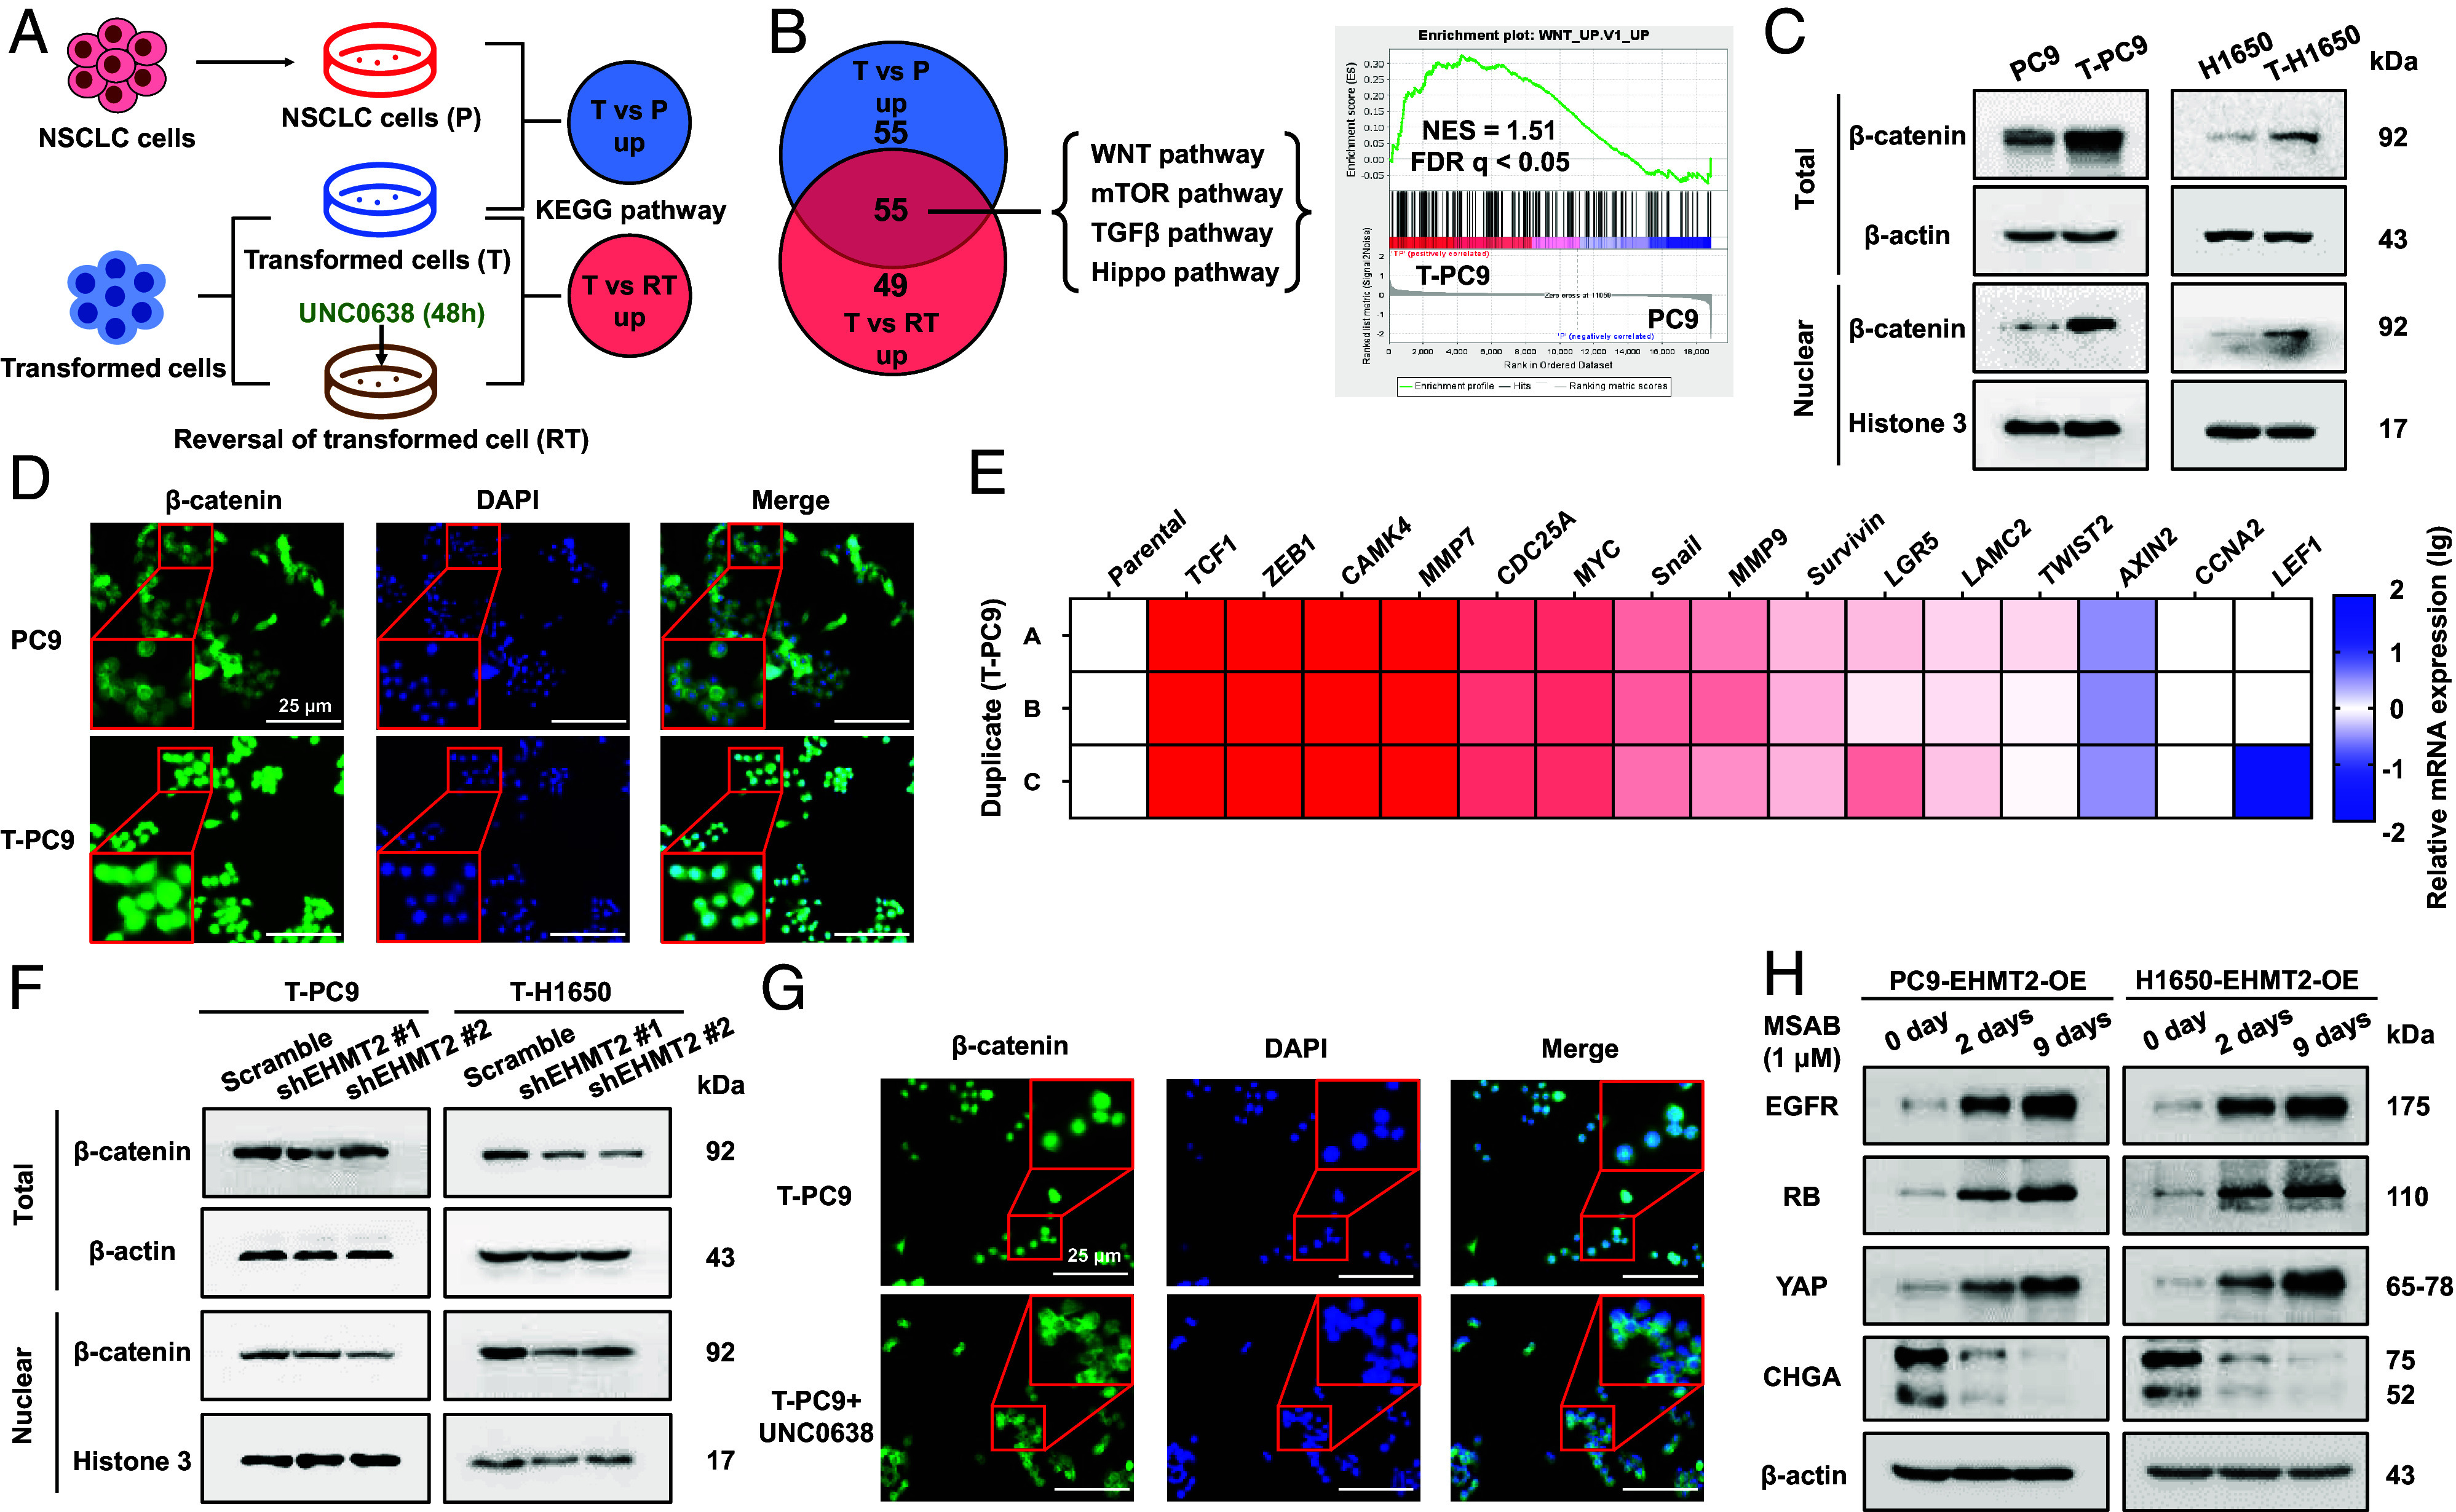
EHMT2 activates the WNT/β-catenin pathway in NE transformation. (A) Gene microarray and KEGG analyses were performed on PC9 cells (P), NE-transformed cells (T-PC9) treated with UNC0638 for 48 h (RT) and untreated NE-transformed cells (T) (three biological replicates for each group). (B, Left) Venn diagram showing cancer-related pathways significantly enriched in T compared to P and RT by KEGG analysis. NES > 2 and P value < 0.05. Right: GSEA enrichment plot of the WNT pathway in T compared to P with the corresponding statistical metrics shown. (C) The abundance of β-catenin protein in the paired parental cells and NE-transformed cells. (D) Immunofluorescence of β-catenin in PC9 and T-PC9 cells. (Scale bars, 25 μm.) (E) Heat map showing mRNA levels of downstream genes activated by the WNT/β-catenin pathway in T-PC9 cells compared to PC9 cells. (F) The effect of EHMT2 knockdown on the abundance of β-catenin protein in NE-transformed cells. (G) Immunofluorescence of β-catenin in T-PC9 cells with UNC0638 treatment (5 μM, 7 d) and without. (Scale bars, 25 μm.) (H) Western blot detected the expression of biomarkers in EHMT2-OE parental cells treat with WNT/β-catenin pathway inhibitors at different time.
β-catenin is a key component of the WNT/β-catenin signaling pathway, and the nuclear translocation of β-catenin symbolizes the activation of the pathway. We analyzed the localization of β-catenin cells in PC9 and T-PC9 cells by immunofluorescence. In PC9 cells, β-catenin was predominantly located in the cytoplasm, whereas in T-PC9 cells, β-catenin was localized in the nucleus (Fig. 5D). In addition, T-PC9 and T-4006 cells display activated expression of genes encoding target proteins of the WNT/β-catenin pathway (Fig. 5E and SI Appendix, Fig. S8C). Western blot showed a lower abundance of total and nuclear β-catenin in the EHMT2-knockdown NE transformed cells compared with the scramble control (Fig. 5F and SI Appendix, Fig. S8D). Immunofluorescence revealed decreased nuclear localization of β-catenin in UNC0638-treated T-PC9 cells (Fig. 5G). The accumulation of β-catenin was also observed in EHMT2 escue cells (SI Appendix, Fig. S8E). To further confirm the role of the WNT/β-catenin pathway in NE transformation, we treated EHMT2 overexpressed parental cells with MSAB, a WNT/β-catenin pathway inhibitor. The results showed that MSAB treatment, especially long-time exposure, could result in the reversal of EHMT2 caused biomarker changes, including EGFR, RB, YAP, and CHGA (Fig. 5H and SI Appendix, Fig. S8F). Altogether, the results reveal that the WNT/β-catenin pathway is involved in NE transformation and demonstrate that activation of the WNT/β-catenin pathway depends on the methylation of H3K9me2.
EHMT2 Up-Regulates the WNT/β-Catenin Pathway by Repressing SFRP1 to Boost NE Transformation and Erlotinib Resistance.
Since EHMT2 is a histone methyltransferase and represses gene transcription by the methylation of H3K9, we hypothesized that EHMT2 regulates a negative regulator of the WNT/β-catenin pathway. ChIP-seq was used to detect the enrichment of H3K9me2 in the promoter region of genes encoding known negative regulators of the WNT/β-catenin pathway, including SFRP1, APC, and DKK1. We verified that the accumulation of H3K9me2 was increased in the SFRP1 promoter region in T-PC9 cells compared with PC9 cells, while accumulation of H3K9me2 was not obviously changed in the APC and DKK1 promoter regions (Fig. 6A). Interestingly, we noticed that H3K9me2 accumulated in the promoter of CDKN2A (encoding p16 protein) (SI Appendix, Fig. S9A). This is consistent with previous reports that p16 leads to the decrease of pRB by inhibiting CDK activity (25). Western blot showed that there was a reduced expression of p16 in transformed cells. After UNC0638 treatment, the expression of p16 in transformed cells increased and the expression of pRB decreased (SI Appendix, Fig. S9 B and C). This may explain the increase of pRB in transformed cells. H3K9me2 accumulation is usually accompanied with Ac-H3 reduction. Based on ChIP-qPCR assay, we verified the reduced enrichment of Ac-H3 in the SFRP1 promoter region in T-PC9 cells compared with PC9 cells (Fig. 6B). Furthermore, we detected the expression of SFRP1 by qPCR and western blot. The results showed that the expression of SFRP1 mRNA and protein were lower in transformed cells than in parental cells (Fig. 6 C and D). The mRNA expression of SFRP1 was significantly increased in transformed cells with UNC0638 treatment (SI Appendix, Fig. S9D). To prove that EHMT2 can regulate the expression of SFRP1, we examined the expression of SFRP1 in NE-transformed cells transfected with scramble or shRNA. The results showed that the expression of SFRP1 was significantly increased after EHMT2 knockdown and significantly reduced in EHMT2 rescue cells (SI Appendix, Fig. S9 E and F). Importantly, the expression of SFRP1 was confirmed in pre- (n = 3) and posttransformation (n = 5) clinical samples, including one matched case (patient #1) (Fig. 6E). This suggests that EHMT2 up-regulates the WNT/β-catenin pathway by repressing SFRP1. Furthermore, western blotting showed decreased expression of β-catenin in the nucleus after SFRP1 overexpression (Fig. 6F and SI Appendix, Fig. S9G). EGFR, RB, and YAP expressions were significantly up-regulated, and CHGA expression was significantly down-regulated in SFRP1-overexpressing cells compared to control cells (Fig. 6G and SI Appendix, Fig. S9H). Consistently, SFRP1 overexpression resensitized these resistant cell lines to erlotinib and reduced the sensitivity to etoposide and SN-38 (Fig. 6H and SI Appendix, Fig. S9I). The above conclusions prove that EHMT2 activates the WNT/β-catenin pathway in SCLC transformation by regulating SFRP1 expression.
Fig. 6.
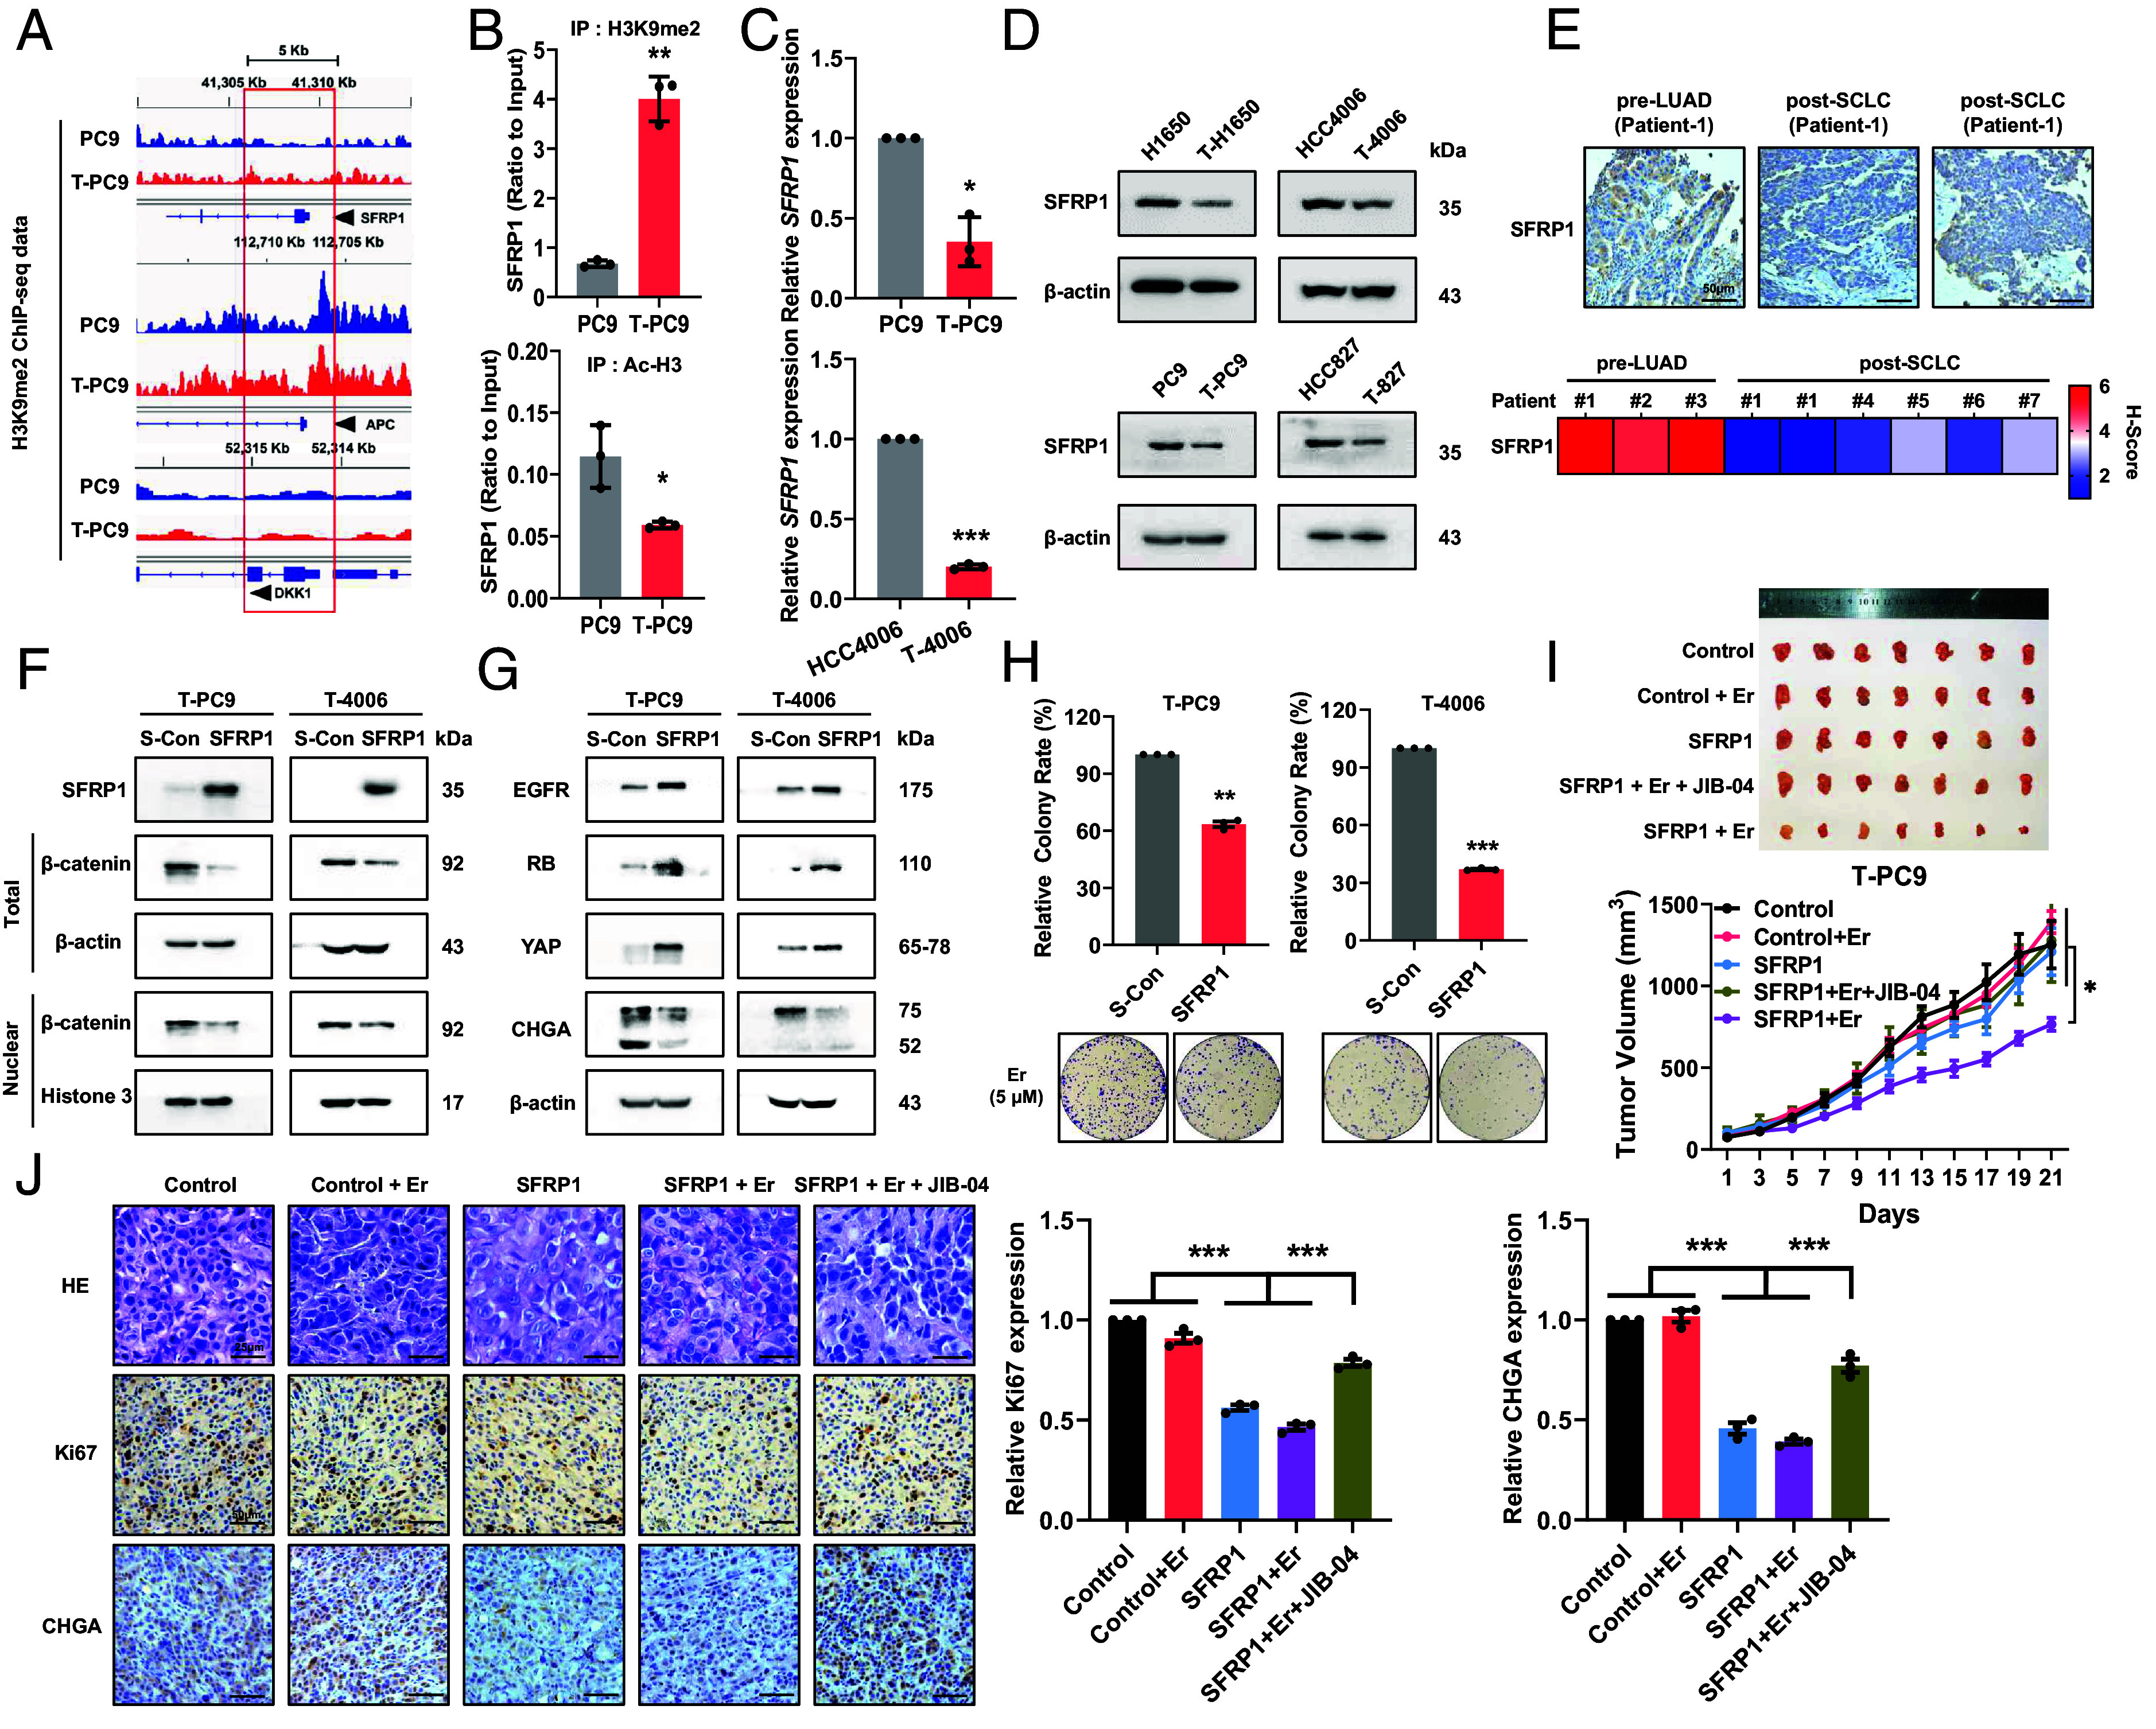
EHMT2 up-regulates the WNT/β-catenin pathway by repressing SFRP1 to boost NE transformation and erlotinib susceptibility. (A) H3K9me2 ChIP-seq reads in PC9 and T-PC9 cells. The analysis was performed on genes encoding negative regulatory factors of the WNT/β-catenin pathway. The promoter regions are enclosed in the red rectangle. (B) ChIP assay for the H3K9me2 (Top) and Ac-H3 (Bottom) modification of the SFRP1 gene in PC9 and T-PC9 cells. (C) SFRP1 mRNA expression in NE-transformed cells was assayed by RT-qPCR analysis compared with parental cells. (D) Western blots showing the abundance of SFRP1 protein in paired parent cells and NE-transformed cells. (E) IHC for total SFRP1 on a representative pair of matched pre- and postresistant samples from a patient whose resistant EGFR mutant cancer transformed from NSCLC to SCLC (Patient #1). [Scale bar, 50 μm (IHC).] (F) Western blots confirming the overexpression of SFRP1 and the abundance of β-catenin protein. (G) Western blots showing the effect of SFRP1 overexpression on the protein abundance of SCLC transformation markers in NE-transformed cells. (H) Colony formation showing the effect of SFRP1 overexpression on erlotinib sensitivity in NE-transformed cells (5 μM, 2 wk). (I) Mice bearing T-PC9 SFRP1-CDX tumors and T-PC9 Control-CDX tumors were treated with erlotinib (13.5 mg/kg, once every 2 d, intraperitoneal injection) or erlotinib combined with JIB-04 (20 mg/kg, once every 3 d, intraperitoneal injection) (n = 7). (J) HE and IHC were performed on sections of xenograft tumors derived from T-PC9 SFRP1-CDX and T-PC9 Control-CDX mice. [Scale bar, 25 μm (HE) or 50 μm (IHC).] Data are graphed as means ± SEM. *P < 0.05, **P < 0.01, ***P < 0.001. In B, C, H, and J, P values were determined using two-tailed Student’s t test. Data from I were analyzed using one-way ANOVA with Tukey’s multiple comparisons test.
Next, we constructed the xenograft tumor model using control and SFRP1-overexpressing T-PC9 cells to investigate whether overexpression of SFRP1 can reverse erlotinib resistance. To further confirm the role of EHMT2-catalyzed methylation in promoting erlotinib resistance, we used erlotinib in combination with JIB-04, a demethylase inhibitor of H3K9me2, in the T-PC9 xenograft group overexpressing SFRP1. In the xenograft model, the tumor volume was significantly smaller in the erlotinib-treated SFRP1 overexpression group as compared with the other groups (Fig. 6I). Significantly, the effect on tumor volume was much more limited in the erlotinib and JIB04 combo-treated SFRP1 overexpression group compared with the erlotinib-treated SFRP1 overexpression group (Fig. 6I). The above results suggest that overexpression of SFRP1 can reverse erlotinib resistance, but JIB-04 treatment can eliminate this effect. Our findings highlight that SFRP1 is the target gene of EHMT2-mediated methylation and plays an important role in NE transformation. Accordingly, overexpression of SFRP1 was observed to make the morphology more similar to NSCLC by HE (Fig. 6J). IHC confirmed that the SFRP1 overexpression can increase the expression of Ki67 and decrease the expression of CHGA (Fig. 6J). In summary, EHMT2 and the demethylase inhibitor JIB-04 affect the susceptibility to erlotinib and the process of SCLC transformation by increasing the level of H3K9me2 in the SFRP1 promoter region, thus inhibiting SFRP1 expression in vitro and in vivo.
Therapeutic Targeting of EHMT2 Delays EGFR-TKI Resistance In Vitro and In Vivo.
After demonstrating the mechanism of EHMT2 promoting NE transformation, we examined whether pharmacological targeting of EHMT2 can delay resistance to erlotinib. We identified changes in the SFRP1 and WNT/β-catenin pathways in UNC0638-treated NE-transformed cells. The results showed that the expression of SFRP1 was enhanced in NE-transformed cells treated with UNC0638, and the expression of β-catenin was significantly decreased in the nucleus (Fig. 7A and SI Appendix, Fig. S10A). The colony formation assay, with gradient doses of erlotinib and UNC0638, demonstrated that inhibition of EHMT2 reverses erlotinib resistance in NE-transformed cells in vitro (Fig. 7B and SI Appendix, Fig. S10B).
Fig. 7.
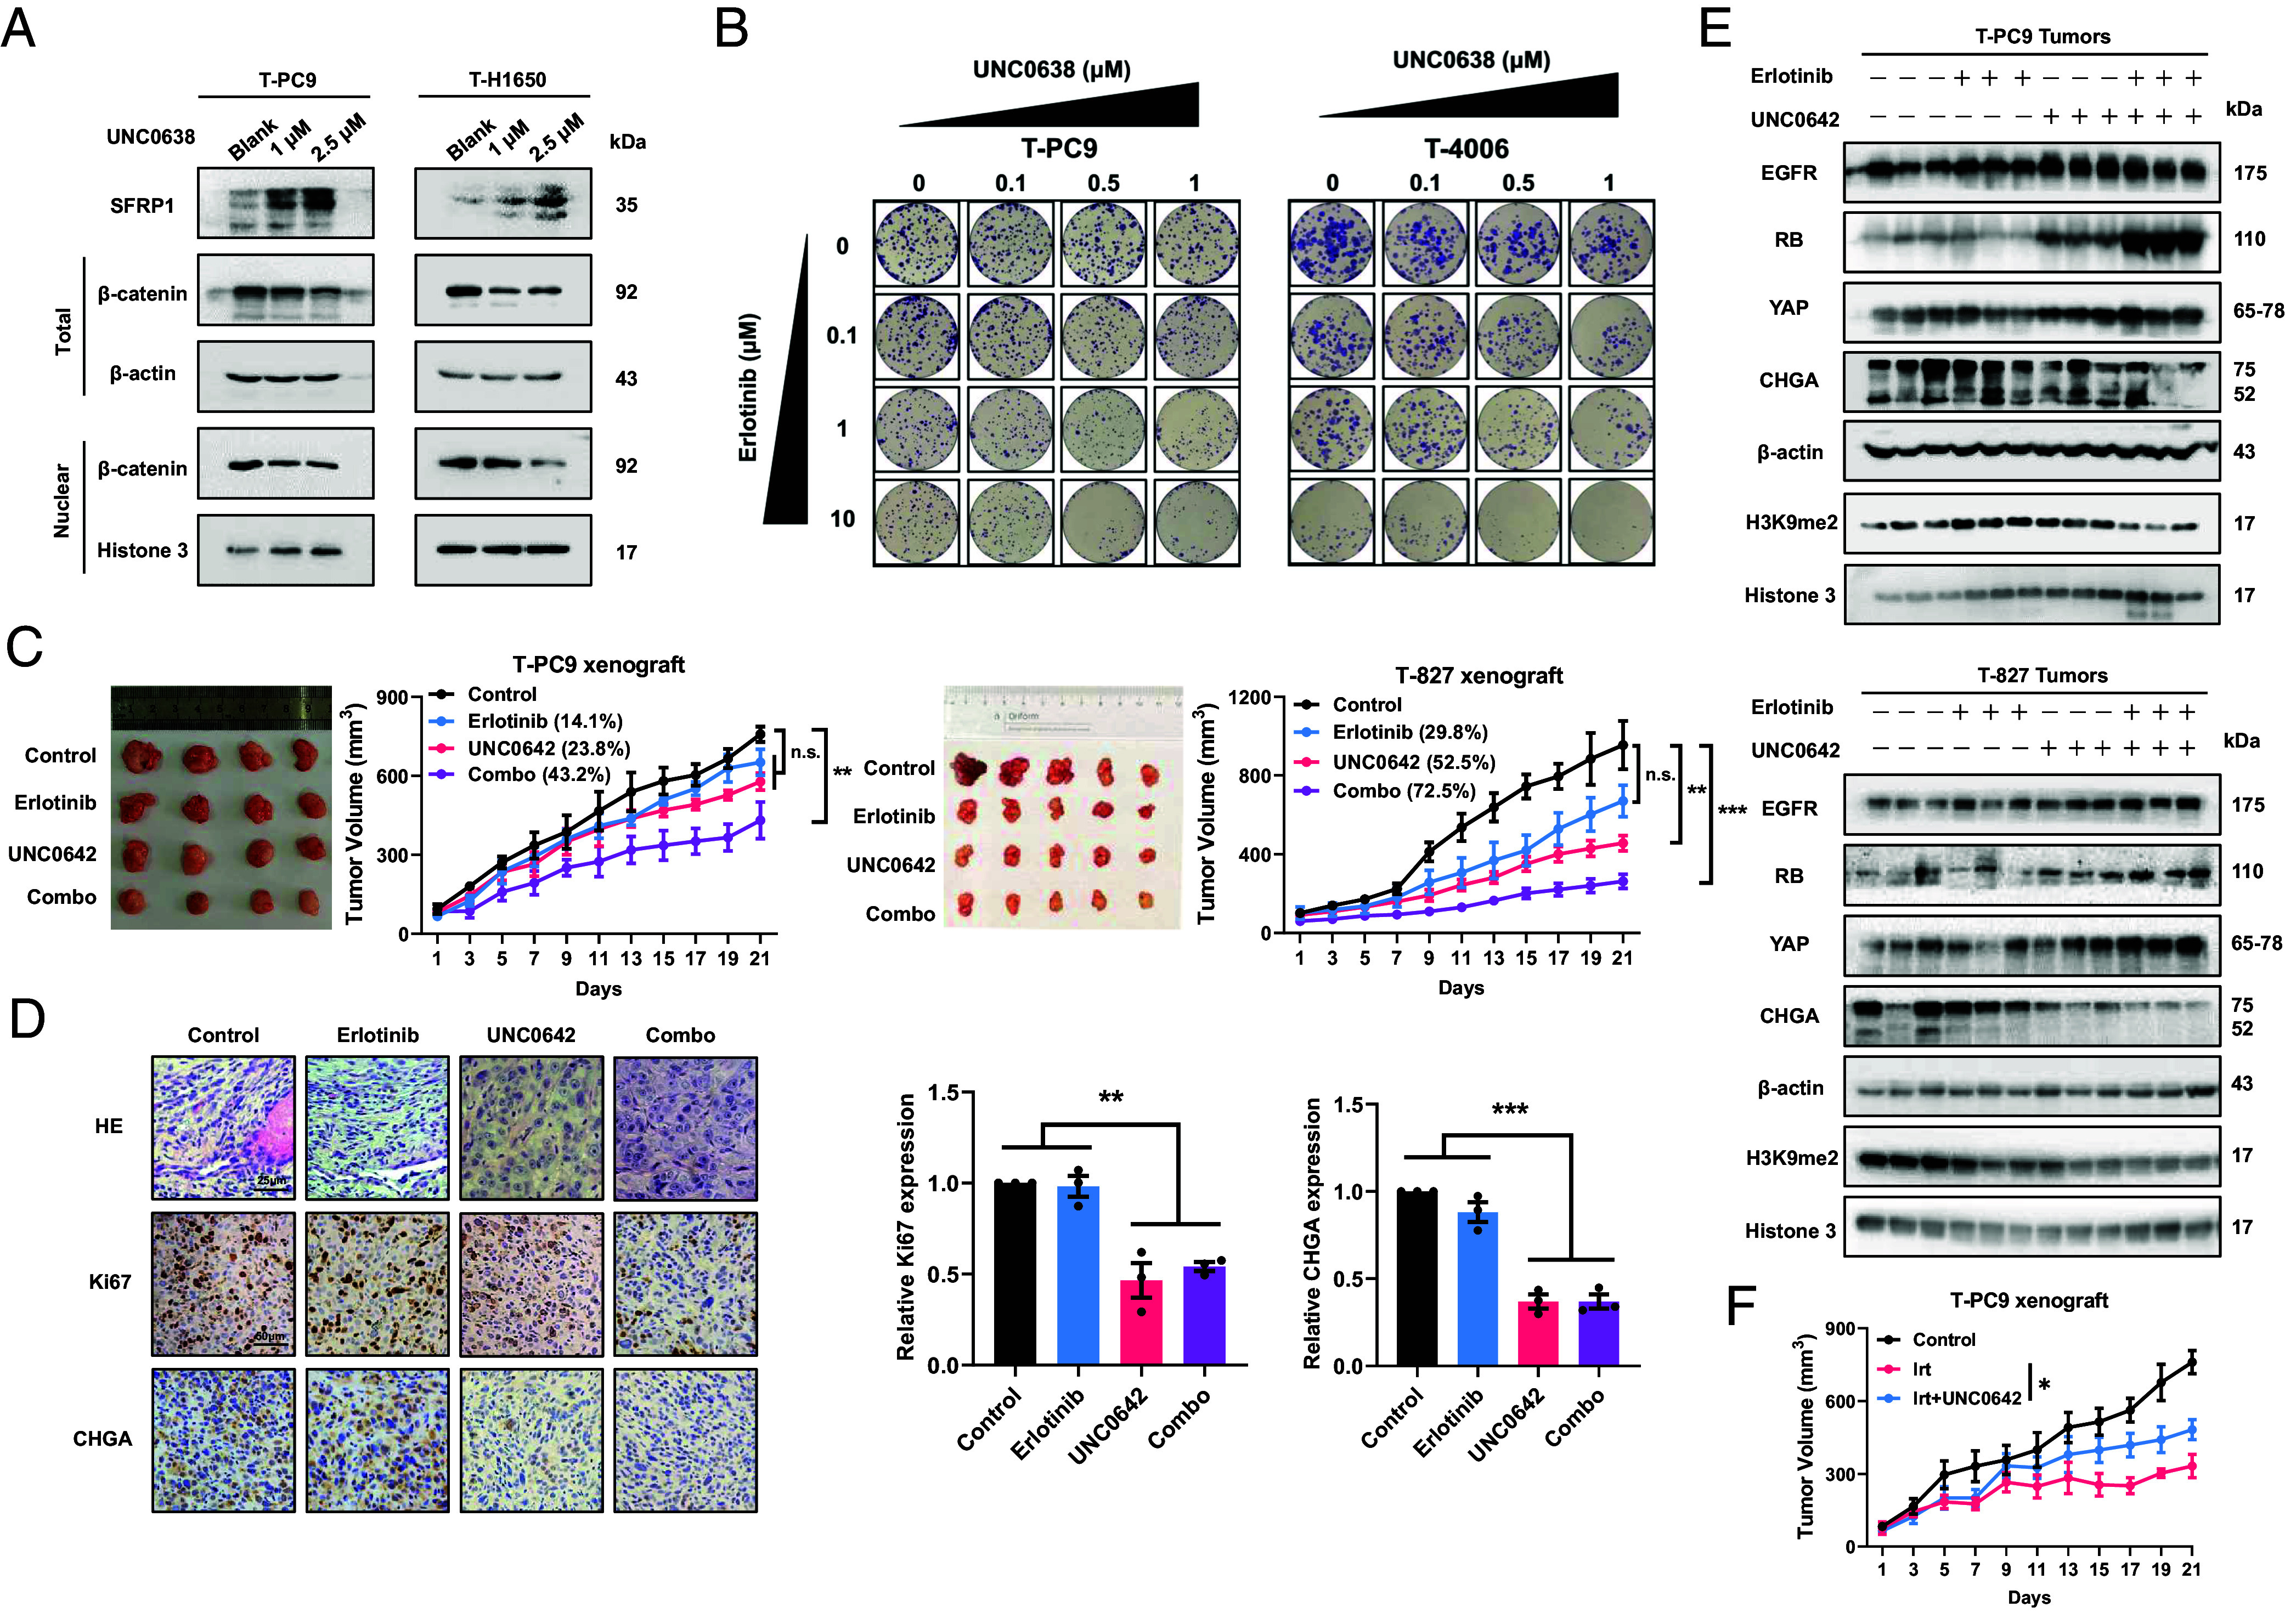
Therapeutic targeting of EHMT2 delays EGFR-TKI resistance and tumor growth in vitro and in vivo. (A) Effect of 48 h UNC0638 treatment on SFRP1 and β-catenin protein abundance in NE-transformed cells. (B) Drug concentration matrices showing the viability of NE-transformed cells after treatment for 2 wk with gradient doses of UNC0638 and erlotinib. (C) Mice carrying T-PC9-CDX tumors (n = 4) and mice bearing T-827-CDX tumors (n = 5) were treated with erlotinib alone (13.5 mg/kg, once every 2 d, intraperitoneal injection) or UNC0642 alone (5 mg/kg, five times a week, intraperitoneal injection) or erlotinib + UNC0642. The graphs show the relative growth inhibition. (D) HE and IHC were performed on sections of xenograft tumors derived from T-PC9-CDX xenograft mice. (Scale bars, 25 μm for HE and 50 μm for IHC.) (E) The expression levels of SCLC transformation markers and H3K9me2 in T-PC9 and T-827-CDX xenograft. (F) Mice carrying T-PC9-CDX tumors were treated with irinotecan alone (10 mg/kg, once every 2 d, intraperitoneal injection) or irinotecan combined with UNC0642 (5 mg/kg, five times a week, intraperitoneal injection) (n = 6). Data are graphed as means ± SEM. *P < 0.05, **P < 0.01, ***P < 0.001. In D, P values were determined using two-tailed Student’s t test. Data from C and F were analyzed using one-way ANOVA with Tukey’s multiple comparisons test.
Next, we determined the resensitization effect of targeting EHMT2 on erlotinib in vivo. In mice treated with erlotinib alone, tumor growth was not significantly reduced compared with the control group (Fig. 7C). Single treatment with UNC0642 would result in the inhibition of tumor growth with inhibition rate of 23.8% and 52.5% for T-PC9 and T-827 xenograft models. Notably, the combination could contribute to an immediate and sustained inhibition for both xenograft models, with inhibition rate of 43.2% and 72.5%, respectively (Fig. 7C). Moreover, in both xenograft models, there was no significant change in body weight between the single-dose groups and the combined treatment group (SI Appendix, Fig. S10 C and D). HE revealed that the EHMT2 inhibitor was able to reverse NE morphology with or without erlotinib in the T-PC9 CDX model. Accordingly, IHC showed that UNC0642 reduced the expression of Ki67 and CHGA (Fig. 7D). Western blot results also showed that the addition of UNC0642 altered the expression of all markers compared to the control group and the single-agent erlotinib group in the T-PC9 and T-827 CDX models (Fig. 7E). We also used the T-PC9 CDX model to test the sensitivity to irinotecan. Similarly, irinotecan can significantly inhibit tumor growth, but this effect is weakened by UNC0642 (Fig. 7F). Together, these results indicate that reversal of erlotinib resistance by EHMT2 inhibitors may be an effective therapeutic strategy in NE-transformed SCLC.
It has been reported that lung cancer patients with NE transformation have poor prognosis compared to lung cancer patients with EGFR mutation (9.5 mo vs. 36.6 mo). Based on our findings, we next analyzed clinical data to explore whether the expression of EHMT2/SFRP1 could predict the prognosis of NE transformation patients. Kaplan–Meier Plotter analysis shows that different expression levels of SFRP1 have no significant effect on prognosis (SI Appendix, Fig. S10 E, Left). However, we found that among patients with high expression of SFRP1, patients with low expression of EHMT2 had better prognosis (SI Appendix, Fig. S10 E, Right). This suggests that, as a target gene of EHMT2, the role of SFRP1 in NE transformation depends on the EHMT2 driver. As combined predictive markers, perhaps simultaneous high expression of EHMT2 and low expression of SFRP1 indicate a high risk of NE transformation.
In conclusion, we confirmed that EHMT2 inhibitors increase erlotinib sensitivity and reverse SCLC transformation in vitro and in vivo by inhibiting the WNT/β-catenin pathway. Based on the clinical data, we raise the possibility of using SFRP1 and EHMT2 as predictive markers for SCLC transformation.
Discussion
EGFR-TKIs has created more survival opportunities for patients with NSCLC, although resistance remains one of the challenges (26). Presently, resistance mechanisms such as T790M mutation have been elucidated and corresponding treatment strategies have been proposed (27). However, exploration of the SCLC transformation mechanism is still limited. SCLC transformation may occur after any TKIs treatment and result in a worse prognosis than for patients with classical SCLC (28, 29). Therefore, understanding SCLC transformation is helpful to improve the survival rate of patients with lung cancer. In this study, we established a SCLC-transformed cell model and confirmed that it simulated clinical samples. This solves the problem of acquiring SCLC transformation samples. To evaluate the SCLC transformation status of tissues or cells, we selected EGFR and YAP as NSCLC-related biomarkers. Then, we have focused on the characteristics of drug holidays, a phenomenon of resensitivity to drugs after drug-resistant patients stop taking drugs, in EGFR-TKI resistance. We identified a mechanism by which EHMT2 activates the WNT/β-catenin pathway by regulating SFRP1, thus promoting SCLC transformation. Finally, we propose a strategy for treating transformed SCLC with EHMT2 inhibitors in combination with erlotinib. EHMT2 inhibitors elicit sensitization to erlotinib both in vivo and in vitro, and they promise to provide potential therapeutic options for clinical treatment.
There are many guesses about the mechanism by which NSCLC is transformed to SCLC. The RB and TP53 mutations were commonly reported in SCLC transformation (30, 31). However, it has been reported that they do not drive complete NE transformation (32, 33). Interestingly, we found the appearance of drug holiday in erlotinib resistance. This reversible sensitivity change is similar to epigenetic regulation (34). Epithelial to mesenchymal transition (EMT), a common phenotypic transformation, is reportedly promoted by epigenetic regulation (35, 36). Similarly, Rickman et al. reported that EZH2 is a key molecule driving the transformation of neuroendocrine prostate cancer (23). Sen et al. proposed enhanced expression of genes involved in the PRC2 complex and PI3K/AKT pathways. Pharmacological inhibition of the PI3K/AKT pathway delayed tumor growth and NE transformation, but the effect of EZH2 inhibitor was limited (22). This suggests that epigenetics may play an important role in SCLC transformation. In this article, we report the involvement of EHMT2 in SCLC transformation, and the transformed cells have higher sensitivity to UNC0638 compared with the parental cells. Although EZH2 is also highly expressed in our models, its role is limited. EHMT2 knockdown or pharmacological inhibition reverses the expression of SCLC transformation markers, resistance to erlotinib, and chemosensitivity, while EZH2 does not have the same effect. We suspect that many epigenetics may be involved in SCLC transformation, but EHMT2 is more effective.
EHMT2 inhibits transcription of downstream genes by increasing H3K9me2 enrichment and has a broad regulatory spectrum (37). The deregulated expression of EHMT2 is associated with EMT, cellular plasticity, and therapy resistance (24, 36, 38). Our results demonstrated that EHMT2 expression and enzymatic activity are up-regulated in SCLC-transformed cells. Either knocking down EHMT2 expression or inhibiting EHMT2 activity resulted in increased sensitivity to erlotinib and decreased sensitivity to irinotecan and etoposide, which suggests that EHMT2 plays an important role in SCLC transformation. We subsequently found that EHMT2 regulates SFRP1 and activates the WNT/β-catenin pathway. The WNT/β-catenin pathway is associated with drug resistance (39), which suggests that EHMT2 is a promising target for the prevention of TKI resistance (40). WNT/β-catenin has been reported to be associated with bone marrow stromal cell transformation and EMT in endometrial carcinoma (41, 42). However, we did not find an association between the WNT/β-catenin pathway and SCLC transformation in other reports. This suggests that the involvement of the WNT/β-catenin pathway in the SCLC transformation might be a finding which will provide a basis for understanding the role of this pathway in TKI drug resistance. The WNT/β-catenin pathway and EHMT2 have been reported in many articles. Xu and Fischer et al. pointed out that EHMT2 can affect the activation of the WNT pathway by regulating the enrichment of H3K9me2 in the promoters of APC and DKK1, which are negative regulators of the WNT/β-catenin pathway (43–45). As a negative regulator of the WNT/β-catenin pathway, SFRP1 has attracted less attention (46, 47). Here, we show that EHMT2 activates WNT by regulating SFRP1, but not by regulating APC or DKK1. This may be a neglected EHMT2-mediated mechanism of WNT pathway regulation, and it implies that EHMT2 can regulate the WNT pathway in different ways.
CHGA and RB are biomarkers of SCLC transformation. However, the lack of molecules characterizing NSCLC is not conducive to a comprehensive evaluation of SCLC transformation. We selected EGFR and YAP as biomarkers reflecting the characteristics of NSCLC according to article and expression lineage differences (32, 48). EGFR, an important molecular and TKI target in NSCLC, was low expressed in classical SCLC. This explains why classical SCLC is insensitive to TKIs (15, 48). Expression of YAP was higher in LUAD than in transformed SCLC (16, 22). This finding is consistent with the oncogenic role of YAP in LUAD and its incompatibility with NE features in lung cancer (49, 50). Clinically, the use of classical neuroendocrine markers in combination with EGFR and YAP may be more advantageous for evaluating the progression of transformation and the choice of treatment.
SCLC has a 5-y survival rate of only 5 to 10% and stronger invasion and metastasis ability than NSCLC (51). Consistent with classical SCLC, the transformed SCLC is sensitive to chemotherapy and is associated with a poor survival rate (52). Platinum-based chemotherapy is widely used to treat transformed SCLC (53). Unfortunately, this strategy has failed to produce satisfactory results. In our study, we found that EHMT2 inhibitor combined with erlotinib inhibited tumor growth in vivo and in vitro. Similar results can be achieved by overexpression of SFRP1. Given the poor prognosis of transformed SCLC, we believe that the addition of EHMT2 inhibitors to provide a prophylactic can be considered in patients with NSCLC. Furthermore, both the WNT/β-catenin pathway (NCT02278133, NCT02649530) and EHMT2 (54, 55) have small-molecule drugs in the clinical trial or preclinical study. This may provide a basis for clinical development of therapies for transformed SCLC.
The TKI-induced transformed cell model is a promising way to study SCLC transformation, but there are also some limitations. Many factors, such as tumor microenvironment and heterogeneity, participated in transformation process. However, the cell model cannot completely simulate the clinical patients’ environment, although it is credible to evaluate the cell model through biomarkers specified by NCCN. Recently, Varmus et al. reported that MYC is important for SCLC transformation by genetically engineering mice (56). In fact, MYC, as one of the important proto-oncogenes downstream of the WNT/β-catenin pathway, has also been proven to be highly expressed in our established SCLC transformation model (Fig. 5E). However, the pathophysiology process of TKI induction and genetic engineering in vivo may be different. Therefore, we think that the SCLC transformation by TKI induction in mice carrying NSCLC may be a candidate promising and worth further investigated model which could reflect tumor microenvironment and heterogeneity.
In summary, we show that EHMT2 regulates SFRP1 to drive the NE phenotype in NSCLC and provides targeted strategies for late transformation to SCLC dominated by EHMT2 and the WNT/β-catenin pathway (Fig. 8). Our report sheds light on the molecular mechanisms of SCLC transformation, linking the WNT/β-catenin pathway to phenotypic transformation. From the perspective of epigenetics, regulation of EHMT2 target genes is added and a regulatory mechanism between epigenetic regulation and the WNT pathway is revealed. We hope that the results of this study can provide a theoretical basis and add treatment choices for therapy of transformed SCLC.
Fig. 8.

Schematic diagram. (Top) EHMT2 regulates SFRP1 to activate the WNT/β-catenin pathway and drive the neuroendocrine phenotype in NSCLC. (Bottom) Targeted strategies for treatment of SCLC caused by EHMT2-mediated phenotypic transformation.
Materials and Methods
To explore the role of EHMT2 in NE transformation, we developed preclinical NE transformation models to screen potential epigenetic regulatory enzymes. Samples from patients with pretransformation LUADs (n = 3) and posttransformation SCLCs (n = 5), including one matched case (patient #1), were used to prove our conclusion. Western blot, clonal formation, and cell viability to analyze the expressions of EHMT2 and biomarkers, and drug sensitivity in NE-transformed models. ChIP-seq and qPCR were used to explore whether EHMT2 targets SFRP1 to drive SCLC transformation. For xenograft models, tumor cells were injected into the right flank of 6- to 8-wk-old Balb/c-nu mice. When the tumors reached 50 to 80 mm3, the mouse models were divided into different groups. Samples were collected with the consent of patients and approved by the ethics committee. Human specimens and more detailed methods are provided in SI Appendix.
Supplementary Material
Appendix 01 (PDF)
Dataset S01 (XLSX)
Acknowledgments
We express our gratitude to all of the patients and their families for giving both the gift of life and the gift of knowledge by their donations. This work was supported by grants from the National Natural Science Foundation of China (nos. 81773216 to L. Wang.; 82373344 to W.C.); Natural Science Foundation of Shenyang (22-315-6-11 to L. Wang.); Zhongyuan Qianren Jihua (nos. ZYQR201912118 to Q.W.); Henan International Joint Laboratory of drug resistance and reversal of targeted therapy for lung cancer (nos. [2021]10 to Q.W.); Henan Medical Key Laboratory of Refractory lung cancer (nos. [2020]27 to Q.W.); Henan Refractory Lung Cancer Drug Treatment Engineering Technology Research Center (nos. [2020]4 to Q.W.).
Author contributions
L. Wang designed research; C.Y., J.Z., Y.H., L. Wan, W.Z., X.D., W.Y., Y.C., and L.G. performed research; W.Z., W.Y., W.C., L.J., J.Y., C.W., and Q.W. analyzed data; and C.Y., S.M., and L. Wang wrote the paper.
Competing interests
The authors declare no competing interest.
Footnotes
This article is a PNAS Direct Submission. D.A.B. is a guest editor invited by the Editorial Board.
Contributor Information
Qiming Wang, Email: qimingwang1006@126.com.
Lihui Wang, Email: lhwang@syphu.edu.cn.
Data, Materials, and Software Availability
Accession codes for datasets are as follows: microarray, RNA-seq, and ChIP-seq are at GEO (GSE242843, GSE244140, GSE242305) (57–59). WES results have been uploaded to SRA database (PRJNA1071558) (60). All other data are included in the manuscript and/or supporting information.
Supporting Information
References
- 1.Thai A. A., Solomon B. J., Sequist L. V., Gainor J. F., Heist R. S., Lung cancer. Lancet 398, 535–554 (2021). [DOI] [PubMed] [Google Scholar]
- 2.Sung H., et al. , Global cancer statistics 2020: GLOBOCAN estimates of incidence and mortality worldwide for 36 cancers in 185 countries. CA Cancer J. Clin. 71, 209–249 (2021). [DOI] [PubMed] [Google Scholar]
- 3.Meador C. B., Sequist L. V., Piotrowska Z., Targeting EGFR exon 20 insertions in non-small cell lung cancer: Recent advances and clinical updates. Cancer Discov. 11, 2145–2157 (2021). [DOI] [PMC free article] [PubMed] [Google Scholar]
- 4.Wu S. G., Shih J. Y., Management of acquired resistance to EGFR TKI-targeted therapy in advanced non-small cell lung cancer. Mol. Cancer 17, 38 (2018). [DOI] [PMC free article] [PubMed] [Google Scholar]
- 5.Remon J., Steuer C. E., Ramalingam S. S., Felip E., Osimertinib and other third-generation EGFR TKI in EGFR-mutant NSCLC patients. Ann. Oncol. 29, i20–i27 (2018). [DOI] [PubMed] [Google Scholar]
- 6.Lim S. M., Kim C. G., Lee J. B., Cho B. C., Patritumab Deruxtecan: Paving the way for EGFR-TKI-resistant NSCLC. Cancer Discov. 12, 16–19 (2022). [DOI] [PubMed] [Google Scholar]
- 7.Takezawa K., et al. , HER2 amplification: A potential mechanism of acquired resistance to EGFR inhibition in EGFR-mutant lung cancers that lack the second-site EGFR T790M mutation. Cancer Discov. 2, 922–933 (2012). [DOI] [PMC free article] [PubMed] [Google Scholar]
- 8.Bean J., et al. , MET amplification occurs with or without T790M mutations in EGFR mutant lung tumors with acquired resistance to gefitinib or erlotinib. Proc. Natl. Acad. Sci. U.S.A. 104, 20932–20937 (2007). [DOI] [PMC free article] [PubMed] [Google Scholar]
- 9.Sequist L. V., et al. , Genotypic and histological evolution of lung cancers acquiring resistance to EGFR inhibitors. Sci. Transl. Med. 3, 75ra26 (2011). [DOI] [PMC free article] [PubMed] [Google Scholar]
- 10.Yu H. A., et al. , Analysis of tumor specimens at the time of acquired resistance to EGFR-TKI therapy in 155 patients with EGFR-mutant lung cancers. Clin Cancer Res. 19, 2240–2247 (2013). [DOI] [PMC free article] [PubMed] [Google Scholar]
- 11.Ohashi K., Maruvka Y. E., Michor F., Pao W., Epidermal growth factor receptor tyrosine kinase inhibitor-resistant disease. J. Clin. Oncol. 31, 1070–1080 (2013). [DOI] [PMC free article] [PubMed] [Google Scholar]
- 12.Cross D. A., et al. , AZD9291, an irreversible EGFR TKI, overcomes T790M-mediated resistance to EGFR inhibitors in lung cancer. Cancer Discov. 4, 1046–1061 (2014). [DOI] [PMC free article] [PubMed] [Google Scholar]
- 13.Ballard P., et al. , Preclinical comparison of osimertinib with other EGFR-TKIs in EGFR-mutant NSCLC brain metastases models, and early evidence of clinical brain metastases activity. Clin. Cancer Res. 22, 5130–5140 (2016). [DOI] [PubMed] [Google Scholar]
- 14.Wang Q., Yang S., Wang K., Sun S. Y., MET inhibitors for targeted therapy of EGFR TKI-resistant lung cancer. J. Hematol. Oncol. 12, 63 (2019). [DOI] [PMC free article] [PubMed] [Google Scholar]
- 15.Byers L. A., et al. , Proteomic profiling identifies dysregulated pathways in small cell lung cancer and novel therapeutic targets including PARP1. Cancer Discov. 2, 798–811 (2012). [DOI] [PMC free article] [PubMed] [Google Scholar]
- 16.Ito T., et al. , Loss of YAP1 defines neuroendocrine differentiation of lung tumors. Cancer Sci. 107, 1527–1538 (2016). [DOI] [PMC free article] [PubMed] [Google Scholar]
- 17.Offin M., et al. , Concurrent RB1 and TP53 alterations define a subset of EGFR-mutant lung cancers at risk for histologic transformation and inferior clinical outcomes. J. Thorac. Oncol. 14, 1784–1793 (2019). [DOI] [PMC free article] [PubMed] [Google Scholar]
- 18.Quintanal-Villalonga A., et al. , Lineage plasticity in cancer: A shared pathway of therapeutic resistance. Nat. Rev. Clin. Oncol. 17, 360–371 (2020). [DOI] [PMC free article] [PubMed] [Google Scholar]
- 19.Knudsen E. S., Knudsen K. E., Tailoring to RB: Tumour suppressor status and therapeutic response. Nat. Rev. Cancer 8, 714–724 (2008). [DOI] [PMC free article] [PubMed] [Google Scholar]
- 20.Meuwissen R., et al. , Induction of small cell lung cancer by somatic inactivation of both Trp53 and Rb1 in a conditional mouse model. Cancer Cell 4, 181–189 (2003). [DOI] [PubMed] [Google Scholar]
- 21.Du L., et al. , MicroRNA expression distinguishes SCLC from NSCLC lung tumor cells and suggests a possible pathological relationship between SCLCs and NSCLCs. J. Exp. Clin. Cancer Res. 29, 75 (2010). [DOI] [PMC free article] [PubMed] [Google Scholar]
- 22.Quintanal-Villalonga A., et al. , Multiomic analysis of lung tumors defines pathways activated in neuroendocrine transformation. Cancer Discov. 11, 3028–3047 (2021). [DOI] [PMC free article] [PubMed] [Google Scholar]
- 23.Dardenne E., et al. , N-Myc induces an EZH2-mediated transcriptional program driving neuroendocrine prostate cancer. Cancer Cell 30, 563–577 (2016). [DOI] [PMC free article] [PubMed] [Google Scholar]
- 24.Wang W., et al. , An EHMT2/NFYA-ALDH2 signaling axis modulates the RAF pathway to regulate paclitaxel resistance in lung cancer. Mol. Cancer 21, 106 (2022). [DOI] [PMC free article] [PubMed] [Google Scholar]
- 25.Dick F. A., Goodrich D. W., Sage J., Dyson N. J., Non-canonical functions of the RB protein in cancer. Nat. Rev. Cancer 18, 442–451 (2018). [DOI] [PMC free article] [PubMed] [Google Scholar]
- 26.Greenhalgh J., et al. , First-line treatment of advanced epidermal growth factor receptor (EGFR) mutation positive non-squamous non-small cell lung cancer. Cochrane Database Syst. Rev. CD010383 (2016), 10.1002/14651858.CD010383.pub2. [DOI] [PubMed] [Google Scholar]
- 27.Zhao Y., et al. , Efficacy and safety of first line treatments for patients with advanced epidermal growth factor receptor mutated, non-small cell lung cancer: Systematic review and network meta-analysis. BMJ 367, l5460 (2019). [DOI] [PMC free article] [PubMed] [Google Scholar]
- 28.Xia G., et al. , Transformation of ALK-positive NSCLC to SCLC after alectinib resistance and response to combined atezolizumab: A case report. Transl. Lung Cancer Res. 12, 637–646 (2023). [DOI] [PMC free article] [PubMed] [Google Scholar]
- 29.He J., Huang Z., Han L., Gong Y., Xie C., Mechanisms and management of 3rd-generation EGFR-TKI resistance in advanced non-small cell lung cancer (Review). Int. J. Oncol. 59, 90 (2021). [DOI] [PMC free article] [PubMed] [Google Scholar]
- 30.Lin M. W., et al. , Clinicopathological and genomic comparisons between different histologic components in combined small cell lung cancer and non-small cell lung cancer. Lung Cancer 125, 282–290 (2018). [DOI] [PubMed] [Google Scholar]
- 31.Lee J. K., et al. , Clonal history and genetic predictors of transformation into small cell carcinomas from lung adenocarcinomas. J. Clin. Oncol. 35, 3065–3074 (2017). [DOI] [PubMed] [Google Scholar]
- 32.Niederst M. J., et al. , RB loss in resistant EGFR mutant lung adenocarcinomas that transform to small-cell lung cancer. Nat. Commun. 6, 6377 (2015). [DOI] [PMC free article] [PubMed] [Google Scholar]
- 33.Yin X., et al. , Small cell lung cancer transformation: From pathogenesis to treatment. Semin. Cancer Biol. 86, 595–606 (2022). [DOI] [PubMed] [Google Scholar]
- 34.Shaurova T., Zhang L., Goodrich D. W., Hershberger P. A., Understanding lineage plasticity as a path to targeted therapy failure in EGFR-mutant non-small cell lung cancer. Front. Genet. 11, 281 (2020). [DOI] [PMC free article] [PubMed] [Google Scholar]
- 35.Nachiyappan A., Gupta N., Taneja R., EHMT1/EHMT2 in EMT, cancer stemness and drug resistance: Emerging evidence and mechanisms. FEBS J. 289, 1329–1351 (2022). [DOI] [PubMed] [Google Scholar]
- 36.Dong C., et al. , Loss of FBP1 by Snail-mediated repression provides metabolic advantages in basal-like breast cancer. Cancer Cell 23, 316–331 (2013). [DOI] [PMC free article] [PubMed] [Google Scholar]
- 37.Yang C., et al. , Histone methyltransferase and drug resistance in cancers. J. Exp. Clin. Cancer Res. 39, 173 (2020). [DOI] [PMC free article] [PubMed] [Google Scholar]
- 38.Watson Z. L., et al. , Histone methyltransferases EHMT1 and EHMT2 (GLP/G9A) maintain PARP inhibitor resistance in high-grade serous ovarian carcinoma. Clin. Epigenet. 11, 165 (2019). [DOI] [PMC free article] [PubMed] [Google Scholar]
- 39.Liu X., et al. , Sec62 promotes stemness and chemoresistance of human colorectal cancer through activating Wnt/beta-catenin pathway. J. Exp. Clin. Cancer Res. 40, 132 (2021). [DOI] [PMC free article] [PubMed] [Google Scholar]
- 40.Liu L., et al. , Inhibition of Wnt/beta-catenin pathway reverses multi-drug resistance and EMT in Oct4(+)/Nanog(+) NSCLC cells. Biomed. Pharmacother. 127, 110225 (2020). [DOI] [PubMed] [Google Scholar]
- 41.Matsushita Y., et al. , A Wnt-mediated transformation of the bone marrow stromal cell identity orchestrates skeletal regeneration. Nat. Commun. 11, 332 (2020). [DOI] [PMC free article] [PubMed] [Google Scholar]
- 42.Zhang C., et al. , Combination of ferulic acid, ligustrazine and tetrahydropalmatine attenuates epithelial-mesenchymal transformation via Wnt/beta-catenin pathway in endometriosis. Int. J. Biol. Sci. 17, 2449–2460 (2021). [DOI] [PMC free article] [PubMed] [Google Scholar]
- 43.Zhang K., et al. , Targeting histone methyltransferase G9a inhibits growth and Wnt signaling pathway by epigenetically regulating HP1alpha and APC2 gene expression in non-small cell lung cancer. Mol. Cancer 17, 153 (2018). [DOI] [PMC free article] [PubMed] [Google Scholar]
- 44.Kato S., et al. , Gain-of-function genetic alterations of G9a drive oncogenesis. Cancer Discov. 10, 980–997 (2020). [DOI] [PMC free article] [PubMed] [Google Scholar]
- 45.Guo Y., et al. , EHMT2 promotes the pathogenesis of hepatocellular carcinoma by epigenetically silencing APC expression. Cell Biosci. 11, 152 (2021). [DOI] [PMC free article] [PubMed] [Google Scholar]
- 46.Liu J., et al. , Methylation of secreted frizzled-related protein 1 (SFRP1) promoter downregulates Wnt/beta-catenin activity in keloids. J. Mol. Histol. 49, 185–193 (2018). [DOI] [PubMed] [Google Scholar]
- 47.Pehlivan M., Caliskan C., Yuce Z., Sercan H. O., sFRP1 expression regulates wnt signaling in chronic myeloid leukemia K562 cells. Anticancer Agents Med. Chem. 22, 1354–1362 (2022). [DOI] [PubMed] [Google Scholar]
- 48.Oser M. G., Niederst M. J., Sequist L. V., Engelman J. A., Transformation from non-small-cell lung cancer to small-cell lung cancer: Molecular drivers and cells of origin. Lancet Oncol. 16, e165–e172 (2015). [DOI] [PMC free article] [PubMed] [Google Scholar]
- 49.Hu X., et al. , The role of YAP1 in survival prediction, immune modulation, and drug response: A pan-cancer perspective. Front. Immunol. 13, 1012173 (2022). [DOI] [PMC free article] [PubMed] [Google Scholar]
- 50.Lo Sardo F., Strano S., Blandino G., YAP and TAZ in lung cancer: Oncogenic role and clinical targeting. Cancers (Basel) 10, 137 (2018). [DOI] [PMC free article] [PubMed] [Google Scholar]
- 51.Sabari J. K., Lok B. H., Laird J. H., Poirier J. T., Rudin C. M., Unravelling the biology of SCLC: Implications for therapy. Nat. Rev. Clin. Oncol. 14, 549–561 (2017). [DOI] [PMC free article] [PubMed] [Google Scholar]
- 52.Ferrer L., et al. , A brief report of transformation from NSCLC to SCLC: Molecular and therapeutic characteristics. J. Thorac. Oncol. 14, 130–134 (2019). [DOI] [PubMed] [Google Scholar]
- 53.Marcoux N., et al. , EGFR-mutant adenocarcinomas that transform to small-cell lung cancer and other neuroendocrine carcinomas: Clinical outcomes. J. Clin. Oncol. 37, 278–284 (2018). [DOI] [PMC free article] [PubMed] [Google Scholar]
- 54.Chae Y. C., et al. , FOXO1 degradation via G9a-mediated methylation promotes cell proliferation in colon cancer. Nucleic Acids Res. 47, 1692–1705 (2019). [DOI] [PMC free article] [PubMed] [Google Scholar]
- 55.Charles M. R. C., et al. , Identification of novel quinoline inhibitor for EHMT2/G9a through virtual screening. Biochimie 168, 220–230 (2020). [DOI] [PubMed] [Google Scholar]
- 56.Gardner E. E., et al. , Lineage-specific intolerance to oncogenic drivers restricts histological transformation. Science 383, eadj1415 (2024). [DOI] [PMC free article] [PubMed] [Google Scholar]
- 57.Yang C., Han Y, microarray in SCLC transformation. National Center for Biotechnology Information Gene Expression Omnibus. https://www.ncbi.nlm.nih.gov/geo/query/acc.cgi?acc=GSE242843. Deposited 11 September 2023.
- 58.Yang C., RNA-seq in SCLC transformation. National Center for Biotechnology Information Gene Expression Omnibus. https://www.ncbi.nlm.nih.gov/geo/query/acc.cgi?acc=GSE244140. Deposited 27 September 2023.
- 59.Yang C., ChIP-seq in SCLC transformation. National Center for Biotechnology Information Gene Expression Omnibus. https://www.ncbi.nlm.nih.gov/geo/query/acc.cgi?acc=GSE242305. Deposited 05 September 2023.
- 60.Yang C., Human exon sequencing. National Center for Biotechnology Information Sequence Read Archive. https://dataview.ncbi.nlm.nih.gov/object/PRJNA1071558?reviewer=oe6lbdf5ov2rgpbi04vkh3pbfg. Deposited 29 January 2024
Associated Data
This section collects any data citations, data availability statements, or supplementary materials included in this article.
Supplementary Materials
Appendix 01 (PDF)
Dataset S01 (XLSX)
Data Availability Statement
Accession codes for datasets are as follows: microarray, RNA-seq, and ChIP-seq are at GEO (GSE242843, GSE244140, GSE242305) (57–59). WES results have been uploaded to SRA database (PRJNA1071558) (60). All other data are included in the manuscript and/or supporting information.