Abstract
The Dynamic Cardiac SPECT (DC-SPECT) system is being developed at the Massachusetts General Hospital, featuring a static cardio focus asymmetrical geometry enabling simultaneous high-resolution and high-sensitivity imaging. Among 14 design iterations of the DC-SPECT with varying number of detector heads, system sensitivity and resolution, the current version under development features 10 mm FWHM geometrical resolution (without resolution recovery) and 0.07% sensitivity at the center of the FOV, this is 1.5× resolution gain and 7× sensitivity gain compared to a conventional dual head gamma camera (0.01% sensitivity and 15-mm resolution). This work presents improvement in imaging resolution by implementing a spatially variant point spread function (SV-PSF) with list mode MLEM reconstruction. A resolution recovery method by PSF deconvolution is validated on list mode MLEM reconstruction for the DC-SPECT. A spatial invariant PSF is included as an additional test to show the influence of the PSF modelling accuracy on reconstructed image quality. We compare the MLEM reconstruction with and without PSF deconvolution; an analytic model is used for the calculation of system response, and the results are compared to the reconstruction with system modelling using Monte Carlo (MC) based methods. Results show that with PSF modelling applied, the quality of the reconstructed image is improved, and the DC-SPECT system can achieve a 4.5 mm central spatial resolution with average 795 counts/Mbq. Both the SV-PSF and the spatial-invariant PSF improve the image quality, and the reconstruction with SV-PSF generates line profiles closer to the ground truth. The results show substantial improvement over the GE Discovery 570c performance (7 mm spatial resolution with an average 460 counts/MBq, 5.8 mm resolution at the FOV center). The impact of PSF deconvolution is significant, improvement of the reconstructed image quality is evident in comparison to MC simulated system matrix with the same sampling size in the simulation.
Keywords: DC-SPECT, list mode MLEM, PSF modelling, MC simulation
1. Introduction
We are developing a cardiac-dedicated, cost-effective stationary SPECT system with large angular coverage (~225 degrees) by using large number of detectors and a large field of view (FOV) measuring 18 cm diagonal. The DC-SPECT system is based on CsI:Tl scintillator and no rotating or moving parts, the fabrication cost at a unit performance is lower than other systems, especially compared with the conventional CZT-based systems. Balancing design aspects necessitates trade-offs between sensitivity and resolution goals, therefore we have generated 14 design iterations of the DC-SPECT with varying geometry, such as detector pixel size, pinhole size, detector to collimator distances, number of detector heads, etc Previous simulation and modelling results [1-3] demonstrated that our system can achieve a calculated 10.0 mm FWHM system spatial resolution and 0.07% sensitivity at the center of FOV. Other than the intrinsic system resolution determined by geometry design, the reconstructed image resolution can also serve as a predictor of the prospective system performance and can be improved by applying iterative algorithms with resolution recovery methods [4-7].
Differing from many current cardiac SPECT prototypes, the DC-SPECT has an asymmetric geometry with varying detector to collimator distances, which makes system modelling and reconstruction more challenging in comparison. To ensure high quality of the reconstructed image, Monte Carlo (MC) simulation-based method is often proposed to accurately model the detector response [8, 9]. However, generating the system matrix for the whole system by MC simulation requires significant computation effort. Analytic calculations, on the other hand, can accelerate the multi-parameter design optimization, but artefacts can propagate to the reconstructed image if accurate detector response modelling is not implemented. Parameters such as pinhole aperture size, collimator-FOV distance, detector-collimator length and the resulting system sensitivity and resolution are intertwined and for an asymmetrical geometry like the DC-SPECT, slight change in one parameter often leads to revisiting and modifying the geometry of the entire system. Analytical methods can be used to cycle through design iterations but lack accurately reconstructed images without a MC simulated system matrix. Compensating the mismatch between analytic calculation and the acquired data by involving PSF modelling is an option to balance the computation efforts and the accuracy of system matrix modelling [6, 7, 10, 11], and has shown improvement of the image quality [4, 12]. The resolution recovery methods based on PSF are usually proposed for modelling the depth of interaction [13], the finite collimator resolution [14], and the detector blurring as well as the misalignment between the pinhole and aperture [8], and is often modelled as a 2D/3D Gaussian [15, 16], or Gaussian plus exponential function or B-spline [17]. A novel resolution recovery method based on the pre-reconstruction Fourier transform filtering for MLEM reconstruction is proposed in [18] for small animal SPECT. Our goal is not to compare these different methods; rather we intend to show the impact of PSF deconvolution in the iterative reconstruction for DC-SPECT to demonstrate the necessity of resolution recovery, and to validate an image-based spatial variant PSF (SV-PSF) model.
2. Methods
2.1. DC-SPECT system
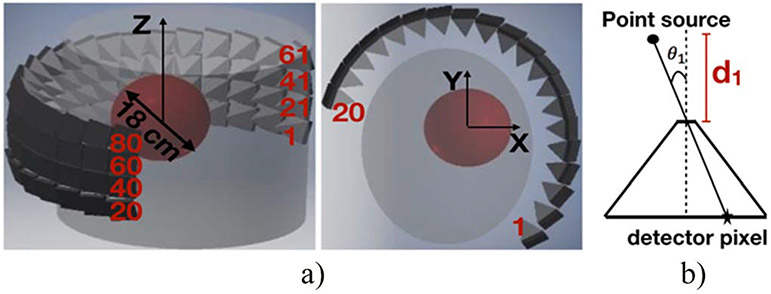
The DC-SPECT system has previously been implemented in GATE 7.1 and GEANT4 10.1 in [1-3]. The complete system with 0.07% sensitivity and 10 mm spatial resolution is comprised of four rows of pinhole collimator-detector pairs. Each row contains 20 laser-processed [19, 20] CsI:Tl detectors [21], where each 10 mm thick detector is divided into 25 × 25 converging pixels measuring 2 × 2 mm2 at the detector plane. The detailed descriptions for system geometry can be found in [1, 3]. Figure 1 demonstrates the whole system geometry, with the number 1 to 80 in the figure corresponding to the first and the last detectors. Due to the computation cost, we only considered the first row of 20 heads in this study.
Figure 1.
(a) DC-SPECT system, a central cut on transverse plane for the first column of detectors is shown on the right, the scanner covers a total range of 18 cm in diagonal direction. (b) Coordinate system of pinhole collimation.
The system resolution in the center of the FOV can be calculated theoretically by the following equations, as indicated in [22]:
where is the collimator resolution, is the detector intrinsic resolution, is the effective length of the sides of pinhole, is the collimator length, is the distance from the pinhole center to the FOV center, is the length of sides of the pinhole, is the acceptance angle of the collimator, is the linear attenuation coefficient of the collimator material. Given an average collimator length of 87 mm, and 253 mm distance from the center of the pinhole to the center of the FOV, 2.25 mm pinhole size and acceptance angle of ~42 deg, the theoretical system resolution is calculated as ~10 mm FWHM. However, due to the asymmetrical geometry, the resolution and the sensitivity varies with each detector head. The system sensitivity is calculated by , and the total sensitivity of the complete system with 80 camera heads is 0.07%.
The pinhole aperture has a square shape, which can lead to asymmetric PSF of pinhole collimator, and introduce artifacts in the reconstructed images. Except the pinhole aperture, non-accurate system modeling as well as the accumulating high frequency noises in MLEM reconstruction may also generate artifacts in the reconstructed images. To deal with the artifacts caused by the reconstruction method, we chose to implement the deconvolution of PSF in image space in this work. The evaluated FOV in this study measures 12 × 12 cm2, within which the system has fully-3D coverage, and the square shape of pinholes does not introduce artifact.
2.2. Verification of the FOV coverage of the system
We divided the verification of the FOV coverage in three steps: (1) we first plot the angular coverage of each detector, (2) compare the MC simulated sensitivity to the sensitivity calculated by the distribution of FOR within the evaluated FOV, and (3) simulate and reconstruct a uniform spherical source, followed by evaluating the projection of the spherical source on detectors. This step verifies artifacts caused by the pinhole aperture is negligible within the region of interest.
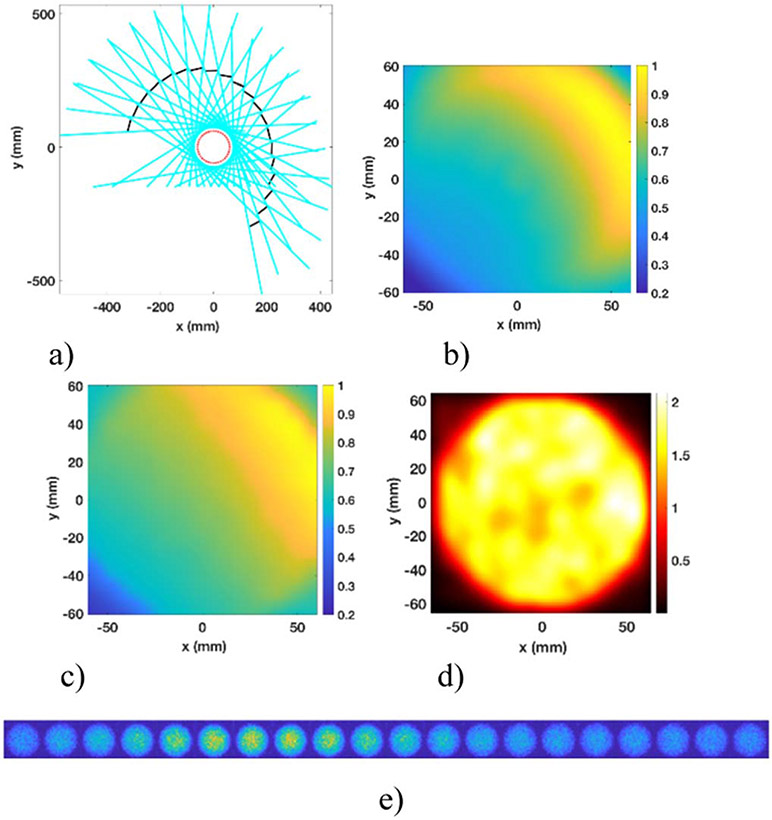
Figure 2(a) shows sampling on transverse plane where the 20 detectors are indicated by black lines, and the cyan lines representing the internal collimator walls engulfing the FOV. The red circle corresponds to the evaluated region of interest in this study, with a 12 cm diameter. The FOV is completely seen by each of the 20 detector heads.
Figure 2.
FOV coverage and sampling: (a) angular sampling, (b) sensitivity calculated as a function of LOR in transverse plane, (c) MC simulated sensitivity, (d) reconstructed spherical source at 10th iteration, (e) projections of a spherical source on each of the 20 detectors.
The MLEM reconstruction method that we utilized is based on the LOR calculation, which means the statistics are improved with increasing number of LOR passing through the voxels, and MLEM will generate better quality of images with better statistics, a better resolution can thus be achieved in the reconstructed image. Here, LOR is defined as an invisible line connecting the center of detector pixel and the center of pinhole passing through the image voxel. The global detector pixel position and the pixel size are two of the essential factors impacting the distribution of LORs. An imperfect pixel position of one detected gamma photon will add uncertainties to the corresponding LOR. Additionally, the LOR is affected by the pinhole shape and its size. The evaluated detector has 2 × 2 mm2 detector pixel size with 10 mm thickness, and the square-shape pinhole measures 2.25 mm each side. Denoting the distance from one voxel to one LOR as , denoting the total number of LORs in the FOV as L, figure 2(b) demonstrates the sensitivity calculated by applying , here refers to half of the pinhole size, which is also the voxel size used in this study (1 mm3), is the solid angle calculated as , with , define the ray path shown in figure 1(b). The evaluated region (12 × 12 × 0.1 cm3) is divided into 120 × 120 × 1 voxels. The normalized grey level of one voxel j shown in figure 2(b) corresponds to the possibility of one photon emitted from voxel j being detected, with 20 detectors considered for the calculation of LOR, showing agreement to the MC simulated sensitivity shown in figure 2(c). The simulated point sources are placed at different locations in transverse plane with 1 cm sampling in each direction, the detected counts are then linearly interpolated for each voxel shown in figure 2(c). We note here the simple model used to generate figure 2(b) is not completely an accurate model to generate sensitivity map with excellent agreement with the actual system. To provide more accurate analytic calculation for pinhole collimator sensitivity, multiple studies have been conducted, and results have shown great agreement ([23], [24]). More complex modelling of sensitivity for DC-SPECT system specific to the square-shape pin-hole should be developed in the future.
In order to futher verify the full coverage of the evaluated FOV, a uniform spherical source with 12 cm diameter is placed in the center of the FOV, with 100 MBq activity and simulated in air for 10 seconds. The projections on each detector is shown in figure 2(e), from the left to the right corresponding to the first detector to the 20th detector head. The reconstructed slice of the spherical source on transverse plane is shown in figure 2(d). Although the DC-SPECT system has an asymmetrical geometry, thanks to the large number of detector heads and detector pixels, near complete FOV sampling of the reconstruction volume is evident in figures 2(a) and (e). Note that when including 80 detectors (instead of 20 in this study) the image volume sampling will be even more complete. No artifacts are shown in the detector plane in figure 2(e) for the evaluated region of interest. However, the reconstructed spherical source shows slight non-homogenous intensity due to the asymmetical geometry of the DC-SPECT system, which is one of the reasons we chose to apply an asymmetical PSF modeling for resolution recovery.
2.3. List mode MLEM with image based PSF deconvolution
The list mode MLEM reconstruction algorithm [25] aims to find , the mean number of photons emitted in voxel , by iteratively calculating the sequence:
where S is the sensitivity matrix of dimension J, J corresponds to the reconstruction volume; one element in the sensitivity matrix corresponds to the probability that one event emitted from voxel is detected by the detector, and is calculated as . The system matrix of dimension I × J is presented by T, with I being the size of detected events in list mode, one element in the system matrix corresponds to the probability of a photon emitted in voxel being detected as event , can be estimated by MC simulation and is analytically calculated by:
where n is calculated as , equals to half of the intrinsic detector resolution, p is the center of pinhole, is the center of voxel and is the detector pixel location of one detected event referring to the global geometry, corresponds to the solid angle term usually calculated as , and is simplified to 1 with PSF deconvolution involved.
The spatial variant PSF in the image space is presented by K, one element is expressed by a 3D Gaussian with rotation in our study:
where (x, y, z) is the voxel coordinates.
The 3D rotation matrix in voxel j is presented by R, containing 2 angles of rotation (, ):
With rotation angle about the x axis and the rotation angle about the z axis in 3D Cartesian plane. The proposed 3D Gaussian model leads to 9 parameters in total: (k, , , , , , , , ). The parameters are pre-stored and the PSF for each voxel is calculated on-the-fly in each iteration of MLEM.
2.4. Simulation and SV-PSF modelling
The Monte Carlo simulation toolkit used in this study is Gate V9.1, and the simulated data is Poisson distributed. The computational hardware used is a 64-core AMD Ryzen Threadripper PRO 3995WX and 192 GB memory. We simulated point-like sources at different locations with 1 cm spacing in a 3D Cartesian coordinate system; only the central region of interest (12 cm in transversal dimension) is evaluated in this study. The choice of 1 cm sampling corresponds to the expected resolution of this system. It is apparent that smaller spacing may lead to better PSF modelling, however it also leads to large system matrix size and computational resource. The coordinates of the source vary from −6.0 cm to 6.0 cm in transverse position, and −1.0 cm to 1.0 cm along each vertical axis, leading to 13 × 13 × 3 evaluated positions in total. One point-like source with 0.125 mm radius containing 10 MBq of activity at 140.5 keV was simulated separately in different source center positions for 10 seconds in air. The reconstructed PSF after 40 iterations has a shape of ellipsoid, which can be estimated as a 3D spatial-variant Gaussian function. The 3D Gaussian is then fitted to the reconstructed point.
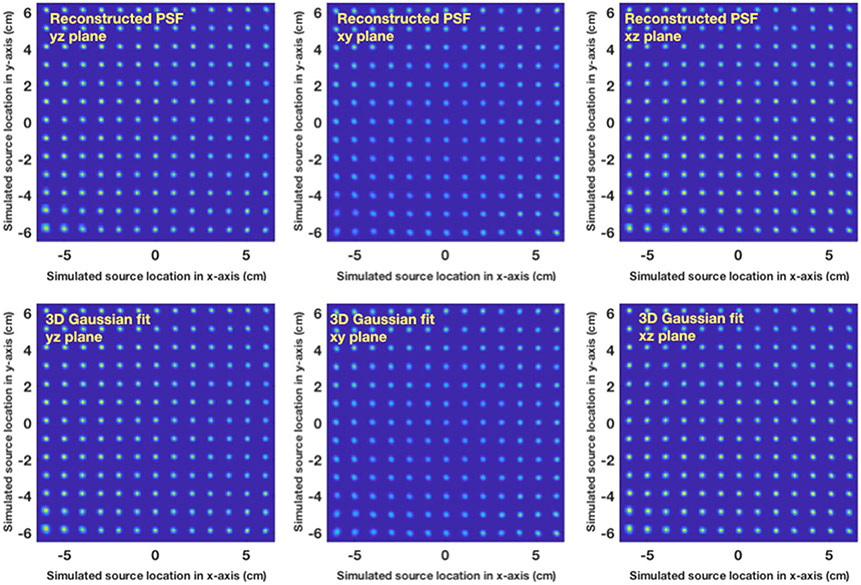
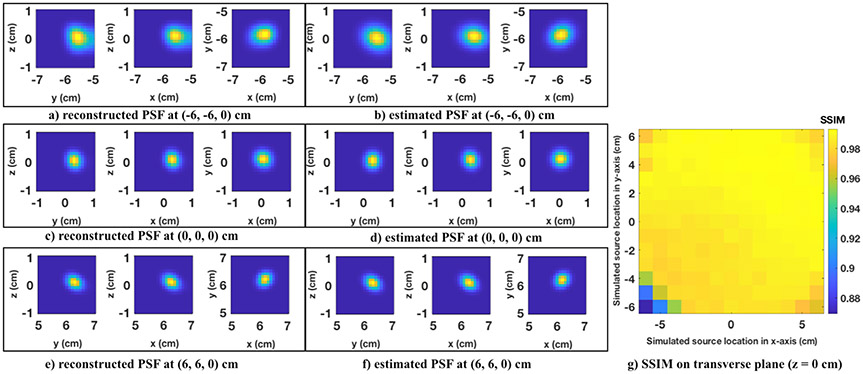
The reconstructed PSF and the spatial variant 3D Gaussian fit on transverse, sagittal, and coronal planes are shown in figure 3, where each spot shows the estimated PSF and the reconstructed point-like source emitted at the location (x, y) cm, with x and y varying from −6 cm to 6 cm. Results show that the reconstructed point source has varying FWHM in different locations across the FOV, which corresponds to the shifts of spatial resolution. Images of the reconstructed source and the estimated PSF at locations (0, 0, 0), (−6, −6, 0) and (6, 6, 0) are shown in figure 4. The reconstructed point source has an ellipsoid shape that is close to the proposed 3D Gaussian model with rotation. We normalized the PSF at different locations by the sum. To evaluate the similarity of SV-PSF to the reconstructed point source, we used the structure similarity (SSIM) index implemented in MATLAB, where a value closer to 1 indicates better image similarity. The total SSIM for the 507 total evaluated positions is 500.1758, which leads to an average SSIM close to 1, the SV-PSF at (−6, −6, 1) cm has minimum SSIM 0.8693. The SSIM on the transverse slice when z = 1 cm is shown in figure 4(g). We then linear interpolated the parameters for each voxel using the interpolation method implemented in MATLAB for 3D gridded data.
Figure 3.
Central slices of PSF reconstructed (top) and estimated (bottom), the x- and y-axes correspond to the emission position of the point-like sources.
Figure 4.
Examples of reconstructed PSF (a), (c), (e) and estimated PSF (b), (d), (f) at different locations. Structural similarity (SSIM) at different locations for the estimated PSF using reconstructed PSF as reference on the central transverse plane (z = 1 cm) is shown in (g), the minimum value of SSIM is 0.8693 at (−6, −6, 1) cm, showing 10% mismatch between the reconstructed PSF and the estimated PSF.
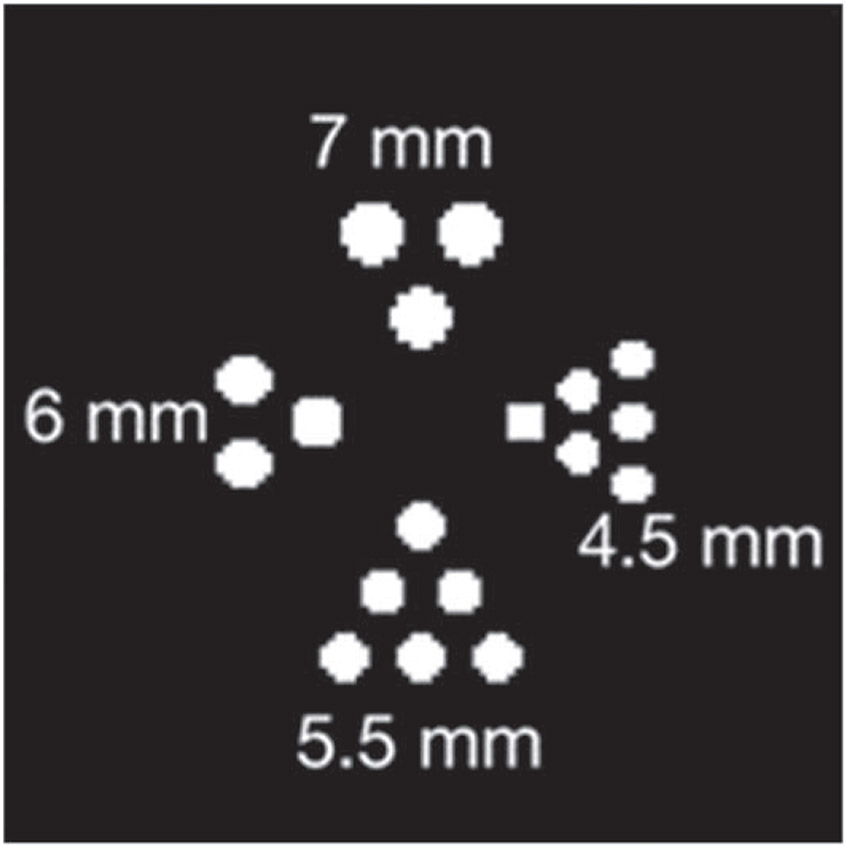
We reconstructed the modified Derenzo-type phantom shown in figure 5, where each section contains 2 cm long cylinders and 7 mm, 6 mm, 5.5 mm and 4.5 mm diameter. The center-center spacing of adjacent rods are 2× the rod diameter. The total activity of the phantom is 154 MBq, with 20 seconds acquisition time we collected 2.1 × 10⁶ events. To evaluate the image quality, we employed the contrast to noise ratio (CNR) and contrast recovery coefficient (CRC) separately for each hot rod having diameter 5.5 mm and 4.5 mm.
Figure 5.
Derenzo-type phantom (ground truth).
The CNR is calculated by the following equation:
with being the mean value of the region of the hot rods, the mean value of background, the standard deviation of background.
The CRC is calculated by the following equation:
3. Results
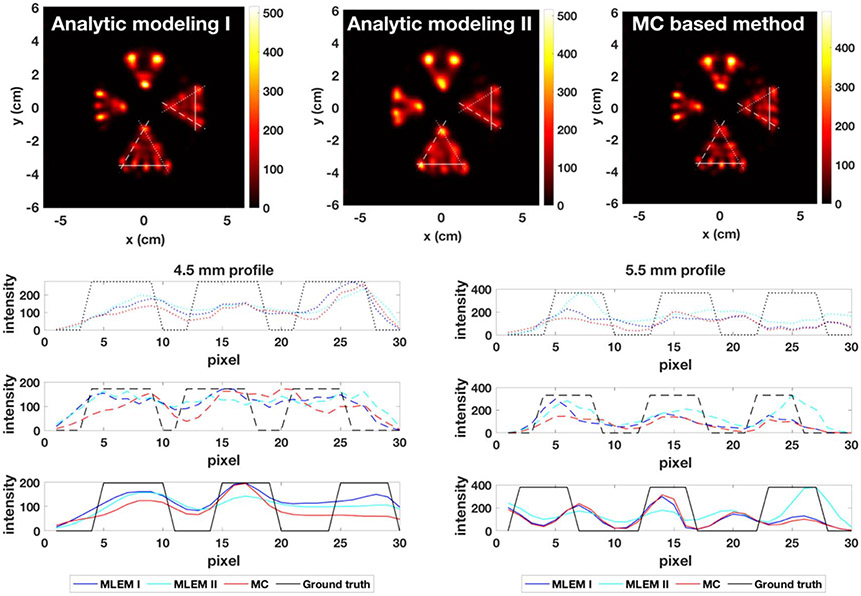
We used 2 × 10⁵ counts for the comparison between system matrix calculated by analytic modelling and by MC based methods. The system matrix calculated by Monte Carlo methods is based on the simulation, where measurements of detector to voxel response are required, one element in the system matrix is estimated by the possibility of one gamma photon emitted from voxel j being detected within one pixel i of the detector ([25]). The analytic modelling is described in section 2.3. The calculation of system matrix is carried out by applying the equation: . Figure 6 shows the image reconstructed with solid angle calculated as (analytic modeling II) and the image reconstructed with solid angle normalized to 1 (analytic modeling I). Given that the quality of reconstructed image with solid angle calculated as does not show substantial improvements, to lower the computing cost, we normalized to 1 in the system matrix for the comparisons between MLEM, MLEM with spatial invariant PSF and MLEM-SV-PSF.
Figure 6.
Comparison between analytic modeling and MC based methods with 2 × 10⁵ counts, 400 iterations.
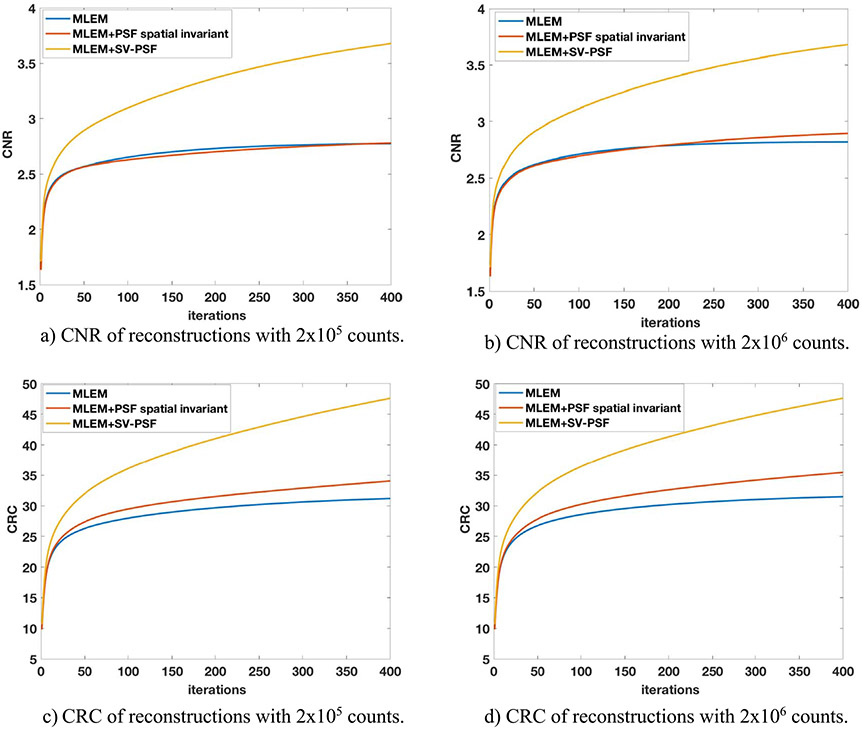
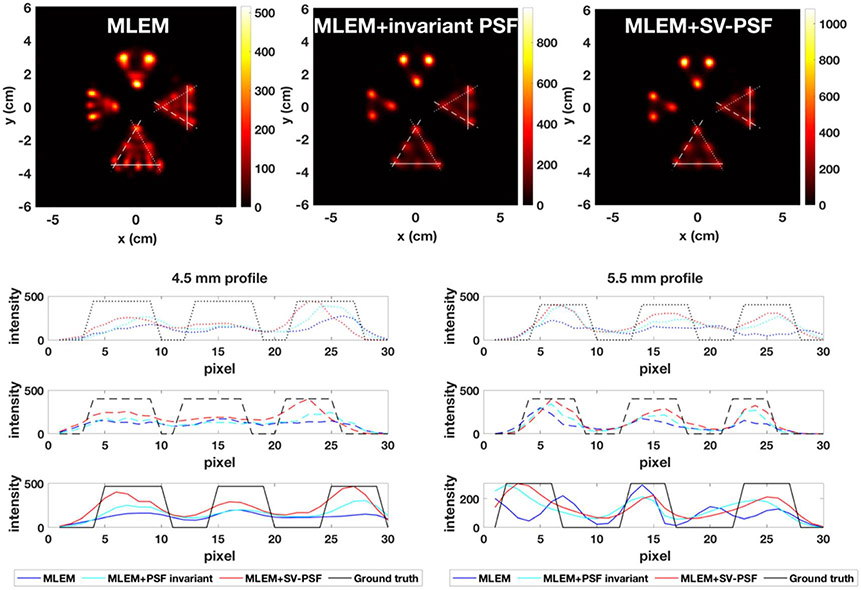
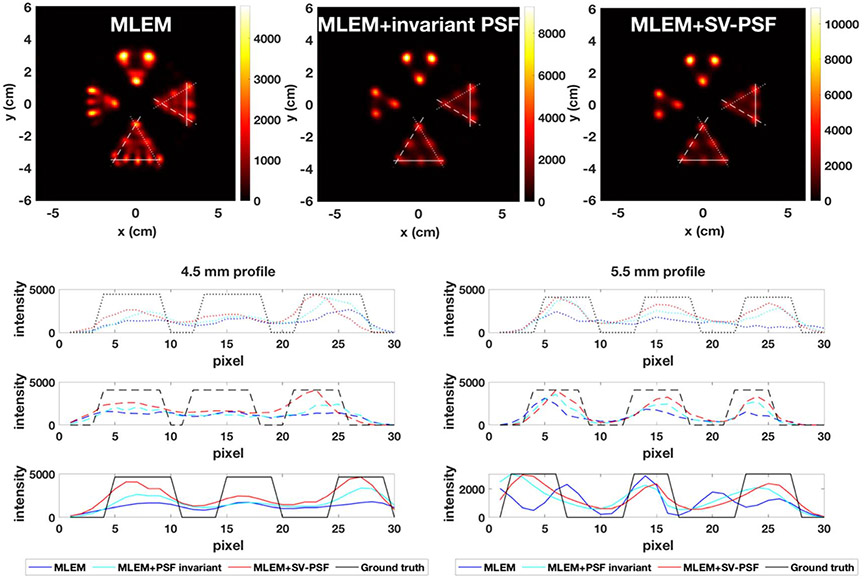
To evaluate the impact of PSF deconvolution, 2 × 10⁵ and 2 × 10⁶ counts were used separately in paired reconstructions. A spatial invariant PSF () is included in the MLEM as an additional test. The 12 × 12 × 2 cm3 volume is divided into 120 × 120 × 20 voxels (1 mm3 voxels). We selected 400 iterations as the CNR and CRC plots almost converged at 400th iteration for MLEM image with 2 × 10⁶ counts (see figure 9); It is apparent that the SV and invariant PSF reconstructed images have some room to improve beyond the 400th iteration. A post Gaussian smoothing () is added on the sum of the slice of the reconstructed volume within a transverse plane as shown in figures 6, 7 and 8. Figures on the bottom show profiles along the lines plotted in the reconstructed images for 4.5 mm rods and 5.5 mm rods.
Figure 9.
Metrics for image reconstruction comparisons for 4.5 mm rods.
Figure 7.
Image reconstructions with 2 × 10⁵ counts, 400 iterations.
Figure 8.
Image reconstructions with 2 × 10⁶ counts, 400 iterations.
The CNR and CRC are calculated separately for each 5.5 mm and 4.5 mm hot rod. The reconstructed image quality metrics are summarized in tables 1 and 2, results are expressed in mean ± standard deviation (SD). Figure 9 shows the average value of CNR and CRC for 4.5 mm rods after each iteration.
Table 1.
Comparison between analytic modelling and me based methods at 2 × 10⁵ counts, 400 iterations.
| 2 × 10⁵ counts, Mean ± SD |
Analytic modeling I |
Analytic modeling II |
MC methods | |
|---|---|---|---|---|
| CNR | 4.5 mm | 2.8 ± 0.4 | 2.4 ± 0.2 | 2.4 ±0.7 |
| 5.5 mm | 2.2 ± 0.3 | 2.4 ± 0.6 | 2.2 ± 0.4 | |
| CRC | 4.5 mm | 31.2 ± 5.1 | 23.6 ±3.3 | 25.2 ± 7.9 |
| 5.5 mm | 16.8 ± 2.7 | 16.9 ± 4.2 | 17.3 ± 3.9 | |
Table 2.
Comparison between MLEM with analytic modelling, spatial invariant PSF and SV-PSF, 400 iterations.
| 2 × 10⁵ counts, Mean ± SD | MLEM | invariant PSF | SV-PSF | |
|---|---|---|---|---|
| CNR | 4.5 mm | 2.8 ± 0.4 | 2.8 ± 0.8 | 3.7 ± 1.2 |
| 5.5 mm | 2.2 ±0.3 | 2.7 ± 0.6 | 3.2 ± 0.6 | |
| CRC | 4.5 mm | 31.2 ± 5.1 | 34.0 ± 10.8 | 47.6 ± 15.0 |
| 5.5 mm | 16.8 ± 2.7 | 23 ±5.1 | 27.5 ± 6.5 | |
| 2 × 10⁶ counts, Mean ± SD | MLEM | invariant PSF | SV-PSF | |
| CNR | 4.5 mm | 2.8 ± 0.5 | 2.9 ± 1.0 | 3.7 ± 1.3 |
| 5.5 mm | 2.2 ± 0.3 | 2.8 ± 0.5 | 3.2 ± 0.6 | |
| CRC | 4.5 mm | 31.5 ± 5.7 | 35.5 ± 12.7 | 47.6 ± 17.3 |
| 5.5 mm | 17.5 ± 2.7 | 24.3 ± 5.0 | 28.4 ±6.4 |
4. Discussion
Figure 3 demonstrates the spatial resolution varying within the FOV, which leads to the necessity of applying a spatial variant PSF for resolution recovery. The rotation of PSF model is caused by the rotation of each detector head in the DC-SPECT geometry. The full angular coverage is verified for the evaluated FOV (figure 2(a)). The simulated sensitivity shown in figure 2(c) is not homogenous, which is caused by the asymmetrical geometry. The slight disagreement between the simulated sensitivity and the calculated sensitivity shown in figure 2(b) is caused by the simple model of calculation. The analytic modelling that we used in this study does not have exact agreement with the asymmetrical geometry, which is the main cause of the varying intensity shown in the reconstructed image of the spherical source (figure 2(d)).
Reconstructed image with a simple solid angle term is compared to the reconstruction without solid angle involved in figure 6. Although the sensitivity calculated with solid angle term (shown in figure 2(b)) shows similarity to the MC simulated sensitivity (shown in figure 2(c)), no substantial improvements are shown in the image quality, indicating that the approximation of the solid angle involved in the reconstruction is not accurate. Other accurate models more specific to our system geometry will be investigated in future. Additionally, figure 6 shows that with the current simulation setting, the visual difference between analytic modelling and MC based methods is not profound.
Table 1 presents the metrics of reconstruction after 400 iterations and shows the advantage of analytic modelling over MC based methods. This may be caused by the choice of the sampling size (1 cm spacing), or by the low statistics in the simulation with 10s acquisition time. Although the expected resolution is 1 cm, the current sampling size is not accurate enough to generate a MC-based calculated system matrix. With a more accurate system matrix estimated through Monte Carlo simulations, the resolution might surpass the one improved by PSF. Therefore, it is important to compare the advantages and limitations of Monte Carlo-based methods and PSF methods with smaller point source sampling in the simulation. However, it should be noted that for smaller source spacing, the system matrix generation leads to excessively large computation cost. Currently MC-based method takes ~1 h per source location on a 2.4 GHz CPU. Generating a system matrix with the analytic method is thus nearly instantaneous in comparison with the resources required by the computationally intensive MC-based method. The three reconstruction methods (analytic modeling I, analytic modeling II and MC based method) show similar performance in terms of CNR and CRC. A future study will analyze these methods using an objective task-based figure of merit based on the tasks of cardiac-defect detection and characterization.
The MLEM reconstructed images shown in figures 6, 7 and 8 show large artifacts, however both the SV-PSF and the spatial invariant PSF improve the image quality, and a 4.5 mm resolution can be achieved even with low counts (2 × 10⁵). The reconstruction with SV-PSF generates line profiles closer to the ground truth and provides better average CNR and CRC than spatial invariant PSF (figure 9). For SV-PSF the average computation cost measured by the system tick count is 40s per iteration for the selected volume, which is 2 times longer than the invariant PSF (20s), this is caused by the fact that a spatial invariant PSF can be pre-stored and does not require on the fly calculation. Applying the spatial invariant PSF might compensate for the increased computation cost by improving the image quality, especially for some clinical applications where lower resolution is sufficient to detect the malignant features of interest. The MC simulated system matrix had shown no advantage on the image resolution, meanwhile the simulated sampling was 1 cm, so the system matrix measured by MC simulation was not accurate for 1 mm voxel. Comparing the impact of PSF deconvolution with a more accurate MC simulated detector response will be considered in future work.
The metrics of the reconstructed images with PSF deconvolution involved, as shown in table 2, have larger standard deviation compared with MLEM reconstructed images. This variability is also reflected visually in the varying intensity of the 4.5 mm hot rods in the reconstructed images. Such variation can lead to inaccurate quantitative imaging and bring false standardized uptake value for clinical judgement. One possible cause of the observed edge artifacts may be the mismatch between the true PSF and the proposed PSF model. Although the PSF estimated by the 3D Gaussian model shows a high degree of similarity to the reconstructed point source, we only evaluated locations with 1 cm sampling, the interpolated parameters of the 3D Gaussian modeled PSF may not accurately represent the actual PSF for each voxel, resulting to edge artifacts during the reconstruction process. Piecewise regularization method might be beneficial to reduce this artifact. A smaller sampling of the simulation should be considered to address the potential mismatch between the interpolated parameters of the PSF model and the actual PSF.
Comparing the line profiles and the standard deviation of CNR and CRC for 4.5 mm and 5.5 mm hot rods, we observe a homogenous intensity distribution for the 5.5 mm hot rods. However, the average value of CNR and CRC for 4.5 mm rods is better than that for the 5.5 mm rods. This difference is caused by the non-homogenous sensitivity within the FOV, as indicated in figure 2(c), which shows that the system has varying sensitivity and imaging resolution at different locations. In the simulation, comparing to 5.5 mm rods, the 4.5 mm hot rods are placed in a region closer to the detector, resulting in a larger sensitivity within the FOV and thus a better imaging resolution. The large standard deviation of CNR and CRC for 4.5 mm hot rods suggests that 4.5 mm might reaches the limit of the resolution that the current reconstruction method can achieve.
The current system matrix and sensitivity matrix employ a very simple model based on LOR calculation without considering an accurate solid angle calculation and the pinhole collimator impact. A more accurate modeling of the system matrix will improve the quality of the reconstructed images. It should be noted that while the DC-SPECT consists of 4 rows of detectors, each row having 20 pinhole-detector pairs, only the last row is evaluated in this manuscript. Although the fully angular coverage in transverse plane is proven in figure 2(a), the view in coronal plane with 20 detectors is limited and will contribute to the non-uniformity of image intensity along the z axis. In order to further evaluate the imaging performance, the resolution along z axis should also be investigated, as we have currently only evaluated the resolution on the transverse plane.
5. Conclusion
The current system matrix has a simple model and does not include corrections such as attenuation, scattering, and accurate solid angle modeling. Despite the simplicity of the system matrix modeling, the idea of this work is to show the improvements PSF deconvolution can bring to the reconstructed image and demonstrate the value of such approach in asymmetrical geometries where slight change in a single collimator dimension requires reevaluating the entire system. Therefore, our approach works best in cycling through design iterations of such asymmetrical and complex geometries. The evaluated Derenzo source is placed in a region far from the detector thus the impact of the solid angle is minimized. However, when the reconstructed volume is close to the edge of the FOV, an accurate modeling of solid angle should be considered. The 4.5 mm central resolution with 0.07% sensitivity is not a definite limit for this system design, to further evaluate the performance in the reconstruction aspect, the impact of the solid angle accuracy, the attenuation and scattering corrections should also be applied.
Results show that with the PSF deconvolution included, 4.5 mm FWHM central spatial resolution can be achieved for DC-SPECT system at 0.07% system sensitivity even with relatively low counts (2 × 10⁵), both with the SV-PSF and the spatial invariant PSF. Meanwhile, the spatial resolution varies with source location within the FOV. The impact of the PSF modelling on the border of the FOV will be more significant and will be investigated in future work especially when reconstructing an extended source such as the 4D cardiac-torso (XCAT) phantom. With the current simulation settings, MC simulated system matrix does not show advantage for improving the image quality, and applying the SV-PSF can decrease the artifacts in the reconstruction. We thus propose to apply PSF deconvolution to MLEM with the current analytically modelled system matrix to improve the reconstruction and to reduce the computation efforts required by MC based methods.
The complete system contains 80 detector heads in total, but due to the computation cost we only considered the first row of 20 detectors. From the current study, we can draw the conclusion that with a limited number of detectors, 4.5 mm reconstructed resolution can be expected by list mode MLEM reconstruction with and only with PSF deconvolution. The system performance will be further investigated by including all 80 detector heads to have a full coverage in longitudinal direction.
Acknowledgments
The authors acknowledge financial support of the NIH Grant No. R01HL145160.
Data availability statement
The data cannot be made publicly available upon publication because the cost of preparing, depositing and hosting the data would be prohibitive within the terms of this research project. The data that support the findings of this study are available upon reasonable request from the authors.
References
- [1].Sajedi S, Blackberg L, Vittum B and Sabet H 2020. Dynamic cardiac SPECT system for diagnostic and theranostics applications: design optimization and experimental data J. Nucl. Med 61 308 (https://jnm.snmjournals.org/content/61/supplement_1/308.short) [Google Scholar]
- [2].Uzun-Özşahin D, Bläckberg L, Moghadam N, El Fakhri G and Sabet H 2016. GATE simulation of a high-performance stationary SPECT system for cardiac imaging 2016 IEEE Nuclear Science Symp., Medical Imaging Conf. and Room-Temperature Semiconductor Detector Workshop (NSS/MIC/RTSD) (IEEE; ) ( 10.1109/NSSMIC.2016.8069814) [DOI] [Google Scholar]
- [3].Bläckberg L et al. 2020. Dynamic cardiac SPECT for diagnostic and theranostics applications: latest results 2020 IEEE Nuclear Science Symp. and Medical Imaging Conf. (NSS/MIC) (IEEE; ) ( 10.1109/NSS/MIC42677.2020.9508002) [DOI] [Google Scholar]
- [4].Ismail FS and Mansor S 2019. Impact of resolution recovery in quantitative 99mtc spect/ct cardiac phantom studies Journal of Medical Imaging and Radiation Sciences 50 449–53 [DOI] [PubMed] [Google Scholar]
- [5].Zoccarato O et al. 2014. Comparative analysis of iterative reconstruction algorithms with resolution recovery for cardiac spect studies. a multi-center phantom study Journal of Nuclear Cardiology 21 135–48 [DOI] [PubMed] [Google Scholar]
- [6].Pino F, Ro’e N, Aguiar P, Falcon C, Ros D and Pav’ia J 2015. Improved image quality in pinhole spect by accurate modeling of the point spread function in low magnification systems Med. Phys 42 703–14 [DOI] [PubMed] [Google Scholar]
- [7].Snyder DL, Miller MI, Thomas LJ and Politte DG 1987. Noise and edge artifacts in maximum-likelihood reconstructions for emission tomography IEEE Trans. Med. Imaging 6 228–38 [DOI] [PubMed] [Google Scholar]
- [8].Miller BW, Van Holen R, Barrett HH and Furenlid LR 2012. A system calibration and fast iterative reconstruction method for next-generation spect imagers IEEE Trans. Nucl. Sci 59 1990–6 [DOI] [PMC free article] [PubMed] [Google Scholar]
- [9].Auer B, Zeraatkar N, De Beenhouwer J, Kalluri K, Kuo PH, Furenlid LR and King MA 2019. Investigation of a monte carlo simulation and an analytic-based approach for modeling the system response for clinical i-123 brain spect imaging 15th Int. Meetingon Fully Three-Dimensional Image Reconstruction in Radiology and Nuclear Medicine (Int. Society for Optics and Photonics) 11072 1107214 [Google Scholar]
- [10].Reader AJ, Julyan PJ, Williams H, Hastings DL and Zweit J 2003. Em algorithm system modeling by image-space techniques for pet reconstruction IEEE Trans. Nucl. Sci 50 1392–7 [Google Scholar]
- [11].Beekman FJ, Kamphuis C and Viergever MA 1996. Improved spect quantitation using fully three-dimensional iterative spatially variant scatter response compensation IEEE Trans. Med. Imaging 15 491–9 [DOI] [PubMed] [Google Scholar]
- [12].Okuda K, Nakajima K, Yoneyama H, Shibutani T, Onoguchi M, Matsuo S, Hashimoto M and Kinuya S 2019. Impact of iterative reconstruction with resolution recovery in myocardial perfusion spect: phantom and clinical studies Sci. Rep 9 1–9 [DOI] [PMC free article] [PubMed] [Google Scholar]
- [13].Tran-Gia J and Lassmann M 2019. Characterization of noise and resolution for quantitative 177lu spect/ct with xspect quant J. Nucl. Med 60 50–9 [DOI] [PubMed] [Google Scholar]
- [14].Bhusal N, Dey J, Xu J, Kalluri K, Konik A, Mukherjee JM and Pretorius PH 2019. Performance analysis of a high-sensitivity multi-pinhole cardiac spect system with hemi-ellipsoid detectors Med. Phys 46 116–26 [DOI] [PMC free article] [PubMed] [Google Scholar]
- [15].Jan ML, Lee MW and Huang HM 2018. PSF reconstruction for compton-based prompt gamma imaging Phys. Med. Biol 63 035015. [DOI] [PubMed] [Google Scholar]
- [16].Stute S and Comtat C 2013. Practical considerations for image-based PSF and blobs reconstruction in PET Phys. Med. Biol 58 3849. [DOI] [PubMed] [Google Scholar]
- [17].Chun SY, Fessler JA and Dewaraja YK 2012. Correction for collimator-detector response in SPECT using point spread function template IEEE Trans. Med. Imaging 32 295–305 [DOI] [PMC free article] [PubMed] [Google Scholar]
- [18].Shahraki RH, Shiri I, Geramifar P, Akbarzadeh A, Sanaat AH and Ay MR 2018. Resolution recovery with pre-reconstruction fourier transforms filtering for a high resolution animal spect system Frontiers in Biomedical Technologies 5 74–80 [Google Scholar]
- [19].Sabet H and El-Fakhri G 2014. Novel cost-effective and high-performance modular detectors for emission tomography systems 2014 IEEE Nuclear Science Symp. and Medical Imaging Conf. (NSS/MIC) (IEEE; ) 1–3 [Google Scholar]
- [20].Bläckberg L, Moebius M, El Fakhri G, Mazur E and Sabet H 2018. Light spread manipulation in scintillators using laser induced optical barriers IEEE Trans. Nucl. Sci 65 2208–15 [DOI] [PMC free article] [PubMed] [Google Scholar]
- [21].Sabet H, Bläckberg L, Uzun-Ozsahin D and El- Fakhri G 2016. Novel laser-processed CsI: Tl detector for SPECT Med. Phys 43 2630–8 [DOI] [PMC free article] [PubMed] [Google Scholar]
- [22].Cherry SR, Sorenson JA and Phelps ME 2012. Physics in Nuclear Medicine E-Book. (Elsevier Health Sciences; ) [Google Scholar]
- [23].Metzler SD et al. 2001. Analytic determination of pinhole collimator sensitivity with penetration IEEE Trans. Med. Imaging 20 730–41 [DOI] [PubMed] [Google Scholar]
- [24].Li Y-S, James EO and Chang W 2010. Analytic derivation of pinhole collimation sensitivity for a general source model using spherical harmonics Phys. Med. Biol 55 2727. [DOI] [PMC free article] [PubMed] [Google Scholar]
- [25].Feng Y, Bläckberg L, El Fakhri G, Worstell W and Sabet H 2021. First Investigation of List mode MLEM Reconstruction for Fast DC-SPECT System Design Optimization 2021 IEEE Nuclear Science Symp. and Medical Imaging Conf. (NSS/MIC) (IEEE; ) 1–3 [Google Scholar]
Associated Data
This section collects any data citations, data availability statements, or supplementary materials included in this article.
Data Availability Statement
The data cannot be made publicly available upon publication because the cost of preparing, depositing and hosting the data would be prohibitive within the terms of this research project. The data that support the findings of this study are available upon reasonable request from the authors.


