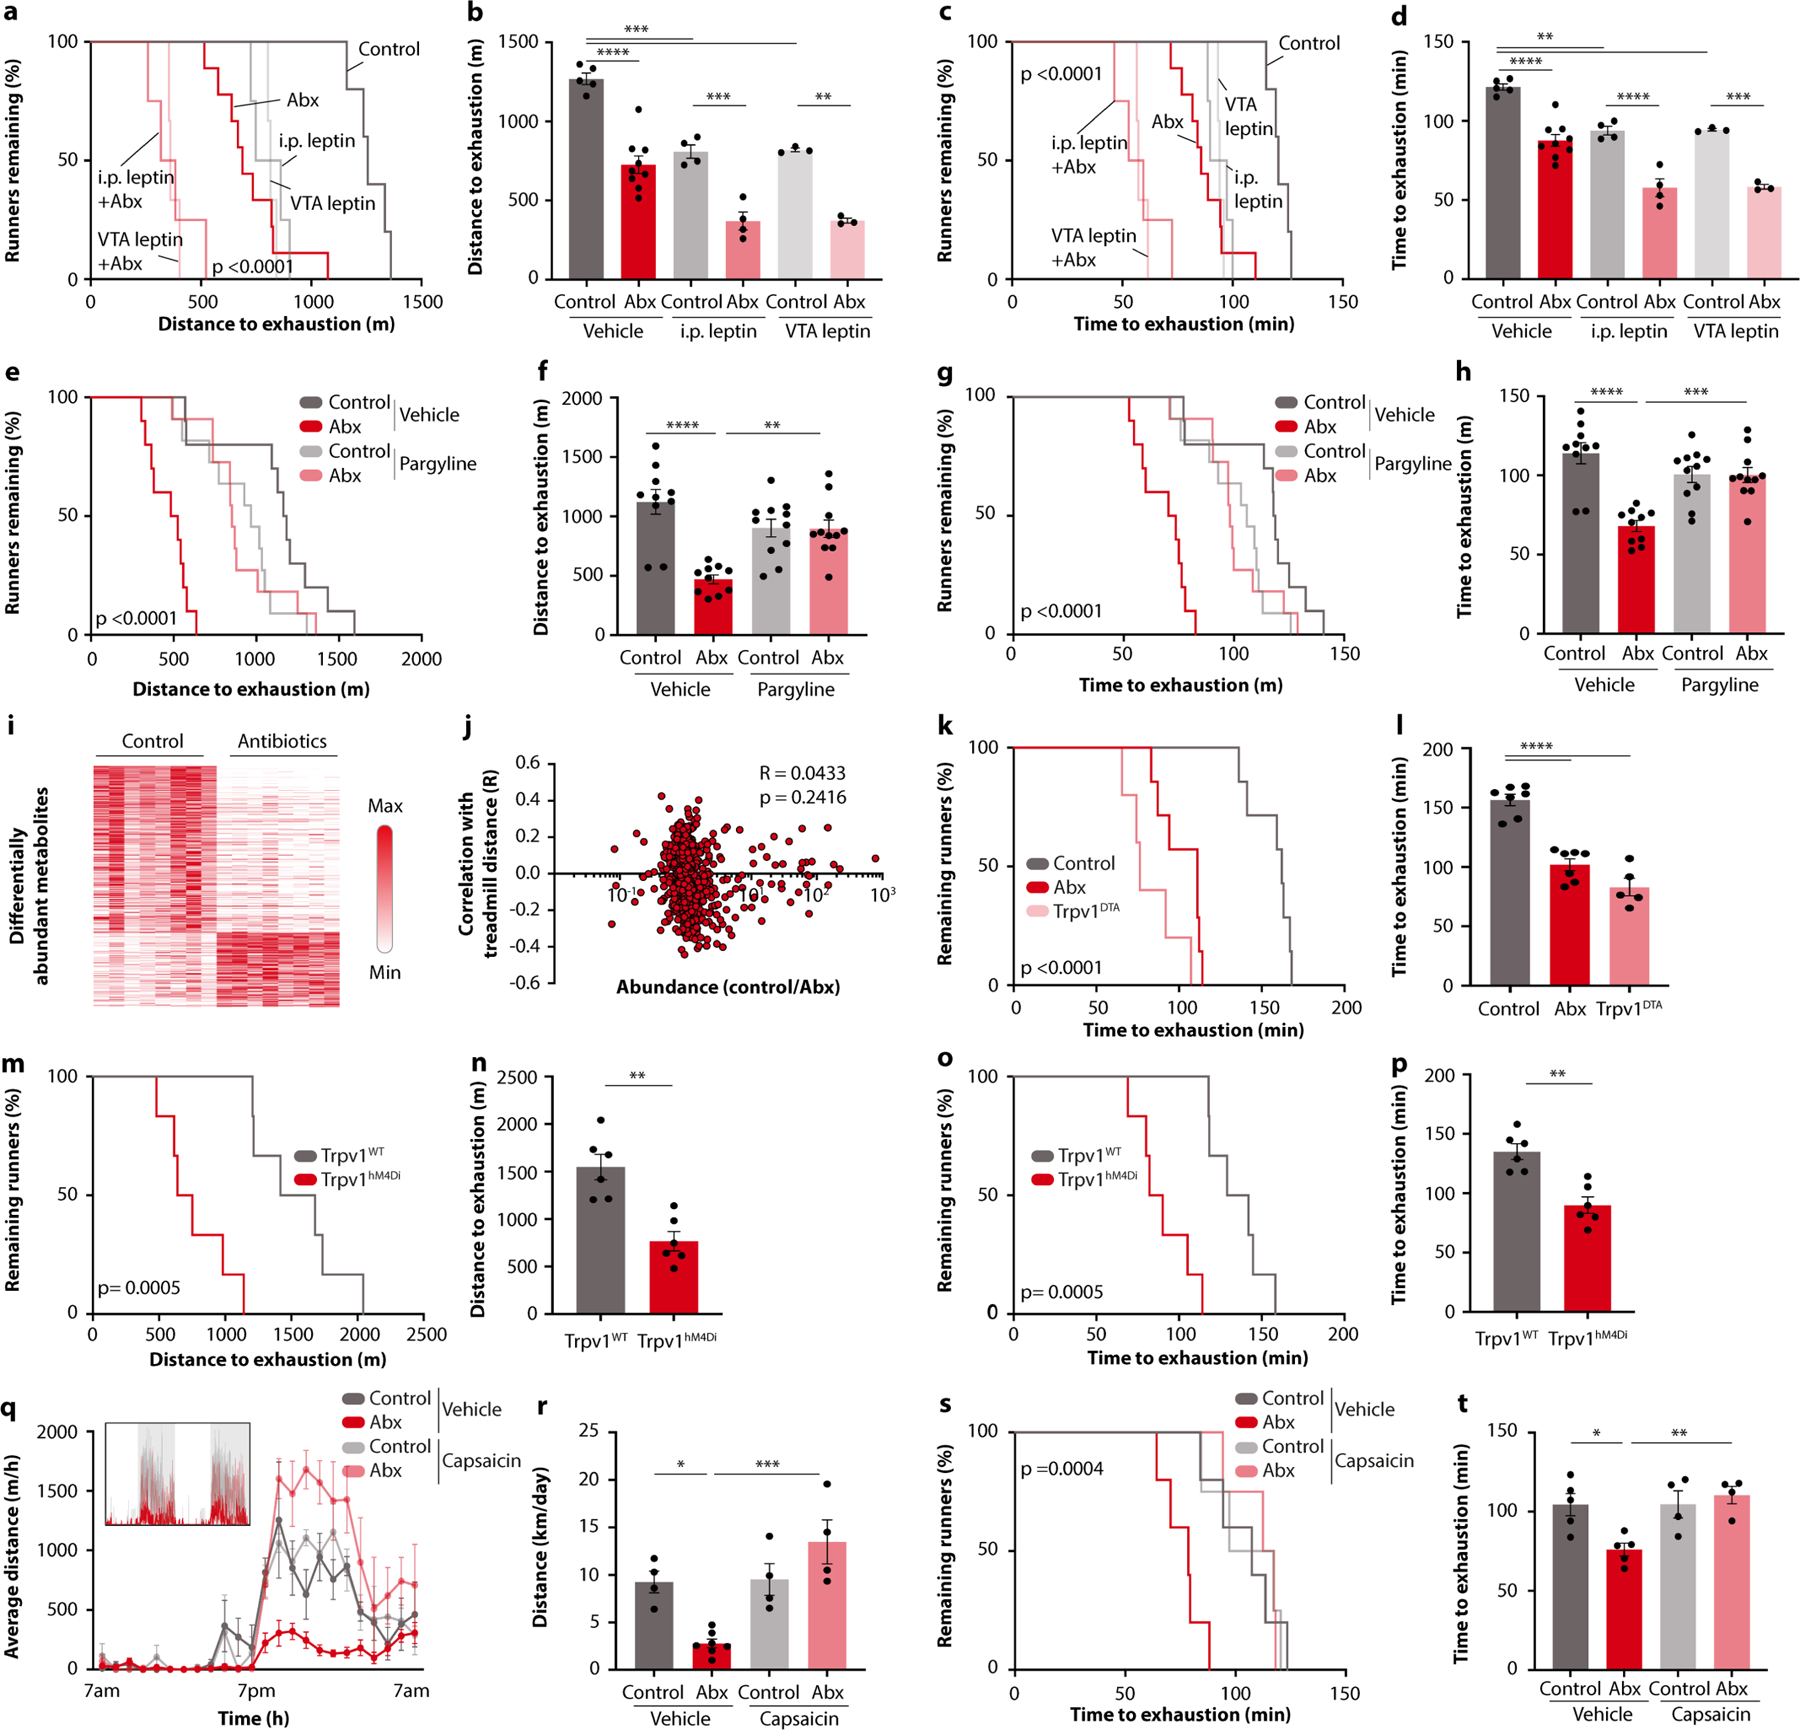
Extended Data Fig. 7 |. Mechanisms of microbiome-mediated control of striatal dopamine responses.

a-d, Kaplan-Meier plots (a, c) and quantifications (b, d) of distance (a, b) and time (c, d) on treadmill of Abx-treated mice, with or without leptin injection i.p. or into the VTA. e-h, Kaplan-Meier plots (e, g) and quantifications (f, h) of distance (e, f) and time (g, h) on treadmill of Abx-treated mice, with or without pargyline treatment. i, Heatmap of differentially abundant serum metabolites between Abx-treated mice and controls. j, Correlation of fold-change of serum metabolite abundance between Abx-treated mice and controls with the correlation of the same metabolites with treadmill distance in the DO cohort. k-p, Kaplan-Meier plots (k, m, o) and quantifications (l, n, p) of time (k, l, o, p) and distance (m, n) on treadmill of Trpv1DTA mice (k, l) and CNO-injected of Trpv1hM4Di mice (m-p). q, r, Averaged hourly distance (q) and quantification (r) of voluntary wheel activity of Abx-treated mice, with or without capsaicin treatment. Inset shows representative recording traces. s, t, Kaplan-Meier plot (s) and quantifications (t) time on treadmill of Abx-treated mice, with or without capsaicin treatment. Error bars indicate means ± SEM. ** p < 0.01, *** p < 0.001, **** p<0.0001. Exact n and p-values are presented in Supplementary Table 2.
