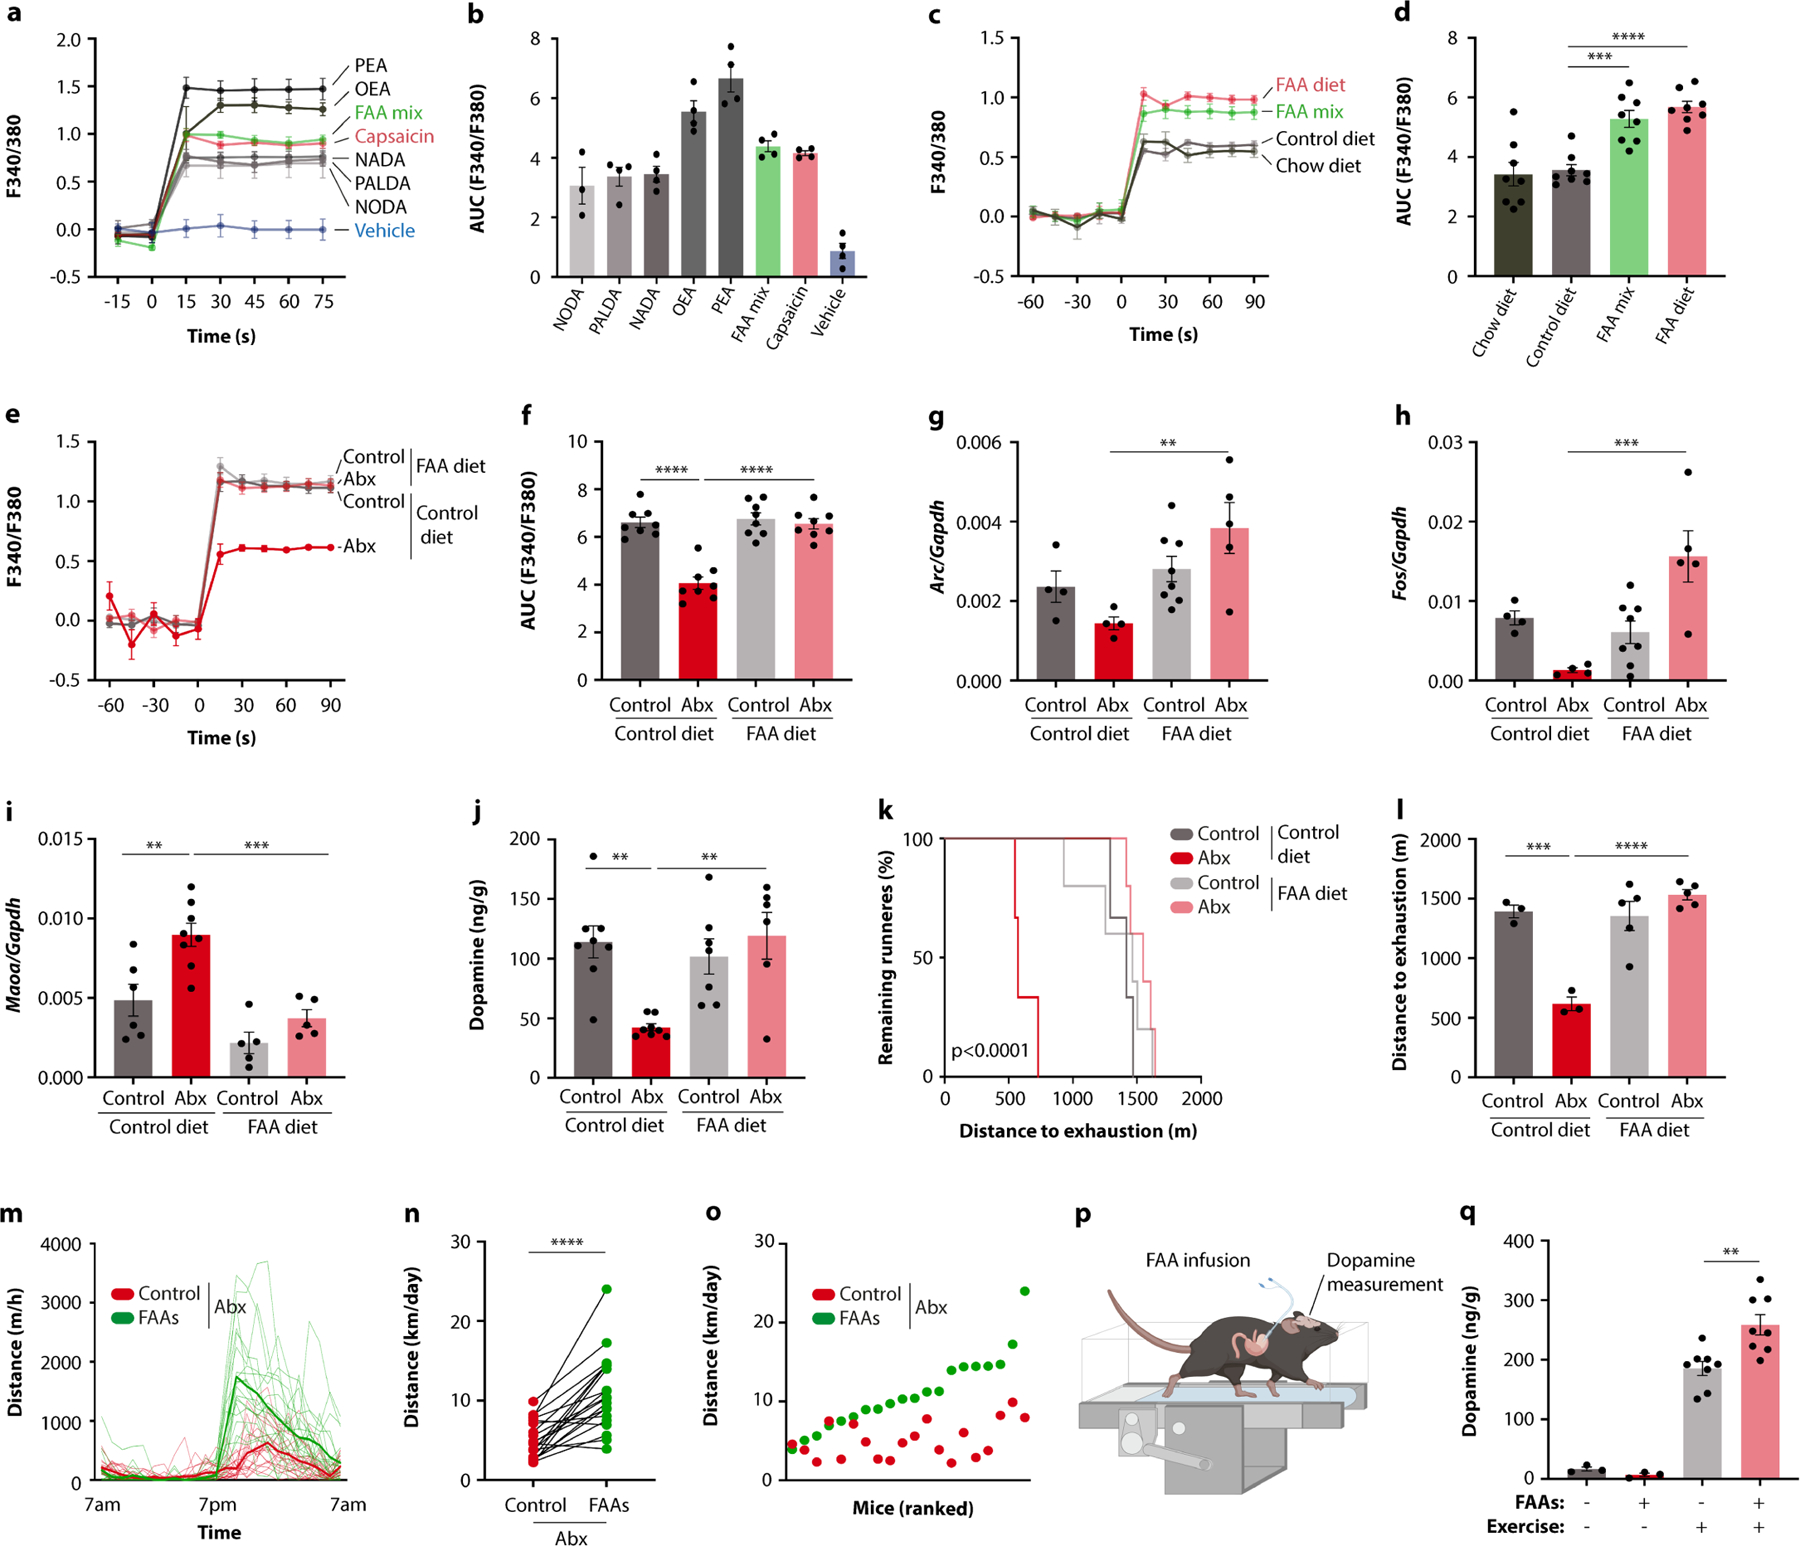
Extended Data Fig. 10 |. Dietary supplementation of fatty acid amides enhances exercise performance.

a-f, Averaged recording traces (a, c, e) and quantifications (b, d, f) of calcium imaging of DRG neurons exposed to individual metabolites (a, b), a fatty acid amide (FAA)-supplemented diet (c, d), or stool extracts from mice fed a FAA-supplemented diet (e, f). g-l, Post-exercise expression of Arc and Fos in DRGs (g, h), post-exercise expression of Maoa and dopamine levels in the striatum (I, j), and Kaplan-Meier plot and quantification of distance on treadmill (k, l) by Abx-treated mice and control, fed a FAA-supplemented or control diet. m-o, Wheel running of Abx-treated DO mice, fed a FAA-supplemented or control diet. p, q, Schematic (p) and striatal dopamine levels (q) of Abx-treated mice receiving gastric infusion of FAA, with or without treadmill exercise. Error bars indicate means ± SEM. ** p < 0.01, *** p < 0.001, **** p < 0.0001. Exact n and p-values are presented in Supplementary Table 2.
