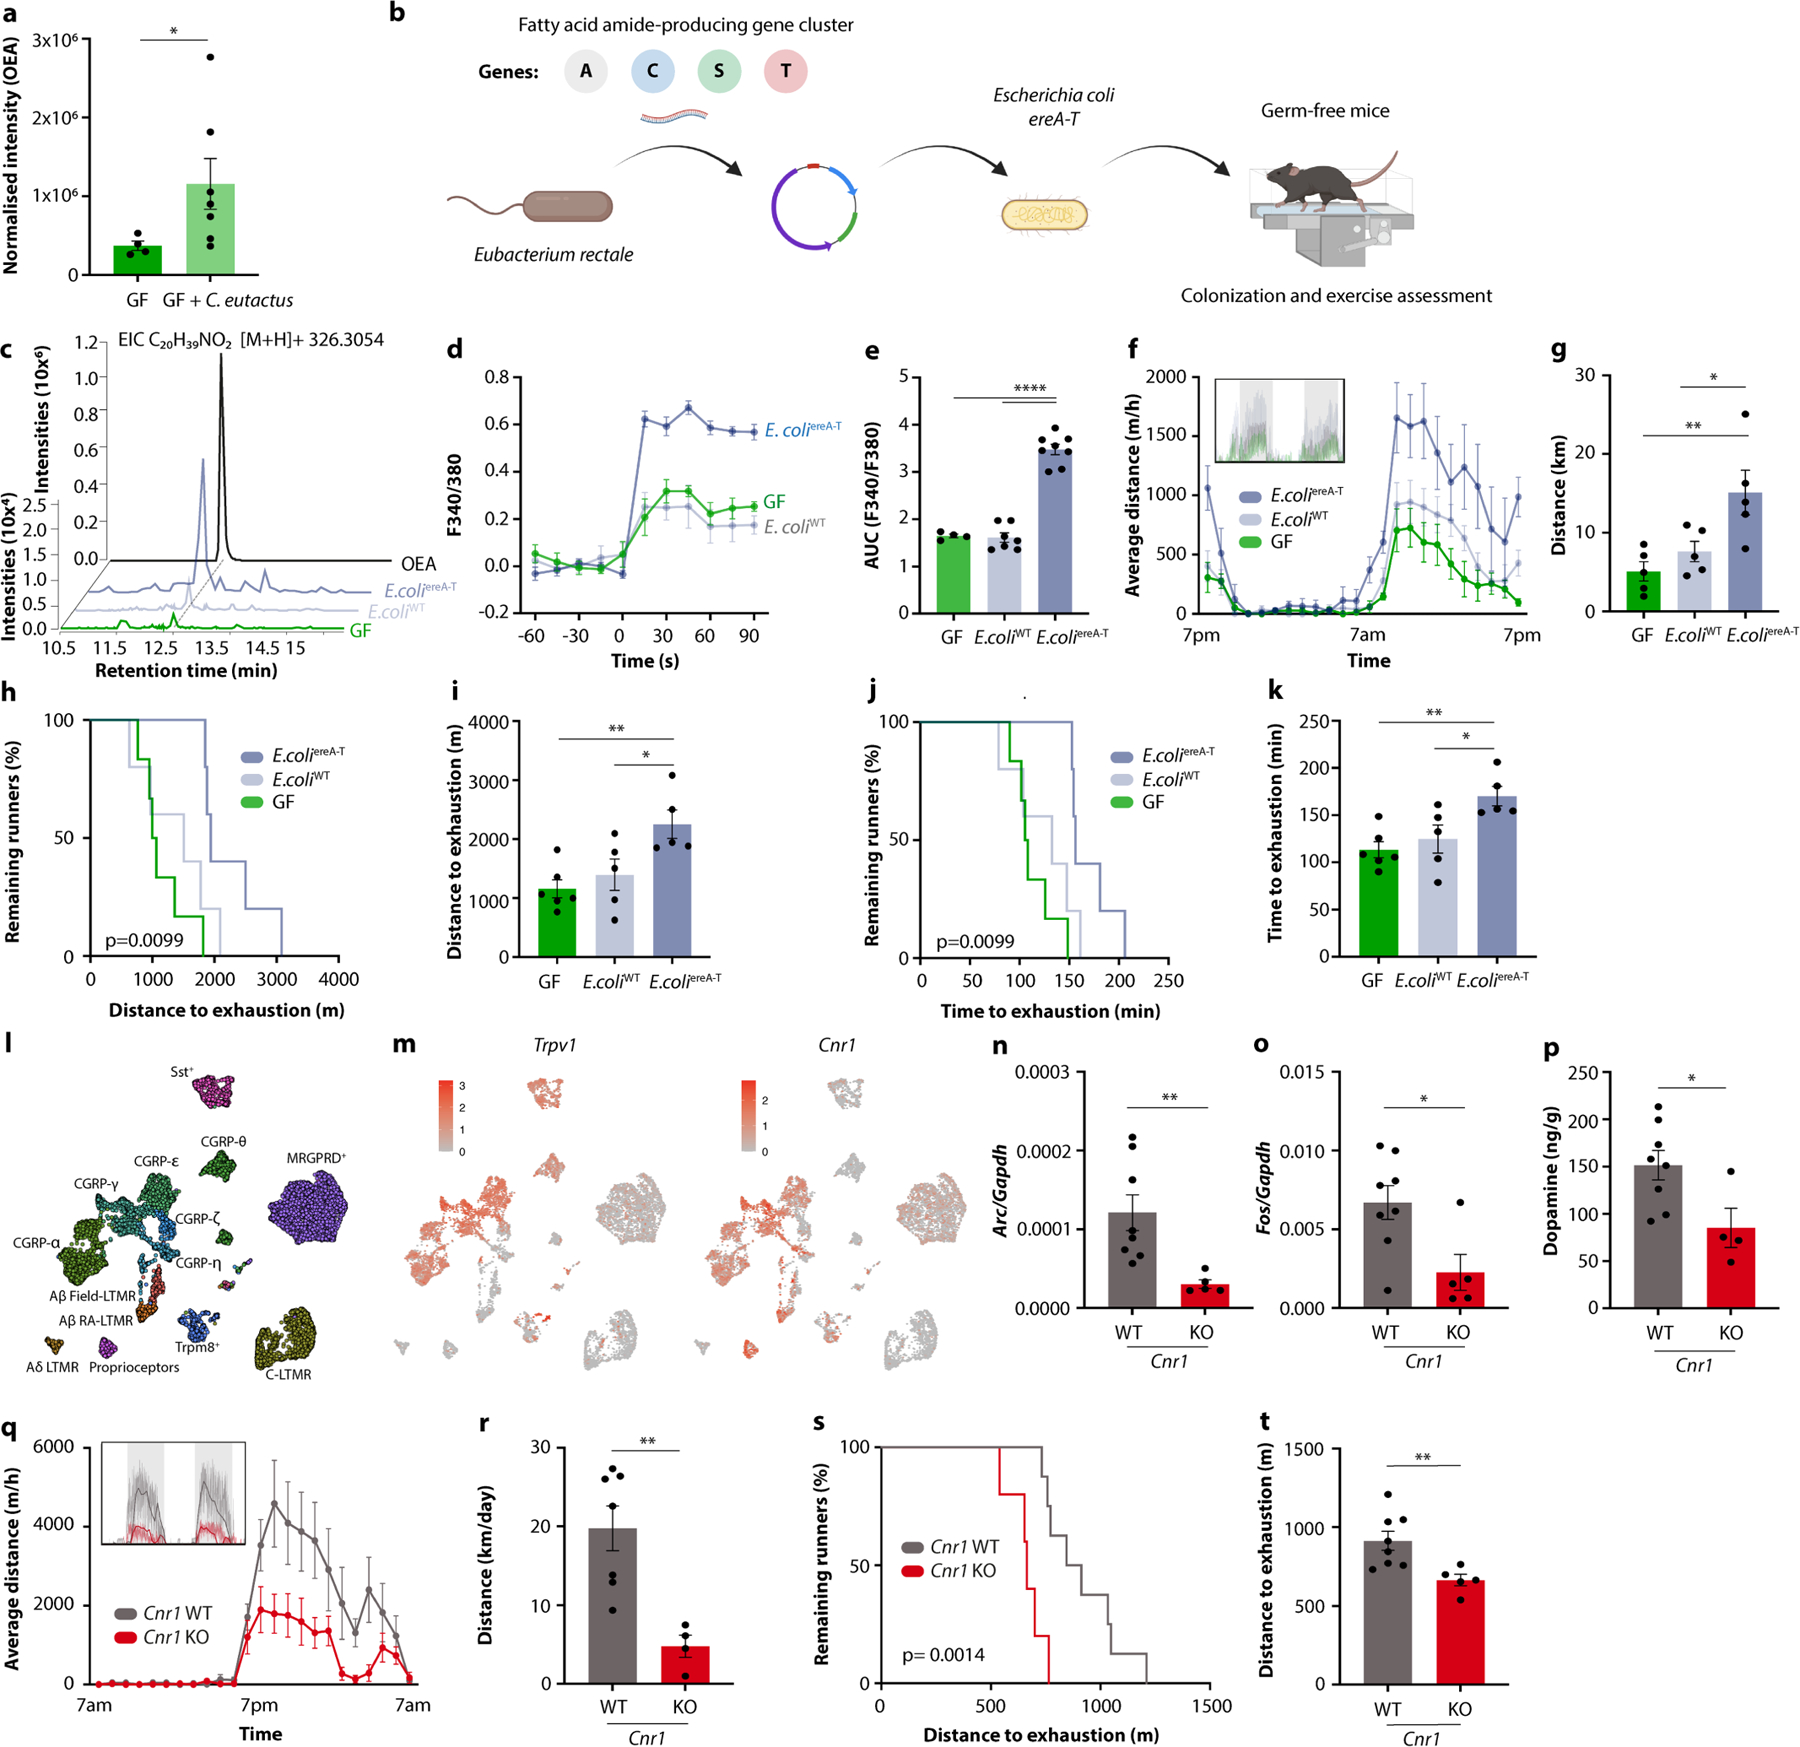
Extended Data Fig. 11 |. Microbiome engineering to enhance fatty acid amide production and exercise performance.

a, OEA levels in GF mice and GF mice mono-colonized with Coprococcus eutactus. b, Schematic of generation of Escherichia coli expressing the ereA-T gene cluster from Eubacterium rectale. c, OEA levels in GF mice and GF mice mono-colonized with either E. coliereA−T or the empty vector-containing strain E. coliWT. d, e, Averaged recording traces (d) and quantification (e) of calcium imaging of DRG neurons exposed to in stool extracts from GF mice and GF mice mono-colonized with either E. coliereA−T or E. coliWT. f, g, Averaged hourly distance (f) and quantification (g) of voluntary wheel activity of GF mice and GF mice mono-colonized with either E. coliereA−T or E. coliWT. Inset shows representative recording traces. h-k, Kaplan-Meier plots (h, j) and quantifications (i, k) of distance (h, i) and time ( j, k) on treadmills by GF mice and GF mice mono-colonized with either E. coliereA−T or E. coliWT. l, m, UMAP plot of all cell types identified in DRGs20 (l) and expression of Trpv1 and Cnr1 (m). n-p, Expression of Arc (n) and Fos (o) in the dorsal root ganglia, and dopamine levels in the striatum (p) of exercised Cnr1-deficient mice and controls. q, r, Averaged hourly distance (q) and quantification (r) of voluntary wheel activity of Cnr1-deficient mice and controls. Inset shows representative recording traces. s, t, Kaplan-Meier plot (s) and quantification (t) of distance on treadmills by Cnr1-deficient mice and controls. Error bars indicate means ± SEM. * p < 0.05, ** p < 0.01, **** p < 0.0001. Exact n and p-values are presented in Supplementary Table 2.
