Abstract
Cell competition involves a conserved fitness-sensing process during which fitter cells eliminate neighbouring less-fit but viable cells1. Cell competition has been proposed as a surveillance mechanism to ensure normal development and tissue homeostasis, and has also been suggested to act as a barrier to interspecies chimerism2. However, cell competition has not been studied in an interspecies context during early development owing to the lack of an in vitro model. Here we developed an interspecies pluripotent stem cell (PSC) co-culture strategy and uncovered a previously unknown mode of cell competition between species. Interspecies competition between PSCs occurred in primed but not naive pluripotent cells, and between evolutionarily distant species. By comparative transcriptome analysis, we found that genes related to the NF-κB signalling pathway, among others, were upregulated in less-fit ‘loser’ human cells. Genetic inactivation of a core component (P65, also known as RELA) and an upstream regulator (MYD88) of the NF-κB complex in human cells could overcome the competition between human and mouse PSCs, thereby improving the survival and chimerism of human cells in early mouse embryos. These insights into cell competition pave the way for the study of evolutionarily conserved mechanisms that underlie competitive cell interactions during early mammalian development. Suppression of interspecies PSC competition may facilitate the generation of human tissues in animals.
PSCs are invaluable for the study of mammalian development and hold great potential in revolutionizing regenerative medicine2,3. Recently, PSC-derived interspecies chimeras have provided a means to generate complex tissues in vivo, which may help to overcome the worldwide shortage of donor organs for transplantation4–8. Although robust chimerism has been achieved among several rodent species4,9,10, low levels of chimerism were observed between evolutionarily distant species5,11,12, even at early developmental stages. Cell competition, first studied in Drosophila, describes the process of eliminating viable neighbour cells with lower fitness levels13. Cell competition has been recognized as an evolutionarily conserved quality control mechanism to safeguard pluripotency and development1,14. During the formation of interspecies chimeras, xenogenic donor cells may be less fit than host cells, and thereby be targeted for elimination.
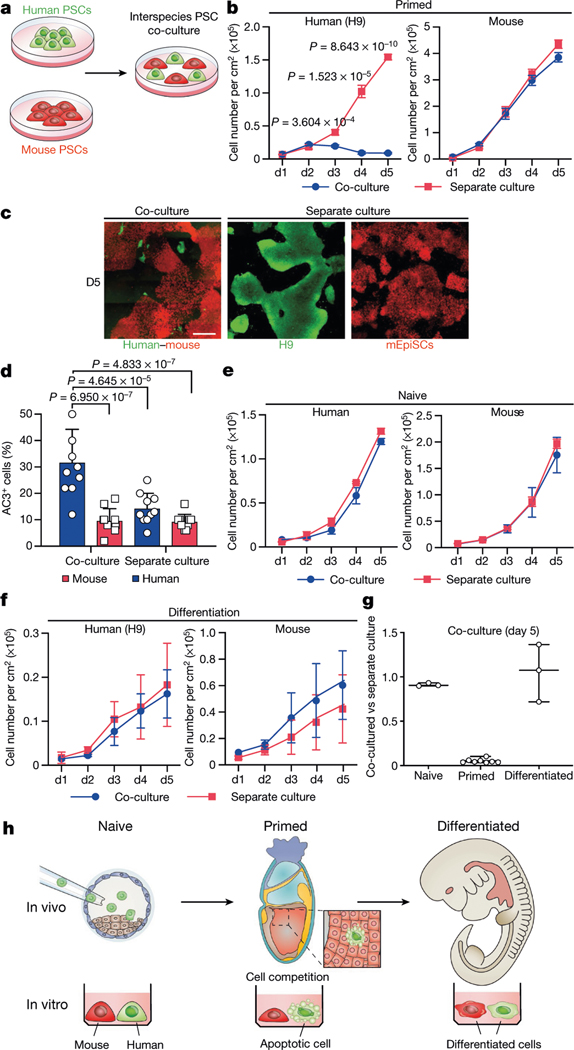
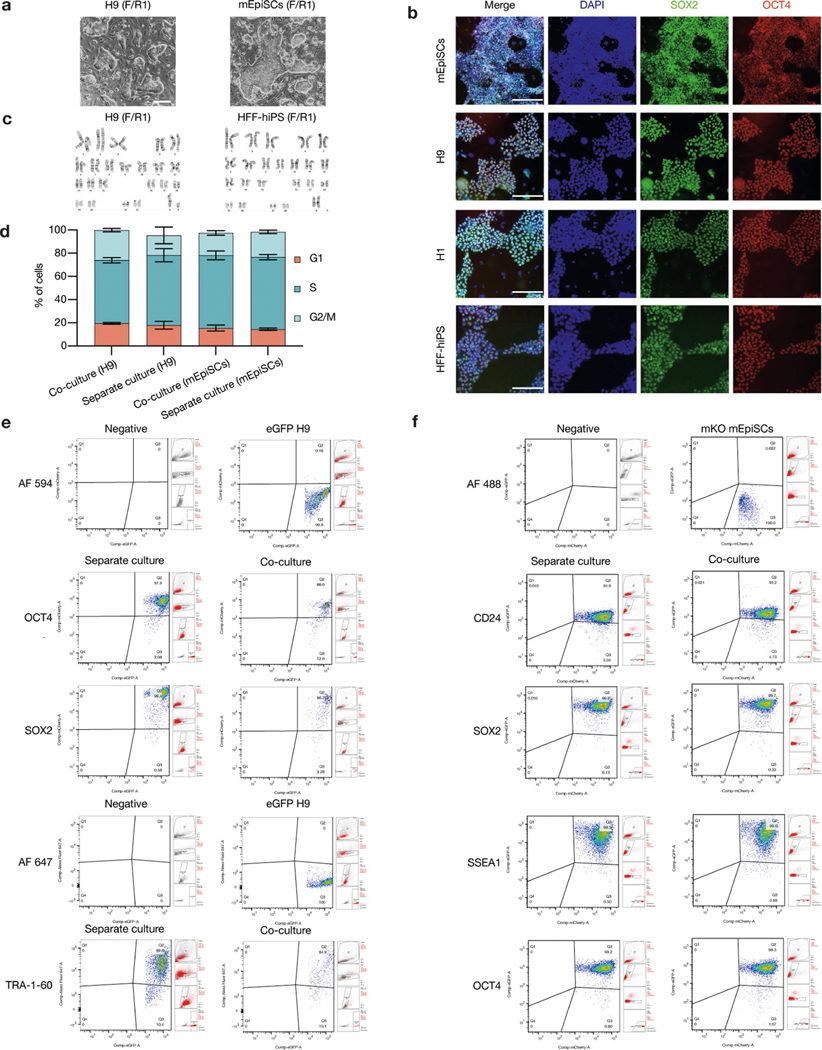
PSCs corresponding to different phases of pluripotency in vivo have been generated and studied in detail15,16. Naive and primed PSCs resemble peri-implantation17 and peri-gastrulation18 epiblasts, respectively. To examine interspecies cell competition during early development, we established in vitro systems based on the co-culture of PSCs (naive or primed) from different species (Fig. 1a). For primed PSCs, we used a culture system containing bFGF and the canonical WNT pathway inhibitor IWR1 (known as FGF2/IWR1, or F/R1)19. When cultured separately, both H9 human embryonic stem (hES) cells and mouse epiblast stem cells (mEpiSCs) proliferated well and maintained stable colony morphology, expression of pluripotency genes, and genome stability during long-term passaging19 (Extended Data Fig. 1a–c). We labelled H9-hES cells and mEpiSCs with enhanced green fluorescent protein (eGFP) and monomeric Kusabira Orange (mKO), respectively. Time-lapse confocal microscopy analysis showed that during co-culture, many H9-hES cells underwent apoptosis after contacting mEpiSCs (Supplementary Videos 1–3). Next, we calculated the cell density (cell number per cm2) of live H9-hES cells and mEpiSCs in co-cultures and separate cultures daily until they grew to confluency. From day 3, significantly lower numbers of H9-hES cells were found in co-cultures than in separate cultures, whereas the numbers of mEpiSCs remained comparable (Fig. 1b). Notably, on day 5, few H9-hES cells were present in co-culture (Fig. 1c). Co-cultured H9-hES cells and mEpiSCs maintained expression of pluripotency genes and similar cell cycle profiles to separate cultures (Extended Data Fig. 1d–f). When compared to separate cultures, there was a significant increase in the percentage of cells undergoing apoptosis in co-cultured H9-hES cells but not in mEpiSCs (Fig. 1d, Extended Data Fig. 2a, b). Similar results were obtained when using two other human PSC lines: H1-hES cells and HFF-derived human induced pluripotent stem cells (HFF-hiPS cells)18 (Extended Data Fig. 2c–f). For naive PSCs, we used several reported human naive or naive-like culture conditions, which also supported the long-term culture of mouse ES cells20–23 (Extended Data Fig. 3a–e). In contrast to primed PSCs, we did not observe overt cell competition during the co-culturing of human and mouse naive PSCs (Fig. 1e, Extended Data Fig. 3f–i, Supplementary Video 4). In addition, we found no apparent cell competition during early co-differentiation of human and mouse primed PSCs (Fig. 1f, Extended Data Fig. 3j–l, Supplementary Video 5). Collectively, these results demonstrate that competition between human and mouse PSCs is confined within primed pluripotency, which is consistent with previous mouse studies24–27 (Fig. 1g, h).
Fig. 1 |. Cell competition between human and mouse primed PSCs.
a, A schematic of human and mouse PSC co-culture. b, Growth curves of co-cultured (blue) and separately cultured (red) H9-hES cells (left) and mEpiSCs (right) grown in the F/R1 culture condition. n = 8, biological replicates. c, Representative fluorescence images of day-5 co-cultured and separately cultured H9-hES cells (green) and mEpiSCs (red). Scale bar, 400 μm. d, Quantification of AC3+ cells in day-3 co-cultured and separately cultured H9-hES cells (blue) and mEpiSCs (red). n = 10, randomly selected 318.2 × 318.2 μm2 fields examined over three independent experiments. e, Growth curves of co-cultured (blue) and separately cultured (red) human and mouse naive PSCs, grown in 5iLAF medium. n = 3, biological replicates. f, Growth curves of co-differentiation (blue) and separate differentiation (red) cultures of H9-hES cells and mEpiSCs. n = 3, biological replicates. g, Ratios (co-culture versus separate culture) of day-5 live human cell numbers in naïve (n = 3), primed (n = 8) and differentiation (n = 3) cell culture conditions. n, biological replicates. h, Schematic summary of human and mouse PSC competition. Plating ratio was 4:1 (human:mouse) for all co-cultures shown. P values determined by unpaired two-tailed t-test (b) or one-way analysis of variance (ANOVA) with Tukey’s multiple comparison (d). All data are mean ± s.e.m.
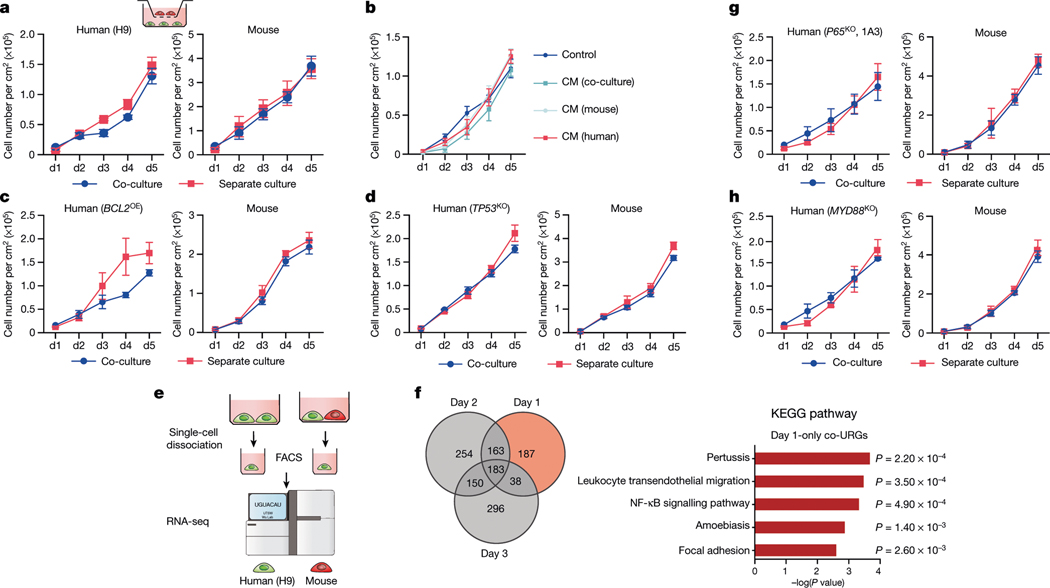
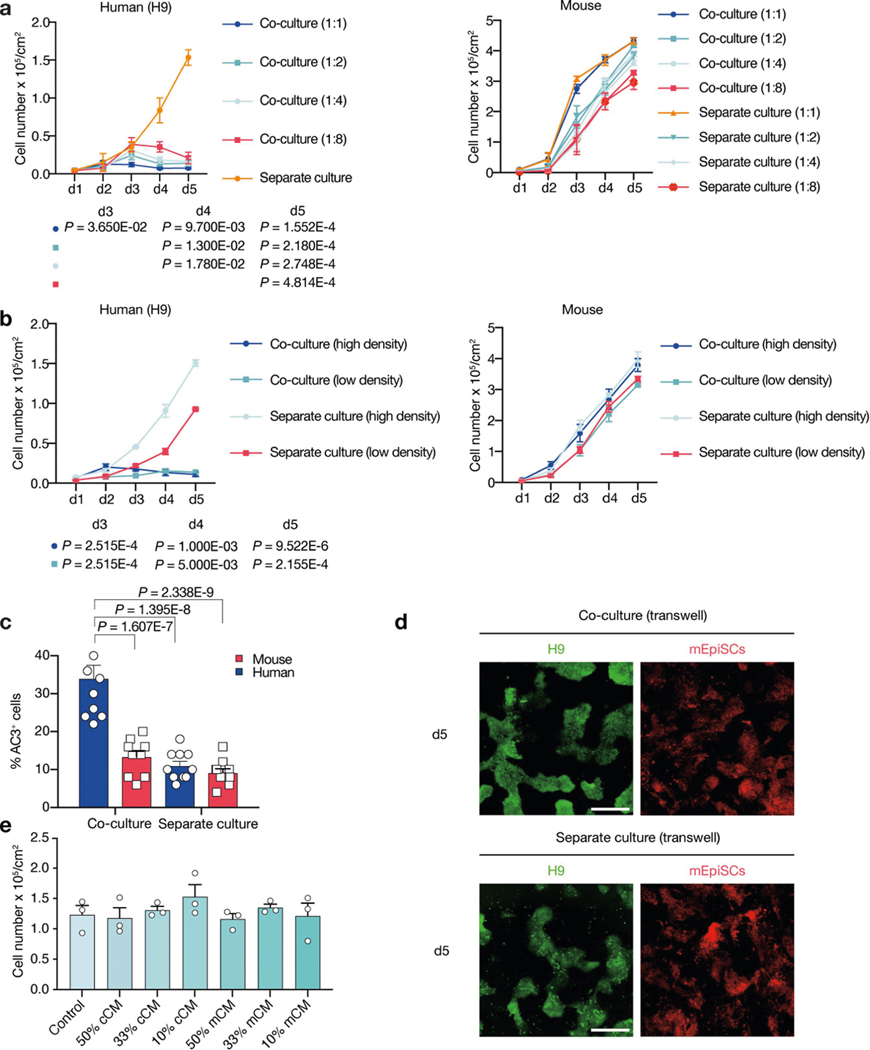
We studied the effects of plating ratios and densities on competition between human and mouse primed PSCs and observed faster elimination of human cells when a higher proportion of mEpiSCs were seeded (Extended Data Fig. 4a–c). We also performed co-culturing on micropatterned coverslips to maximize cell–cell contact, and observed that most human cell death occurred between days 2 and 3 (Supplementary Video 6). We found the cell competition between human and mouse primed PSCs was contact-dependent, as non-contact co-cultures (either in transwells or ibidi chamber slides) did not show evidence of cell competition (Fig. 2a, Extended Data Fig. 4d, Supplementary Videos 7, 8). In addition, we found that the treatment of H9-hES cells with conditioned medium collected from co-cultures and separate cultures did not result in pronounced human cell apoptosis (Fig. 2b, Extended Data Fig. 4e). These results indicate that competitive interaction between human and mouse primed PSCs is contact-dependent and probably not as a result of secreted factors.
Fig. 2 |. Mechanisms underlying human–mouse primed PSC competition.
a, Growth curves of co-cultured (blue) and separately cultured (red) H9-hES cells (left) and mEpiSCs (right) in transwell culture conditions. n = 3, biological replicates. b, Growth curves of H9-hES cells treated with different types of concentrated conditioned medium (CM). n = 3, biological replicates. c, Growth curves of co-cultured (blue) and separately cultured (red) BCL2OE hiPS cells (left) and mEpiSCs (right). n = 4, biological replicates. d, Growth curves of co-cultured (blue) and separately cultured (red) TP53KO hiPS cells (left) and mEpiSCs (mouse). n = 3, biological replicates. e, Schematic of the RNA-seq experimental setup. f, Left, Venn diagram showing the numbers of co-URGs in H9-hES cells. Right, top five KEGG pathways enriched in day-1-only co-URGs in H9-hES cells. n = 2, biological replicates. P values determined by a modified one-sided Fisher’s exact test (EASE score). g, Growth curves of co-cultured (blue) and separately cultured (red) P65KO hiPS cells (clone 1A3) (left) and mEpiSCs (right). n = 3, biological replicates. h, Growth curves of co-cultured (blue) and separately cultured (red) MYD88KO hiPS cells (left) and mEpiSCs (right). n = 3, biological replicates. All data are mean ± s.e.m.
The activation of apoptosis represents the main mechanism of elimination of viable but less fit ‘loser’ cells, and has been linked to downregulation of the anti-apoptotic Bcl2 gene24,28,29. To test whether blocking apoptosis can overcome cell competition, we generated HFF-hiPS cells stably expressing BCL2 (BCL2OE hiPS cells) (Extended Data Fig. 5a, b). We found that overexpression of BCL2 was effective at preventing the elimination of HFF-hiPS cells during co-culture with mEpiSCs (Fig. 2c, Extended Data Fig. 5c). The pro-apoptotic gene Trp53 (TP53 in humans) is emerging as a key player in cell competition in different mammalian systems25,30,31. To determine whether P53 is involved in human cell death during co-culture with mEpiSCs, we used short hairpin RNA (shRNA) to reduce P53 levels in HFF-hiPS cells (TP53KD hiPS cells) and also generated TP53 knockout (TP53KO) HFF-hiPS cells (Extended Data Fig. 5d, e, h, i). When TP53KD or TP53KO hiPS cells were co-cultured with mEpiSCs, a complete rescue of human cell death was observed (Fig. 2d, Extended Data Fig. 5f, g, j, Supplementary Video 9). mTOR signalling was previously shown to act downstream of P53 during cell competition in mice25. We increased mTOR activity in HFF-hiPS cells by knocking out TSC1 (an inhibitor of the mTOR pathway), and found the TSC1 deficiency did not rescue the elimination of HFF-hiPS cells by mEpiSCs (Extended Data Fig. 5k–m). In summary, we demonstrate that either overexpression of the anti-apoptotic BCL2 gene or abrogation of the pro-apoptotic TP53 gene can promote the survival of human primed PSCs when co-cultured with mEpiSCs.
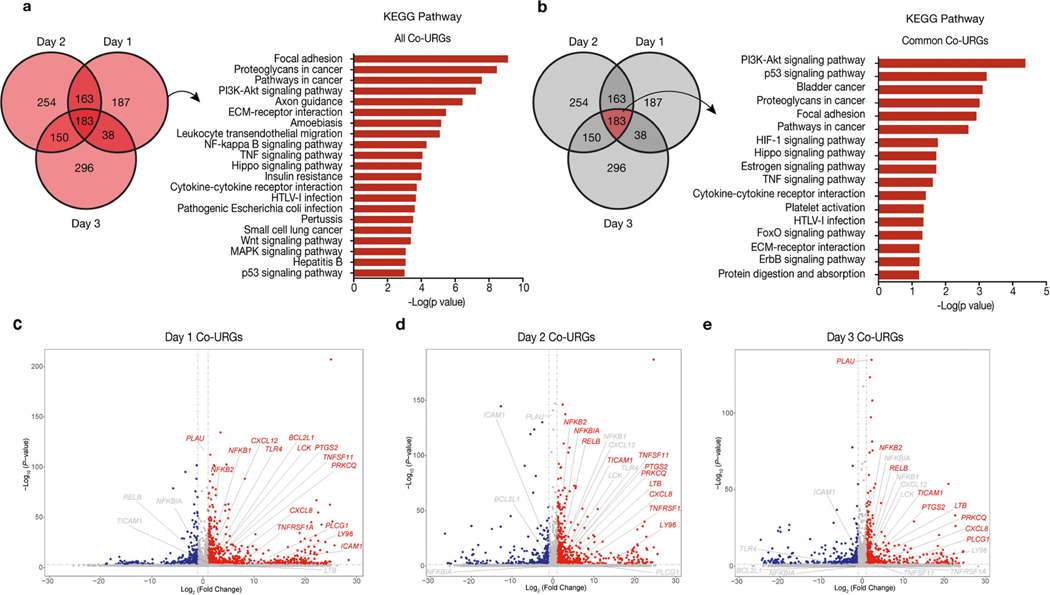
To gain additional mechanistic insights, we performed RNA sequencing (RNA-seq) analysis using H9-hES cells isolated from day-1–3 co-cultures and separate cultures (Fig. 2e). Comparative transcriptome analysis identified 571, 750 and 667 upregulated genes on days 1, 2 and 3, respectively, in co-cultured versus separately cultured H9-hES cells (co-culture upregulated genes, or co-URGs) (Fig. 2f). Gene Ontology (GO) and Kyoto Encyclopedia of Genes and Genomes (KEGG) pathway analyses were performed using co-URGs from all (days 1, 2 and 3 combined), common (commonly shared among days 1, 2 and 3) and day 1 only. We found many enriched GO cellular component terms related to the extracellular regions and the plasma membrane, consistent with the finding that cell competition between human and mouse primed PSCs is contact-dependent (Supplementary Table 1). Enriched GO biological process terms included ‘positive regulation of apoptotic process’, ‘inflammatory response’, and ‘regulation of cell motility/migration’, among others (Supplementary Table 1). KEGG pathway analysis confirmed that the P53 signalling pathway was among the overrepresented pathways in ‘all’ (ranked twenty-first) and ‘common’ (ranked second) co-URGs, which is consistent with our findings using TP53KD and TP53KO hiPS cells (Extended Data Fig. 6a, b, Supplementary Table 1).
Notably, the NF-κB signalling pathway was ranked third and ninth in the day-1-only and all co-URG groups, respectively, and many NF-κB pathway-related genes were significantly upregulated in co-cultured versus separately cultured H9-hES cells (Fig. 2f, Extended Data Fig. 6a, c–e). NF-κB represents an early response factor, which can be activated rapidly after stimulation32, and has key roles in cell competition in Drosophila induced by the Myc and Minute (also known as RpS17) genes33. To determine whether NF-κB signalling activates apoptosis in human cells, we knocked out P65 in HFF-hiPS cells (P65KO hiPS cells) (Extended Data Fig. 7a, b). P65KO hiPS cells maintained genomic stability and intact primed pluripotency (Extended Data Fig. 7c–e). Notably, time-lapse confocal microscopy showed little to no competitive interaction between co-cultured mEpiSCs and P65KO hiPS cells (Supplementary Video 10). The growth dynamics of P65KO hiPS cells in co-cultures and separate cultures were comparable (Fig. 2g, Extended Data Fig. 7f–h). MyD88 is a key signalling adaptor for all mammalian Toll-like receptors (TLRs) (except TLR3), which has the main role of activating NF-κB. We generated homozygous MYD88 knockout HFF-hiPS cells (MYD88KO hiPS cells), and confirmed MYD88 deficiency did not perturb the self-renewal and primed pluripotency status of HFF-hiPS cells (Extended Data Fig. 7i–l). Similar to P65, MYD88 deficiency rescued HFF-hiPS cells from being outcompeted by mEpiSCs (Fig. 2h, Extended Data Fig. 7m, Supplementary Video 11). By examining the P53 and NF-κB pathway activation status in co-cultures and separate cultures of wild-type, MYD88KO, P53KO and P65KO hiPS cells, we uncovered a putative MYD88–P53–P65 axis that can trigger human cell death as the result of the competition between human and mouse primed PSCs (Extended Data Fig. 7n, o).
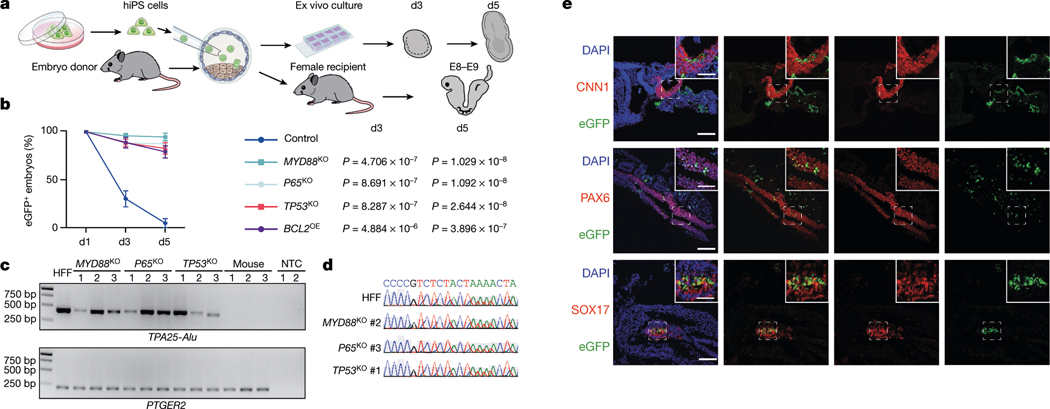
To determine whether overcoming interspecies primed PSC competition can improve human cell survival in early mouse embryos, we performed microinjections of eGFP-labelled BCL2OE, TP53KO, P65KO, MYD88KO and wild-type hiPS cells into mouse blastocysts followed by ex vivo culture34 (Fig. 3a). After 3 and 5 days of culturing, eGFP signals could only be detected in a few embryos injected with wild-type hiPS cells, whereas most embryos injected with BCL2OE, TP53KO, P65KO and MYD88KO hiPS cells still contained eGFP+ cells (Fig. 3b, Extended Data Fig. 8a, Supplementary Table 2). Next, we stained day-5 embryos with antibodies against activated caspase-3 (AC3) and OCT4 (also known as POU5F1). Our results confirmed that the eGFP signal was from live human cells, and some eGFP+OCT4+ cells were found inside mouse epiblast (Extended Data Fig. 8b). Next we performed embryo transfers and investigated whether primed TP53KO, P65KO and MYD88KO hiPS cells could contribute to chimera formation in vivo. We detected the eGFP signal from many embryonic day (E) 8–9 mouse embryos generated by MYD88KO, P65KO and TP53KO but not wild-type hiPS cells (Extended Data Fig. 8c, Supplementary Table 2). The presence of human cells was confirmed by immunofluorescence analysis, genomic PCR using human-specific Alu (TPA25-Alu) primers35, and Sanger sequencing (Fig. 3c, d, Extended Data Fig. 8c–f). On the basis of the immunofluorescent eGFP signal, the percentages of E8–E9 mouse embryos containing human cells were 19.39% (19 out of 98), 9.52% (4 out of 42) and 8.00% (4 out of 50) for MYD88KO, P65KO and TP53KO hiPS cells, respectively, but 0% (0 out of 23) for wild-type hiPS cells (Extended Data Fig. 8c, Supplementary Table 2). We next performed co-staining of eGFP with different lineage markers: endoderm (SOX17), mesoderm (CNN1) and ectoderm (PAX6), and found that MYD88KO, P65KO and TP53KO hiPS cells differentiated into cells from all three primary germ layers (Fig. 3e, Extended Data Fig. 8e, f). Together, genetic inactivation of TP53, MYD88 or P65 improves the survival and chimerism of human primed PSCs in early mouse embryos.
Fig. 3 |. Overcoming interspecies PSC competition enhances human primed PSCs survival and chimerism in early mouse embryos.
a, Schematic showing the generation of ex vivo and in vivo human–mouse chimeric embryos. b, Line graphs showing the percentages of eGFP+ mouse embryos at indicated time points during ex vivo culture after blastocyst injection of wild-type (control), MYD88KO, P65KO, TP53KO and BCL2OE hiPS cells. n = 3 (control), n = 4 (MYD88KO), n = 6 (P65KO), n = 6 (TP53KO) and n = 3 (BCL2OE) independent injection experiments. Data are mean ± s.e.m. P values (versus control) determined by one-way ANOVA with least significant difference (LSD) multiple comparison. c, Genomic PCR analysis of E8–E9 mouse embryos derived from blastocyst injection of MYD88KO, P65KO and TP53KO hiPS cells, and non-injected control blastocysts. TPA25-Alu denotes a human-specific primer; PTGER2 was used as a loading control. HFF, HFF-hiPS cells. NTC, non-template control. This experiment was repeated independently three times with similar results. For gel source data, see Supplementary Fig. 1. d, Sanger sequencing results of representative PCR products generated by human-specific TPA25-Alu primers. A stretch of TPA25-Alu DNA sequences derived from HFF, MYD88KO (#2), P65KO (#3) and TP53KO (#1) from c are shown. e, Representative immunofluorescence images showing contribution and differentiation of eGFP-labelled MYD88KO hiPS cells in E8–E9 mouse embryos. Embryo sections were stained with antibodies against eGFP and lineage markers including CNN1 (mesoderm, top), PAX6 (ectoderm, middle) and SOX17 (endoderm, bottom). Scale bars, 100 μm and 50 μm (insets). Images are representative of three independent experiments.
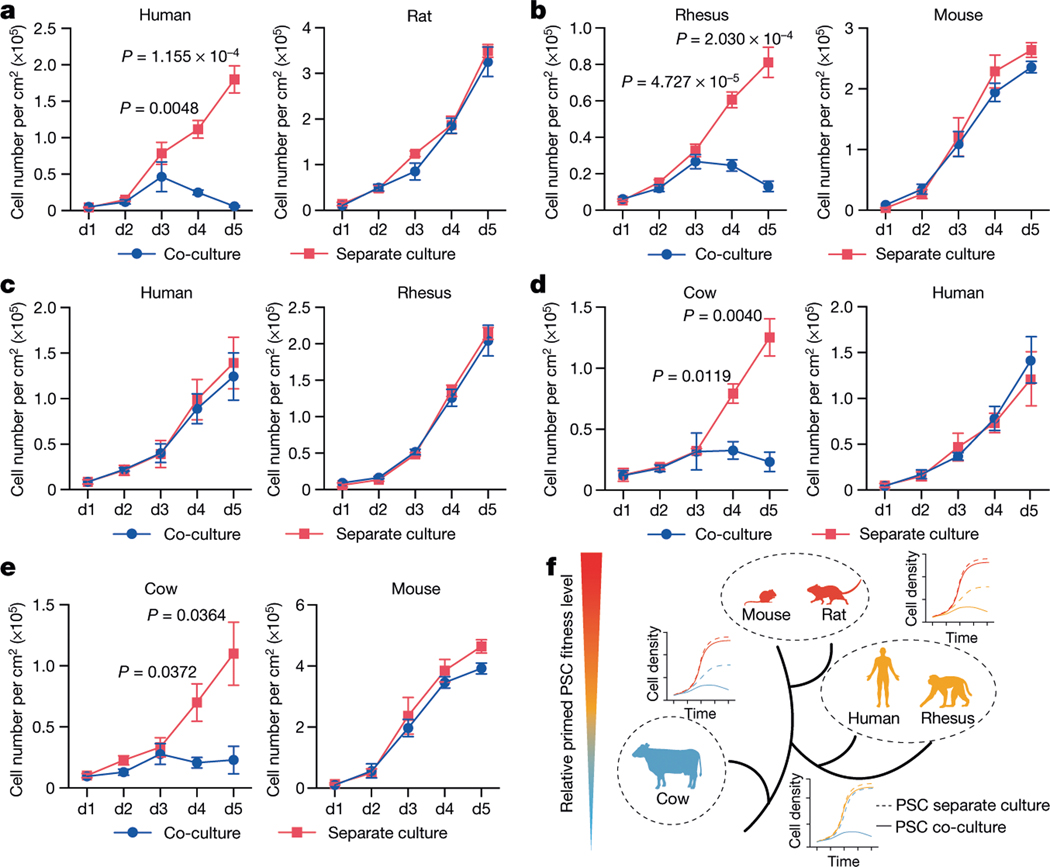
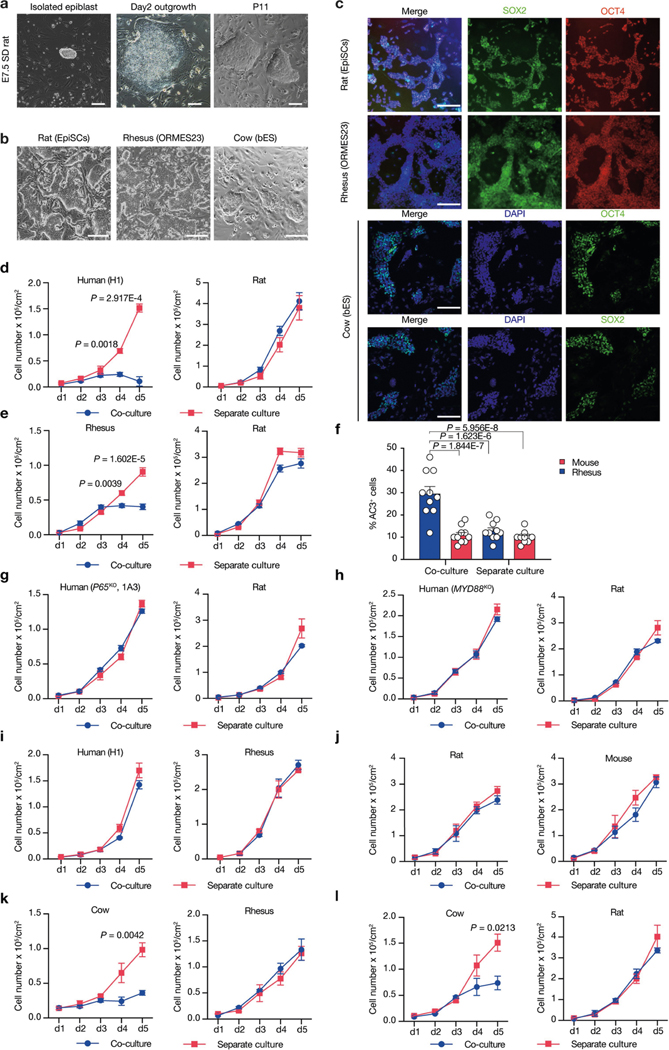
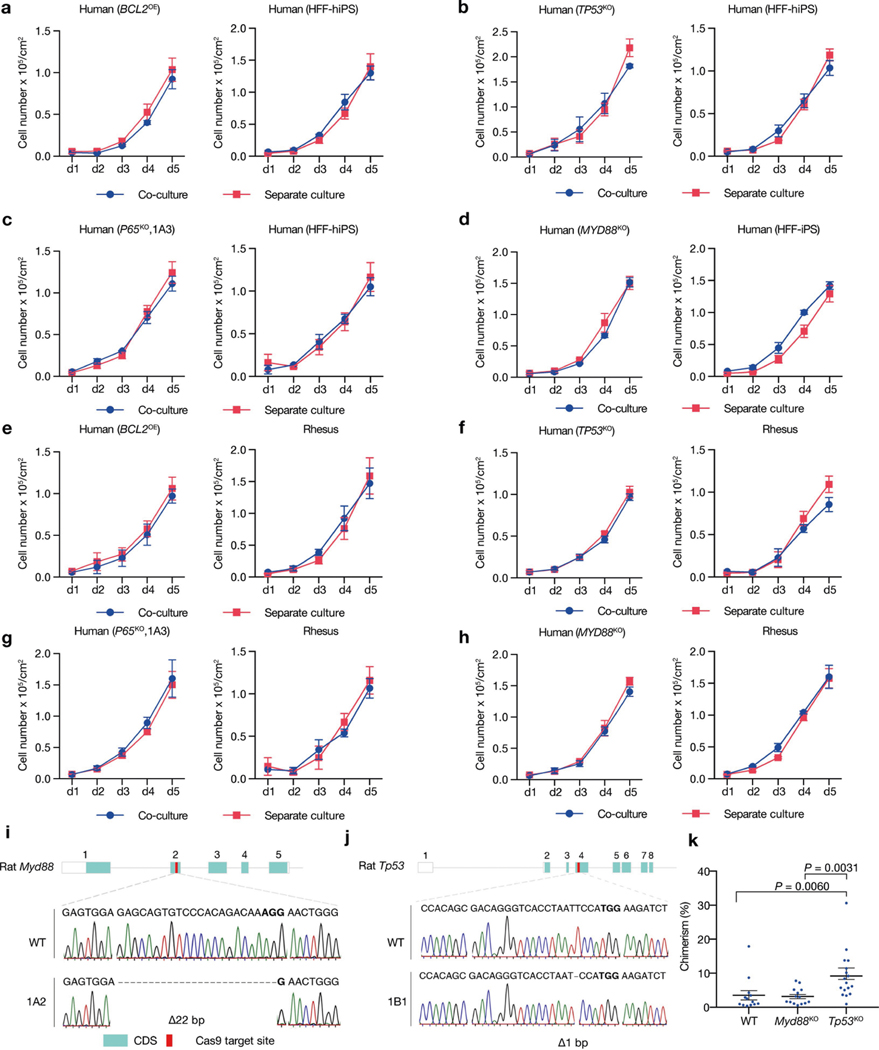
To examine whether primed PSC competition occurs between other species, we studied bovine ES cells36, rhesus macaque ES cells (ORMES23)37 and rat EpiSCs grown in F/R1 culture conditions19 (Extended Data Fig. 9a–c). Similar to human and mouse cells, pronounced cell competition was observed in co-cultures of primate–rodent, primate–cow and rodent–cow, but not rat–mouse and human–rhesus PSCs (Fig. 4a–e, Extended Data Fig. 9d–f, i–l). MYD88 and P65 deficiency also prevented HFF-hiPS cells from being outcompeted by rat EpiSCs (Extended Data Fig. 9g, h). MYD88KO, TP53KO, P65KO or BCL2OE, however, did not confer HFF-hiPS cells with the ‘super competitor’ status1 (Extended Data Fig. 10a–h). Similarly, Myd88 deficiency did not improve rat chimerism in mouse embryos (Extended Data Fig. 10i, k). By contrast, Tp53KO rat ES cells showed a significantly higher level of chimerism in E10.5 mouse embryos than wild-type rat ES cells (Extended Data Fig. 10j, k), which suggests that other competitive mechanism(s) exists that can activate the P53 pathway in rat cells independent of MyD88 or NF-κB. Collectively, these results extend primed PSC competition beyond humans and mice, and suggest that it is a more general phenomenon among different species (Fig. 4f).
Fig. 4 |. Primed PSC competition among different species.
a, Growth curves of co-cultured (blue) and separately cultured (red) H9-hES cells and rat EpiSCs. Plating ratio of 4:1 (human:rat). n = 3, biological replicates. b, Growth curves of co-cultured (blue) and separately cultured (red) ORMES23 rhesus ES cells and mEpiSCs. Plating ratio of 4:1 (rhesus:mouse). n = 6, biological replicates. c, Growth curves of co-cultured (blue) and separately cultured (red) H9-hES cells and ORMES23 rhesus ES cells. Plating ratio of 1:1 (human:rhesus). n = 3, biological replicates. d, Growth curves of co-cultured (blue) and separately cultured (red) bovine ES cells and H9-hES cells. Plating ratio of 1:1 (cow:human). n = 3, biological replicates. e, Growth curves of co-cultured (blue) and separately cultured (red) bovine ES cells and mEpiSCs. Plating ratio of 4:1 (cow:mouse). n = 3, biological replicates. f, A schematic summary showing the hierarchy of ‘winner’ and ‘loser’ species during interspecies primed PSC competition. Animal silhouettes are from BioRender.com. P values determined by unpaired two-tailed t-test (a, b, d, e). All data are mean ± s.e.m.
In summary, we uncover a previously unrecognized mode of cell competition between primed PSCs of different species. We further show that interspecies primed PSC competition is contact-dependent, and that NF-κB activation, putatively downstream of P53 and MyD88, drives the elimination of loser cells. In addition, we find that inactivation of the MyD88, NF-κB or P53 pathway enhances human cell survival and chimerism in early mouse embryos. Apoptosis was recently recognized as an initial barrier of interspecies chimerism, and forced expression of anti-apoptotic factors including BCL2 and BMI1 improved human primed PSC chimerism in early mouse and pig embryos38–40. Our results provide mechanistic insights that link human cell death to interspecies cell competition during primed pluripotency. Our study establishes a platform to study cell competition mechanisms during early mammalian development, and, if combined with interspecies chimera-enabling PSC cultures5,12,23,35,41,42, may lead to successful interspecies organogenesis between evolutionarily distant species.
Online content
Any methods, additional references, Nature Research reporting summaries, source data, extended data, supplementary information, acknowledgements, peer review information; details of author contributions and competing interests; and statements of data and code availability are available at https://doi.org/10.1038/s41586-021-03273-0.
Methods
No statistical methods were used to predetermine sample size. The experiments were not randomized, and investigators were not blinded to allocation during experiments and outcome assessment.
Animals and ethical review
CD-1 (ICR) and C57BL/6NCrl mice were purchased from Charles River or Envigo (Harlen). Sprague Dawley (SD) rats were purchased from Envigo. NOD/SCID immunodeficient mice were purchased from Charles River (NOD.CB17–Prkdcscid/NcrCrl). Mice and rats were housed in 12-h light/12-h dark cycle at 22.1–22.3 °C and 33–44% humidity. All procedures related to animals were performed in accordance with the ethical guidelines of the University of Texas Southwestern Medical Center. The animal protocol was reviewed and approved by the UT Southwestern Institutional Animal Care and Use Committee (IACUC) (protocols 2018–102430 and 2018–102434). All experiments followed the 2016 Guidelines for Stem Cell Research and Clinical Translation released by the International Society for Stem Cell Research (ISSCR). All human–mouse ex vivo and in vivo interspecies chimeric experimental studies were reviewed and approved by UT Southwestern Stem Cell Oversight Committee (SCRO) (registration 14).
Derivation of rat EpiSCs
Progression of oestrous cycle and developmental stages of embryos were determined by preforming vaginal cytological smears. Copulation time was determined by the presence of sperm in the vaginal smear under a microscope. If present, it is designated as ‘E0.5’. E7.5 stage rat embryos were used for rat EpiSCs derivation. In brief, surgically isolated epiblasts were placed on mitotically inactivated mouse embryonic fibroblasts (MEFs) in chemically defined N2B27 medium supplemented with FGF2 (20 ng ml−1, Peprotech) and IWR1 (2.5 μM, Sigma-Aldrich)19. After 4 days in culture, epiblast outgrowths were passaged as small clumps using collagenase IV (Life Technologies) and replated onto newly prepared MEFs. Established rat EpiSCs were passaged every 3–4 days with TrypLE (Gibco) at a split ratio of 1:30.
Primed PSC culture
Human ES cell lines H1 (WA01) and H9 (WA09) were obtained from WiCell and authenticated by short tandem repeat (STR) profiling. HFF-hiPS cells, mouse EpiSCs, rhesus macaque ES cells, and bovine ES cells were generated as previously described5,19,36. Human primed PSCs were either cultured on plates coated with Matrigel (BD Biosciences) in mTeSR1 medium (StemCell Technologies) or on MEFs in NBFR medium, which contains DMEM/F12 (Invitrogen) and Neurobasal medium (Invitrogen) mixed at 1:1 ratio, 0.5× N2 supplement (Invitrogen), 0.5× B27 supplement (Invitrogen), 2 mM GlutaMax (Gibco); 1× nonessential amino acids (NEAA, Gibco), 0.1 mM 2-mercaptoethanol (Sigma-Aldrich), 20 ng ml−1 FGF2, 2.5 μM IWR1, and 1 mg ml−1 BSA (low fatty acid, MP Biomedicals). Mouse, rat, rhesus and bovine primed PSCs were all cultured on MEFs in NBFR medium. Primed PSCs cultured in NBFR medium were passaged using TrypLE (human, rhesus and bovine) at 1:10 split ratio every 4–5 days, and 1:30 split ratio (mouse and rat) every 3–4 days. Human primed PSCs cultured in mTeSR1 medium on Matrigel were passaged every five days using Versene (Gibco) at 1:10 split ratio.
Naive PSC culture
For human naive or naive-like PSCs, we adopted four different culture conditions: (1) 5iLAF medium20, which contains DMEM/F12 and Neurobasal medium mixed at a 1:1 ratio, 0.5× N2 supplement, 0.5× B27 supplement, 8 ng ml−1 bFGF, 1× NEAA, 2 mM GlutaMAX, 0.1 mM 2-mercaptoethanol, 50 μg ml−1 BSA, 1 μM PD0325901 (Stemgent), 0.5 or 1 μM IM-12 (Enzo), 0.5 μM SB590885 (Tocris), 1 μM WH-4–023 (A Chemtek), 10 μM Y-27632 (Selleckchem), 20 ng ml−1 activin A (Peprotech), 20 ng ml−1 recombinant human LIF (rhLIF, Peprotech) and 0.5% knockout serum replacement (KSR, Invitrogen). (2) PXGL medium21, which contains DMEM/F12 and Neurobasal medium mixed at 1:1 ratio, 0.5× N2 supplement, 0.5× B27 supplement, 2 mM GlutaMAX, 1× NEAA, 10 ng ml−1 rhLIF, 1 μM CHIR99021 (Selleckchem), 2 μM IWR1 (OR XAV939), 2 μM Gö6983 (Tocris). (3) NHSM medium22, which contains KnockOut DMEM (Invitrogen), 2 mM GlutaMax, 1× NEAA, 0.1 mM 2-mercaptoethanol, 10 mg ml−1 AlbuMax-I (Invitrogen), 1× N2 supplement, 50 μg ml−1 l-ascorbic acid 2-phosphate (Sigma-Aldrich), 20 ng ml−1 rhLIF, 20 ng ml−1 human LR3-IGF1 (Peprotech), 8 ng ml−1 FGF2, 2 ng ml−1 TGFβ1 (Peprotech), 3 μM CHIR99021, 1 μM PD0325901, 5 μM SB203580 (Selleckchem), 5 μM SP600125 (Selleckchem), 5 μM Y27632 and 0.4 μM LDN193189 (Selleckchem). (4) LCDM medium23, which contains DMEM/F12 and Neurobasal medium mixed at 1:1 ratio, 0.5× N2 supplement, 0.5× B27 supplement, 2 mM GlutaMAX, 1× NEAA, 0.1 mM 2-mercaptoethanol, 5 mg ml−1 BSA (optional) or 5% KSR (optional), 10 ng ml−1 rhLIF, 5 μM CHIR9902, 2 μM (S)-(+)-dimethindene maleate (Tocris), 2 μM minocycline hydrochloride (Santa Cruz Biotechnology).
A mouse ES cell line derived from a C57BL/6J blastocyst19 and J1 mouse ES cells purchased from ATCC were used in this study, both of which were cultured in 2iL medium on MEFs and adapted to human naive or naive-like culture conditions for more than five passages before co-culture with human naive PSCs. 2iL medium contains DMEM/F12 and Neurobasal medium mixed at 1:1 ratio, 0.5× N2 supplement, 0.5× B27 supplement, 2 mM GlutaMAX, 1× NEAA, 0.1 mM 2-mercaptoethanol, 10 ng ml−1 rhLIF, 3 μM CHIR 99021 and 1 μM PD0325901.
A rat ES cell line (DAC8) was generated as previously reported43. Rat ES cells were cultured on MEFs coated plates in rat ES cell medium, which contains DMEM/F12 and Neurobasal medium mixed at 1:1 ratio, 0.5× N2 supplement, 0.5× B27 supplement, 2 mM GlutaMAX, 1× NEAA, 0.1 mM 2-mercaptoethanol, 10 ng ml−1 rhLIF, 1.5 μM CHIR 99021 and 1 μM PD0325901. Rat ES cells were passaged every 4–5 days at a split ratio of 1:10.
Generation of fluorescently labelled PSCs
We used pCAG-IP-mKO and pCAG-IP-eGFP to label PSCs. In brief, 1–2 μg of pCAG-IP-mKO/eGFP plasmids were transfected into 1 × 10⁶–2 × 10⁶ dissociated PSCs using an Amaxa 4D-nucleofector or an electroporator (NEPA21, Nepa Gene) following the protocol recommended by the manufacturer. Then, 0.5–1.0 μg ml−1 of puromycin (Invitrogen) was added to the culture 2–3 days after transfection. Drug-resistant colonies were manually picked between 7 and 14 days and further expanded clonally.
Interspecies PSC co-culture
PSCs from different species were seeded onto MEF-coated plates and either cultured separately or mixed at different ratios for co-cultures. The seeding ratio and density were empirically tested and decided on the basis of cell growth rate. For most cell competition assays between human–mouse, human–rat, rhesus–mouse, rhesus–rat, bovine–mouse and bovine–rat PSCs, cells were seeded at a 4:1 ratio at a density of 1.25 × 10⁴ cells cm−2. For human–mouse co-culture experiments, different ratios and/or densities were also tested. For human–rhesus, human–bovine, and rhesus–bovine PSC co-cultures, cells were seeded at 1:1 ratio at 2 × 10⁴ cells cm−2. For mouse–rat PSC co-culture, cells were seeded at 1:1 ratio at 0.5 × 10⁴ cells cm−2. For primed PSC co-culture experiments, PSCs of all species were cultured in NBFR medium on MEFs. For naive PSC co-culture experiments, human and mouse PSCs were cultured in 5iLAF, PXGL, NHSM or LCDM medium on MEFs. For differentiation co-culture, NBFR-cultured human and mouse PSCs were switched to differentiation medium containing DMEM/F12 supplemented with 10% fetal bovine serum (FBS). At each of the indicated time points, cell concentration was manually counted and calculated, and the percentages of each cell line were determined using the LSR II Flow Cytometer (BD Bioscience). Total cell numbers (tN) for each species in co-cultures or separate cultures were determined by multiplying total cell volume (V) with cell concentration (CC) and percentage (P). tN = V × CC × P. Cell density (cells cm−2) was calculated by dividing the total cell number by the surface area.
Transwell culture and conditioned medium assay
For transwell culture experiments, Millipore Transwell 0.4 μm PET hanging inserts (Millicell, MCH12H48) were used by placing them into 12-well plates. Coverslips were placed into both the upper insert and the bottom well. For transwell co-culture experiments, mEpiSCs and hES cells were seeded on the top insert and bottom well, respectively. For contact co-culture experiments in transwell, both mEpiSCs and hES cells were seeded on the top insert without coverslips. Conditioned medium was collected from day-1–5 co-cultures and separate cultures, filtered through a cell strainer (BD Falcon Cell Strainer, 40 μm) and centrifuged at 200g for 10 min at 4 °C to remove cell debris, then used to culture H9-hES cells. For the concentrated conditioned medium, a total of 100 ml was collected from day-1–5 co-cultures or separate cultures, and concentrated to a final volume of approximately 10 ml using Amicon ultra centrifugal filter with 3-kDa molecular mass cutoff (Millipore, UFC900308).
Time-lapse imaging and analysis
Time-lapse imaging was performed with a Nikon A1R confocal microscope at 37 °C and 5% CO2 using a Nikon Biostation CT. Cells were imaged every 5 min for at least 12 h using a 10×, 20× or 60× (0.4 NA) objective. For time-lapse imaging of contactless co-culture on chamber slides (μ-Slide 2 Well Co-Culture, ibidi), H9-hES cells were seeded in the inner well, and mEpiSCs in the outer wells. After cell attachment, unattached cells and medium were aspirated. Each major well was then overlaid with 600 μl cell-free medium followed by time-lapse imaging. For time-lapse imaging of co-cultures using micropatterned coverslips, the photoresist template was fabricated by negative photolithography as previously described44. The chrome mask was manufactured by the University of Texas at Dallas, and the KMPR 1050 photoresist (Microchem) was used following the manufacturers’ protocol. The silicon (PDMS) mould was fabricated from Sylgard 184 Silicon Elastomer (Dow Corning). The layered agarose technique is a simple process for cell patterning on glass45. However, since the agarose layer quickly detaches from the coverslip in cell culture conditions (37 °C, 5% CO2), we first coated the glass coverslip with an ultra-thin layer of polystyrene dissolved in chloroform (0.2 mg ml−1), and then exposed the coverslips to UV light (tissue culture hood) for 1 h to graft the polystyrene layer and sterilize the coverslips. Finally, the PDMS stamps were sealed to the treated coverslip with feature-side down. A solution of 1% agarose in distilled water (10 mg ml−1) was heated to 100 °C until the solution was crystal clear. Subsequently, 600 μl of the 1% agarose solution was mixed with 400 μl of 100% ethanol, and a drop of the hot agarose/ethanol solution was perfused through the gaps formed between the stamp and the coverslip. After several hours, the PDMS mould was carefully removed from the coverslip with fine-tipped forceps. Before plating the cells in normal culture medium, the agarose-coated coverslips were incubated with fibronectin in PBS (50 μg ml−1) for 1 h at 37 °C and rinsed twice with PBS. After time-lapse imaging, ImageJ (NIH, 64-bit Java 1.8.0_172) was used to project the z-stacks in 2D, using maximum intensity projection and the resulting 2D images were assembled into a time-lapse video.
CRISPR knockout
We used the online software (MIT CRISPR Design Tool: http://crispr.mit.edu) to design all single guide RNAs (sgRNAs) used in this study. The sequences of sgRNAs are included in Supplementary Table 3. sgRNAs were cloned into the pSpCas9(BB)-2A-eGFP (Addgene, PX458) plasmid by ligating annealed oligonucleotides with BbsI-digested vector. The plasmid carrying the specific sgRNA was then transfected into HFF-hiPS cells or DAC8 rat ES cells using an electroporator (NEPA2, Nepa Gene 1). eGFP+ cells were collected by FACS at 48 h after transfection and plated. Single clones were picked and expanded. Homozygous knockout clones were confirmed by Sanger sequencing and western blotting.
Plasmids
The lentiviral construct for TP53 shRNA (shp53 pLKO.1 puro) was obtained from Addgene (plasmid 19119)46. pSpCas9(BB)-2A-eGFP (PX458) plasmid was purchased from Addgene (plasmid 48138). pCAG-IP-mKO, pCAG-IP-eGFP and pCAG-IP-Bcl2 plasmids were obtained from T. Hishida.
Mouse embryo collection
CD-1 female mice (2–6 months old) in natural oestrous cycles were mated with CD-1 male mice (2–6 months old). Blastocysts were collected at E3.5 (the presence of a virginal plug was defined as E0.5) in KSOM-Hepes5 by flushing out the uterine horns. Blastocysts were cultured in defined modified medium (mKSOMaa)5 in a humidified atmosphere containing 5% CO2 and 20% O2 at 37 °C until hiPS cell injections. The embryos that had obvious blastocoel at E3.5 were defined as blastocysts.
Human–mouse ex vivo chimera formation
Microinjection of human iPS cells into mouse blastocysts was performed as previously described5 with some modification. In brief, cells pretreated with 10 μM Y-27632 were dissociated into single cells using Accutase (Sigma-Aldrich) and centrifuged at 200g at room temperature for 3 min. After removal of the supernatant, cells were resuspended in culture medium at a density of 2 × 10⁵–6 × 10⁵ cells ml−1 and placed on ice for 20–30 min before injection. Single-cell suspensions were added to a 40 μl droplet of KSOM-Hepes containing the blastocysts and placed on an inverted microscope (Nikon) fitted with micromanipulators (Narishige). Individual cells were collected into a micropipette with 20 μm internal diameter (ID) and the Piezo Micro Manipulator (Prime Tech) was used to create a hole in the zona pellucida and trophectoderm layer of mouse blastocysts. Then, 10–15 cells were introduced into the blastocoel. After microinjection, the blastocysts were cultured ex vivo. To culture mouse blastocysts injected with human iPS cells beyond the implantation stages, we followed a previously published protocol34. In brief, injected mouse blastocysts were placed in ibiTreat μ-plate wells (eight-well, ibidi, 80826) containing IVC1 medium. This is designated as day 0 of the ex vivo culture. After all of the embryos attached to the bottom of the well (between days 2 and 3), IVC1 medium was replaced with equilibrated IVC2 medium. On approximately days 4 and 5, an early egg cylinder emerged from the inner cell mass clumps, and after further culture (approximately day 6) the proamniotic cavity became visible. The embryos were analysed for eGFP and AC3 expression by live imaging and/or immunofluorescence staining.
Microinjection of rat ES cells to mouse blastocysts
Single-cell suspensions of rat ES cells were added to a 40 μl drop of KSOM-Hepes containing the blastocysts to be injected. Individual cells were collected into a 20 μm ID of micropipette. Ten cells were introduced into the blastocoel. Groups of 10–12 blastocysts were manipulated simultaneously and each session was limited to 30 min. After microinjection, the blastocysts were cultured in mKSOMaa for at least 1 h until the embryo transfer.
Mouse embryo transfer
CD-1 female mice used as surrogates (2–4 months old) were mated with vasectomized CD-1 male mice (3–12 months old) to induce pseudopregnancy. Approximately 10–15 injected blastocysts were transferred to each uterine horn of 2.5-days post coitum pseudo-pregnant females. Embryos were dissected at the indicated time points and used for downstream analysis. To test the chimera competency of J1 mouse ES cells cultured in 5iLAF medium, C57BL/6NCrl blastocysts collected from 3–4-month-old female mice were used for microinjection.
Genomic PCR
Genomic PCR was carried out for the detection of human-specific DNA in mouse embryos by DNA fingerprinting using primers for TPA25-Alu. Genomic DNA of E8–E9 or E10.5 mouse embryos and HFF-hiPS cells, DAC8 rat ES cells (used as a positive control) were extracted using Wizard SV genomic DNA purification system (Promega), and diluted to 30 ng μl−1 as PCR templates. Genomic PCRs were performed using Hot Start Taq 2x Master Mix (NEB). The PCR products were examined by 2% agarose gel electrophoresis. Bands of expected size were cut and purified using Gel Extraction kit (Sigma-Aldrich) and then sent for Sanger sequencing. Primer sequences are provided in Supplementary Table 3.
Quantitative genomic PCR
Quantitative PCR (qPCR) to quantify the rat ES cell contribution in rat–mouse chimeric embryos was performed using SYBR Green PCR Master Mix (Applied Biosystems), and total genomic DNAs were isolated from E10.5 chimera, mouse ES cells and DAC8 rat ES cells. The data were analysed using the ΔΔCt method, and first normalized to the values of the mouse and rat common mitochondrial DNA primers. A rat-specific mitochondrial DNA primer was used to detect rat cells. The levels of chimerism were determined on the basis of the values of genomic DNA generated from serial dilutions of rat–mouse cells. The primers used for genomic qPCR are listed in Supplementary Table 3.
Immunofluorescence
Cells were fixed in 4% paraformaldehyde (PFA) for 10 min at room temperature, permeabilized with 0.1% Triton X-100 for 15 min, and blocked with 10% BSA (Sigma-Aldrich) and 0.1% Triton X-100 for 1 h. Staining with primary antibodies (Supplementary Table 4) was performed overnight at 4 °C in 1% BSA and 0.1% Triton X-100. After three washes in PBS, secondary antibodies (Supplementary Table 5) and DAPI were applied for 1 h. Coverslips were then mounted on glass slides using Vectashield (Vector Labs). The images of stained slides were taken by Revolve (ECHO) or Nikon A1R confocal microscope. All quantitative analysis of immunostained sections were carried out using Nikon NIS-Elements AR. To determine the percentage of cells that express AC3, we counted all AC3+ cells in ten randomly selected fields (318.2 × 318.2 μm2 each) from three independent immunostaining experiments per sample and calculated the percentage of marker-positive cells out of the total DAPI and eGFP+ or mKO+ cells.
Immunohistochemistry analysis of mouse embryos
E8–E9 embryos were dissected and fixed for 45 min in 4% PFA at 4 °C, washed three times in PBS for 10 min each and submerged first in 30% sucrose (Sigma-Aldrich) overnight at 4 °C until the embryos sank to the bottom of the tube. The day after, samples were subjected to increasing gradient of OCT concentration in sucrose and PBS followed by embedding in OCT on liquid nitrogen and stored at −80 °C until further processing. Frozen embryo blocks were cut on a cryostat (Leica CM1950) into 12-μm-thick sections, which were placed on superfrost plus microscope slides (Thermo Scientific) for immunostaining. The slides were washed once with PBS. After permeabilization with 0.1% Triton X-100 in PBS for 10 min, slides were again washed three times with PBS for 2 min each and blocked with 10% normal donkey or goat serum in PBS in humidified chamber for 1 h at room temperature. Slides were then incubated with indicated primary antibodies (Supplementary Table 4) overnight at 4 °C, secondary antibodies (Supplementary Table 5) for 2 h at 37 °C, and finally DAPI. All images were captured on a Nikon NIS-Elements A1R.
Flow cytometry
For flow cytometry analysis, cells were dissociated using Accutase and fixed in 4% PFA in culture medium for 10 min. Permeabilization was carried out using 0.1% Triton X-100 in PBS, and cells were blocked using 0.5% BSA and 2% normal FBS in PBS. Cells were incubated with primary antibodies (Supplementary Table 4) for 1 h at room temperature. After washing, secondary antibodies (Supplementary Table 5) were applied. Cells were incubated with secondary antibodies for 30 min at 4 °C and washed in PBS before flow cytometry analysis. For annexin V staining, we followed the instructions recommended by the manufacturer (Invitrogen, V13242). Flow cytometry was performed using a FACScalibur system (BD) and a BD LSRII (BD) and analysed using BD FacsDIVA (v9.0) and FlowJo (10.5.3), respectively. Gating strategies were shown in Extended Data Fig. 1.
Western blotting
Both co-cultured and separately cultured cells were sorted out and collected on the basis of fluorescent labelling using fluorescence activated cell sorting (FACS). Cells were collected by centrifugation and lysed in RIPA lysis buffer (150 mM NaCl, 1% Nonidet P-40, 0.5% sodium deoxycholate, 0.1% SDS, 50 mM pH 8.0 Tris-HCl) supplemented with 1 mM phenylmethylsulfonyl fluoride (PMSF) and 1× Halt complete protease inhibitor cocktail (Thermo Fisher Scientific). Cell lysates were sonicated for 5 min (Bioruptor UCD-200, Diagenode) and cleared by centrifugation at 14,000g for 10 min at 4 °C (Hermle benchmark Z 216 MK). Cleared lysate was quantified using PIERCE BCA protein assay kit (Thermo Fisher Scientific) per manufacturer’s instructions and absorbance was measured at 562 nm using a SpectraMax iD3 plate reader (Molecular Devices). Protein concentrations were normalized to the lowest sample. Samples were denatured with Laemmli buffer (0.05 M Tris-HCl at pH 6.8, 1% SDS, 10% glycerol, 0.1% 2-mercaptoethanol) by boiling for 10 min. The equal amounts of protein samples were resolved using Criterion TGX pre-cast gels (BioRad) or 10% PAGE-SDS gels followed by transfer to PVDF membranes. Transfer was visualized using Ponceau S staining solution (0.5% Ponceau S, 1% acetic acid). Membrane was incubated with the corresponding primary antibodies (Supplementary Table 4) after blocking for 1 h with 5% BSA and 1% Tween-20 in TBS. Immunoreactive bands were visualized using HRP conjugated secondary antibodies (Supplementary Table 5) incubated with chemiluminescence substrate (Pierce ECL western substrate, Thermo Fisher Scientific) and exposed to X-ray film.
RNA isolation and quantitative RT–PCR analysis
Total RNAs were extracted using RNeasy Mini Kit (Qiagen). cDNA was synthesized using Superscript III reverse transcriptase (Invitrogen), and SYBR Green Master Mix (Qiagen) was used for qPCR reaction. Quantitative reverse transcription PCR (qRT–PCR) was carried out using CFX384 system (BIO-RAD). Reactions were run in triplicate and expression level of each gene was normalized to the geometric mean of Gapdh as a housekeeping gene and analysed by using the ΔΔCt method by Bio-Rad Maestro 1.0. The qRT–PCR primer sequences of each gene are listed in Supplementary Table 3.
RNA-sequencing
Both co-cultured and separately cultured cells were sorted out and collected on the basis of fluorescent labelling using FACS at each of the indicated time points. RNA extraction of cells was performed using a RNeasy using DNase treatment (Qiagen). RNA was analysed using a 2100 Bioanalyzer (Aglient Technologies). RNA-seq reads were mapped to the mouse genome and human genome using HISAT2 (version 2.1.0)47 with parameters ‘-k 1 -p 4 -q --no-unal --dta’. The gene expression levels were then calculated using StringTie (v1.3.3b)48 with parameters ‘-t -e -B -A’. A twofold variance in expression levels, a P value less than 0.05 and an adjusted P value less than 0.1 were used as cutoffs to define differentially expressed genes. The P value and adjusted P value were calculated using DESeq249. Gene Ontology analysis of differentially expressed genes were analysed in DAVID (https://david-d.ncifcrf.gov/home.jsp).
Cell cycle analysis
For cell cycle analysis, cells were dissociated into single cells by treatment with TrypLE for 10 min and separated by magnetic-activated cell sorting (MACS) following manufacturer’s protocol: MEFs were removed first using feeder removal microbeads (Miltenyi Biotec, 130–095-531). Anti-SSEA-1 (CD15) microbeads (Miltenyi Biotec, 130–094-530) and anti-TRA-1–60 MicroBeads (Miltenyi Biotec, 130–095-816) were used to enrich the rodent and primate PSCs respectively. Then cells were fixed in 70% ethanol overnight. After washing with PBS, the samples were incubated for 30 min with Tali cell cycle kit (Invitrogen, A10798) in PBS and their DNA content was analysed by flow cytometer (BD FACSAria) with 20,000 events per determination. Cell cycle profiles were generated using Flowjo software (Tree Star).
Teratoma formation
Cells were dissociated using Accutase for 5 min at 37 °C and resuspended in 30% Matrigel in DMEM/F12, and then injected subcutaneously into NOD/SCID immunodeficient mice (female, 4–8 weeks). Teratomas were isolated after 8 weeks and fixed in 4% PFA. After paraffin embedding and sectioning, sections were stained with haematoxylin and eosin (H&E).
Statistics
Data were presented as mean ± s.e.m. from at least three independent experiments. Differences between groups were evaluated by Student’s t-test (two-sided) or one-way ANOVA with Tukey or LSD test, and considered to be statistically significant if P < 0.05. Graphic analyses were done using GraphPad Prism version 7.0 and 8.0 (GraphPad Software). Statistical analyses were done using the software SPSS 19.0 (SPSS) and Microsoft Excel (Microsoft 365).
Reporting summary
Further information on research design is available in the Nature Research Reporting Summary linked to this paper.
Extended Data
Extended Data Fig. 1 |. Human–mouse PSC co-culture.
a, Representative brightfield images of H9-hES cells (passage 51) and mEpiSCs (passage 30), in the F/R1 culture condition. Scale bar, 200 μm. b, Representative immunofluorescence images of mEpiSCs (passage 32), H9-hES cells (passage 49), H1-hES cells (passage 51) and HFF-hiPS cells (passage 21), in the F/R1 culture condition, expressing pluripotency transcription factors SOX2 (green) and OCT4 (red). Blue, DAPI. Scale bars, 200 μm. c, Long-term F/R1-cultured H9-hES cells (passage 49) and HFF-hiPS cells (passage 23) exhibited normal karyotypes. d, Flow cytometry analysis of cell cycle phase distribution of H9-hES cells and mEpiSCs after 3 days in separate and co-cultures. n = 3, biological replicates. Data are mean ± s.e.m. e, H9-hES cells maintained the expression of pluripotency markers OCT4, SOX2 and TRA-1–60 after 3 days of separate and co-cultures. f, mEpiSCs maintained the expression of pluripotency markers CD24, SOX2, SSEA1 and OCT4 after 3 days of separate and co-cultures. Images in a and b are representative of three independent experiments.
Extended Data Fig. 2 |. Human–mouse primed PSC competition.
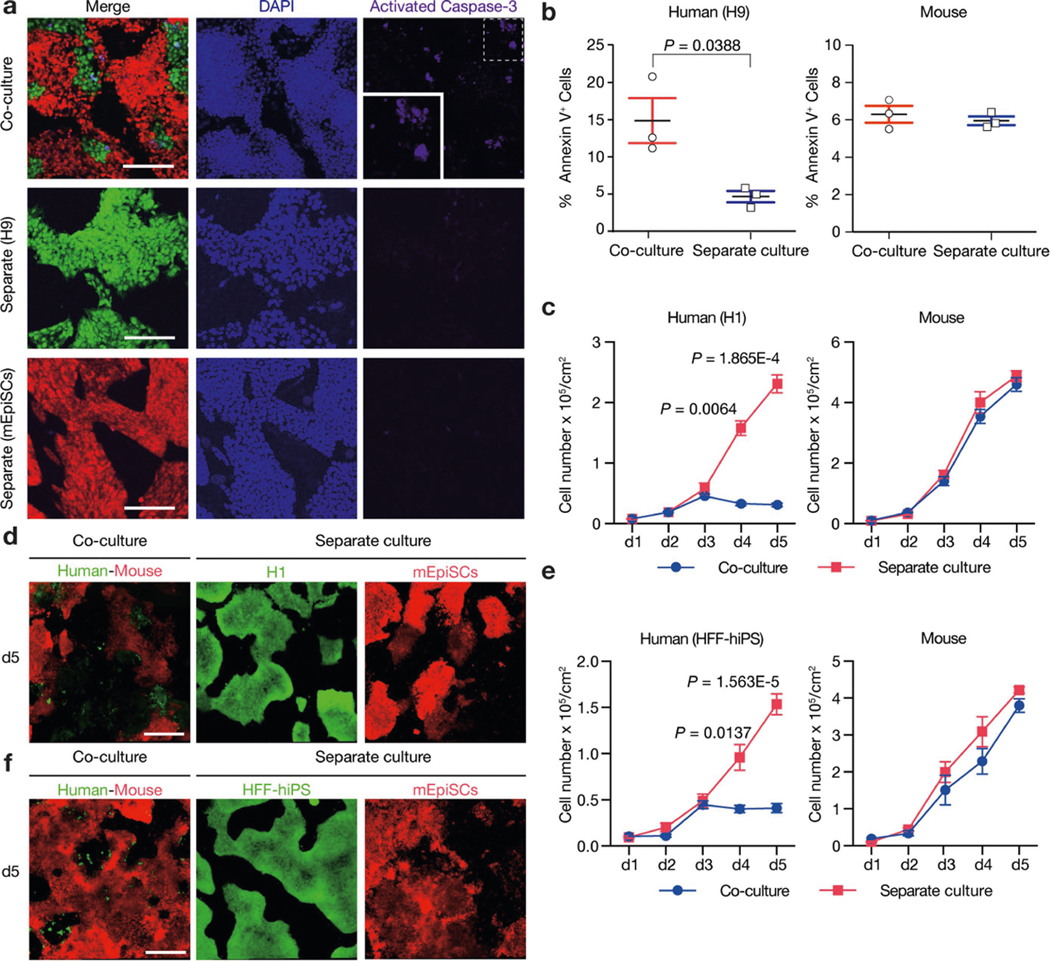
a, Representative immunofluorescence images showing AC3 staining of day-3 co-cultured and separately cultured H9-hES cells (green) and mEpiSCs (red). Blue, DAPI; purple, AC3. Inset, a higher-magnification image of boxed area with dotted line. Scale bars, 200 μm. b, Dot plots showing the percentages of annexin V+ cells in day-3 co-cultured and separately cultured H9-hES cells (left) and mEpiSCs (right). n = 3, biological replicates. c, Growth curves of co-cultured (blue) and separately cultured (red) H1-hES cells (left) and mEpiSCs (right). Plating ratio of 4:1 (human:mouse), n = 3, biological replicates. d, Representative fluorescence images of day-5 co-cultured and separately cultured H1-hES cells (green) and mEpiSCs (red). Scale bar, 400 μm. e, Growth curves of co-cultured (blue) and separately cultured (red) HFF-hiPS cells and mEpiSCs. Plating ratio of 4:1 (human:mouse), n = 5, biological replicates. f, Representative fluorescence images of day-5 co-cultured and separately cultured HFF-hiPS cells (green) and mEpiSCs (red). Scale bar, 400 μm. Experiments in a, d and f were repeated independently three times with similar results. P values determined by unpaired two-tailed t-test (b, c, e). All data are mean ± s.e.m.
Extended Data Fig. 3 |. Lack of cell competition in human-mouse naive PSC and differentiation co-cultures.
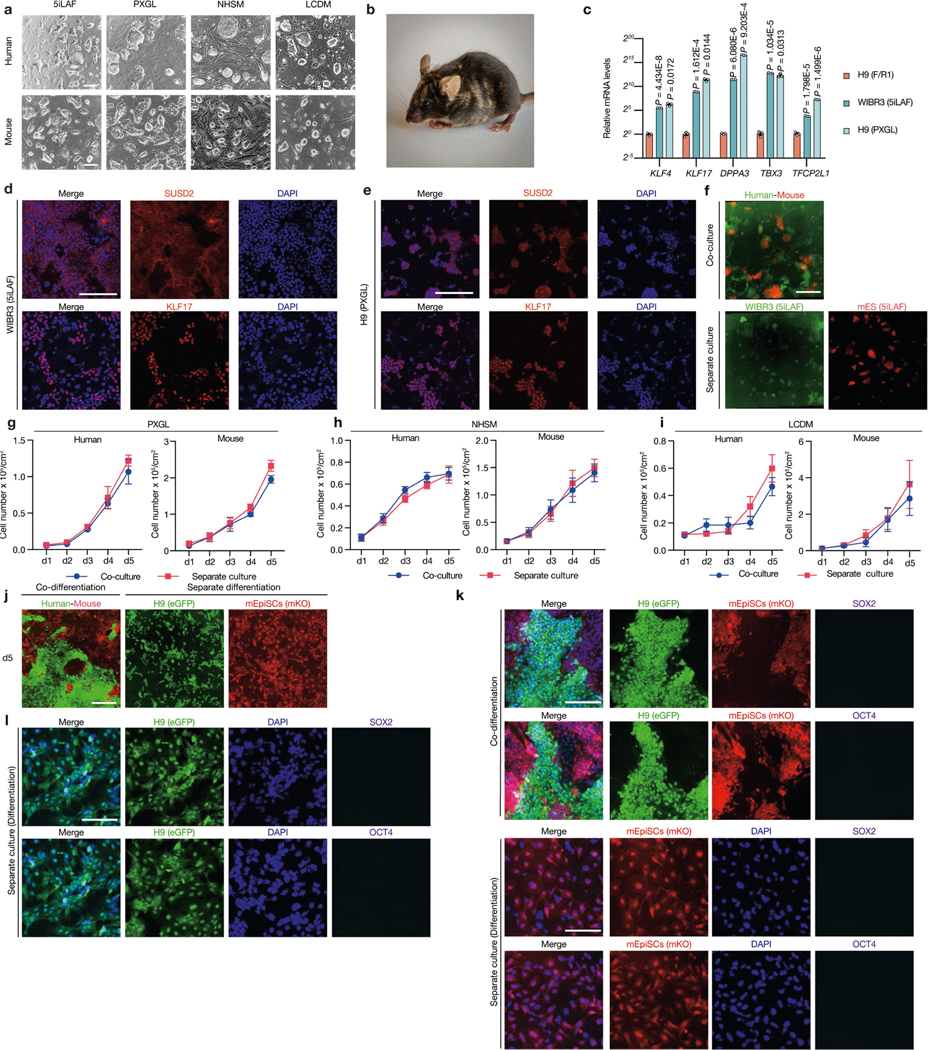
a, Representative brightfield images showing typical colony morphologies of human and mouse PSCs cultured in naive or naive-like (5iLAF, PXGL, NHSM and LCDM) culture conditions. Scale bars, 200 μm. b, A coat-colour chimera generated by J1 mouse ES cells, cultured in 5iLAF medium. c, RT–qPCR analysis of relative expression levels of selected naive pluripotency markers in WIBR3 (5iLAF) and H9 (PXGL) hES cells compared to F/R1-cultured H9-hES cells. n = 3, biological replicates. P values determined by unpaired two-tailed t-test. d, e, Representative immunofluorescence images of SUSD2 and KLF17 in hES cells cultured in 5iLAF (WIRB3) and PXGL (H9) medium. Scale bars, 200 μm. f, Representative fluorescence images of day-5 co-cultured and separately cultured WIBR3 hES cells (green) and J1 mouse ES cells (red) cultured in 5iLAF medium. Scale bar, 400 μm. g, Growth curves of co-cultured (blue) and separately cultured (red) H9-hES cells and J1 mouse ES cells in PXGL medium. n = 3, biological replicates. h, Growth curves of co-cultured (blue) and separately cultured (red) H9-hES cells and mouse ES cells in NHSM medium. n = 3, biological replicates. i, Growth curves of co-cultured (blue) and separately cultured (red) human iPS-EPS (extended pluripotent stem) cells and mouse EPS cells in LCDM medium. n = 3, biological replicates. j, Representative fluorescence images of day-5 co-cultured and separately cultured H9-hES cells (green) and mEpiSCs (red) under a differentiation culture condition. Scale bar, 400 μm. k, l, Representative immunofluorescence images showing H9-hES cells and mEpiSCs under the differentiation culture condition lost expression of pluripotency transcription factors SOX2 (purple) and OCT4 (purple) on day 5. Blue, DAPI. Scale bars, 200 μm. Images in a, d–f and j–l are representative of three independent experiments. All data are mean ± s.e.m.
Extended Data Fig. 4 |. Human–mouse primed PSC competition depends on cell–cell contact.
a, Growth curves of H9-hES cells (left) and mEpiSCs (right) plated at different ratios (mouse:human = 1:1, 1:2, 1:4 and 1:8) in separate and co-cultures. The seeding cell number of H9-hES cells was fixed at 1 × 104 cm−2, whereas seeding cell numbers of mEpiSCs were adjusted according to different seeding ratios. n = 3, biological replicates. b, Growth curves of H9-hES cells (left) and mEpiSCs (right) plated at high and low densities (high, 1.25 × 104 cm−2; and low, 0.625 × 104 cm−2; 4:1 ratio) in separate and co-cultures. n = 3, biological replicates. c, Quantification of AC3+ cells in day-3 co-cultured and separately cultured H9-hES cells (blue) and mEpiSCs (red), plating ratio of 1:1 (human:mouse), n = 10, randomly selected 318.2 × 318.2 μm2 fields examined over three independent experiments. d, Representative fluorescence images of day-5 co-cultured and separately cultured H9-hES cells (green) and mEpiSCs (red) in transwell. Scale bar, 400 μm. Images are representative of three independent experiments. e, Live H9-hES cells (cell numbers per cm2) at day 5 after treatments with different dosages (50%, 33% and 10%) of conditioned medium (CM) collected from co-cultures of H9-hES cells and mEpiSCs (cCM), or separate cultures of mEpiSCs (mCM). n = 3, biological replicates. P values (co-cultures compared with separate cultures), unpaired two-tailed t-test (a, b), or one-way ANOVA with Tukey’s multiple comparison (c). All data are mean ± s.e.m.
Extended Data Fig. 5 |. Overcoming human–mouse primed PSC competition by blocking human cell apoptosis.
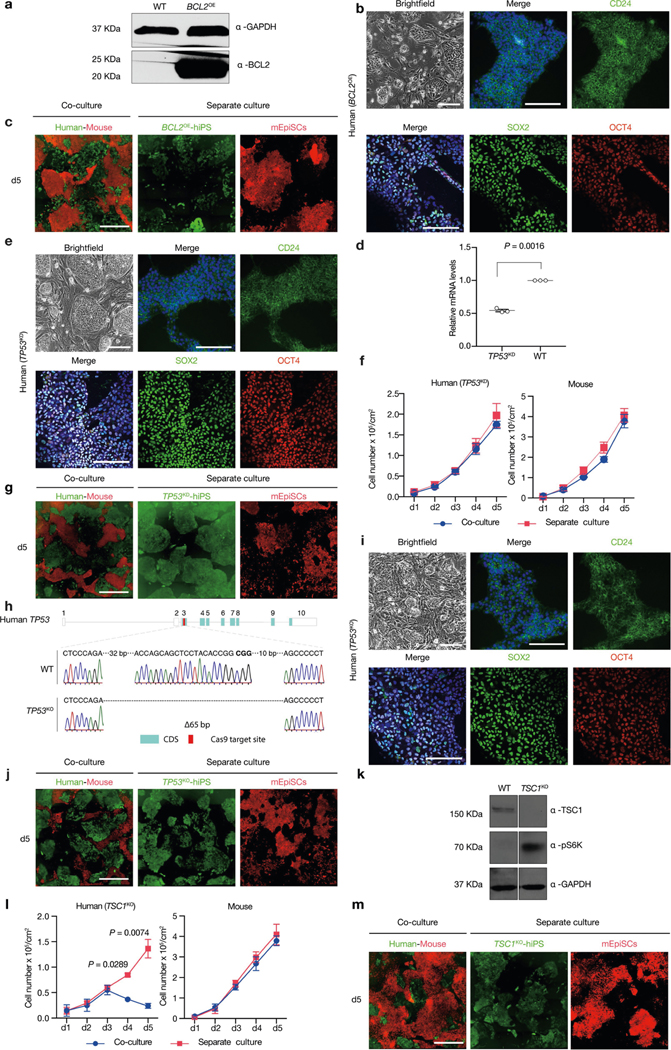
a, Western blot analysis confirmed the overexpression of BCL-2 in BCL2OE hiPS cells. GAPDH was used as a loading control. b, Representative brightfield and immunofluorescence images showing long-term cultured BCL2OE hiPS cells expressed core (SOX2, green; OCT4, red) and primed (CD24, green) pluripotency markers. Blue, DAPI. Scale bars, 200 μm. c, Representative fluorescence images of day-5 co-cultured and separately cultured BCL2OE hiPS cells (green) and mEpiSCs (red). Scale bar, 400 μm. d, Dot plot showing the RT–qPCR results confirming knockdown of TP53 transcript in TP53KD hiPS cells. n = 3, biological replicates. e, Representative brightfield and immunofluorescence images showing longterm cultured TP53KD hiPS cells expressed core (SOX2, green; OCT4, red) and primed (CD24, green) pluripotency markers. Blue, DAPI. Scale bars, 200 μm. f, Growth curves of co-cultured (blue) and separately cultured (red) TP53KD hiPS cells and mEpiSCs. n = 3, biological replicates. g, Representative fluorescence images of day-5 co-cultured and separately cultured TP53KD hiPS cells (green) and mEpiSCs (red). Scale bar, 400 μm. h, Sanger sequencing result showing out-of-frame homozygous 65-bp deletion in TP53KO hiPS cells. Bold, PAM sequence. i, Representative brightfield and immunofluorescence images showing long-term cultured TP53KO hiPS cells expressed core (SOX2, green; OCT4, red) and primed (CD24, green) pluripotency markers. Blue, DAPI. Scale bars, 200 μm. j, Representative fluorescence images of day-5 co-cultured and separately cultured TP53KO hiPS cells (green) and mEpiSCs (red). Scale bar, 400 μm. k, Western blot analysis confirmed the lack of TSC1 protein expression and activation of mTOR pathway (S6K phosphorylation, pS6K) in TSC1KO hiPS cells. GAPDH was used as a loading control. l, Growth curves of co-cultured (blue) and separately cultured (red) TSC1KO hiPS cells and mEpiSCs. n = 3, biological replicates. m, Representative fluorescence images of day-5 cocultured and separately cultured TSC1KO hiPS cells (green) and mEpiSCs (red). Scale bar, 400 μm. Experiments in a and k were repeated independently three times with similar results. For gel source data, see Supplementary Fig. 1. Images in b, c, e, g, i, j and m are representative of three independent experiments. P values determined by unpaired two-tailed t-test (d, l).
Extended Data Fig. 6 |. Comparative RNA-seq analysis between co-cultured and separately cultured H9-hES cells.
a, b, KEGG pathways enriched in all (days 1, 2 and 3 combined) (a) and common (commonly shared among days 1, 2 and 3) (b) co-URGs in H9-hES cells. c–e, Volcano plots showing significantly upregulated (red) and downregulated (blue) genes in co-cultured versus separately cultured H9-hES cells on days 1 (c), 2 (d) and 3 (e). NF-κB pathway-related genes are highlighted in the volcano plots. P values determined by a modified one-sided Fisher’s exact test (EASE score) (a, b) or Wald test (c–e).
Extended Data Fig. 7 |. Genetic inactivation of P65 and MYD88 in human PSCs overcome human–mouse primed PSC competition.
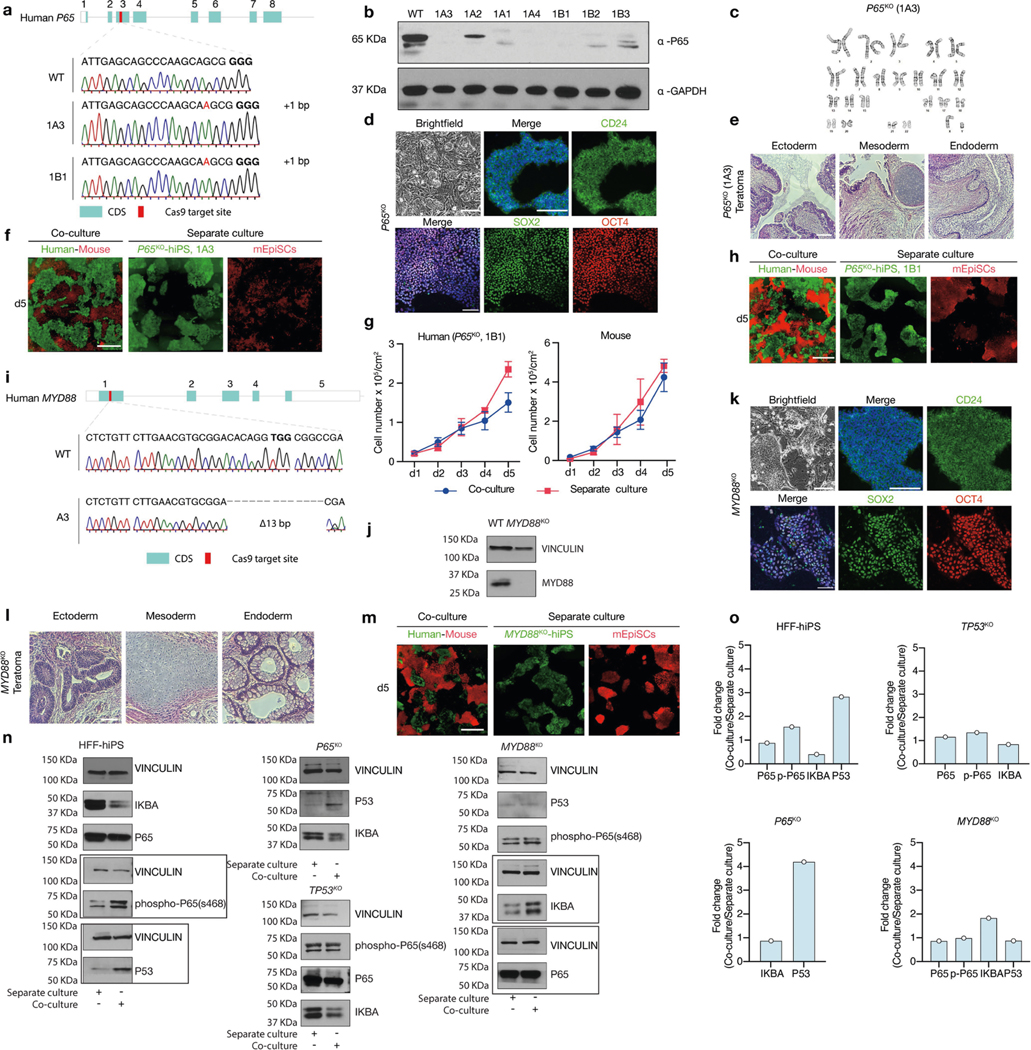
a, Sanger sequencing results showing out-of-frame homozygous 1-bp insertion in two independent P65KO hiPS cell clones: 1A3 and 1B1. Bold, PAM sequence. b, Western blot analysis confirmed the lack of P65 protein expression in several independent P65KO hiPS cell clones. GAPDH was used as a loading control. c, P65KO hiPS cells (clone 1A3) maintained normal karyotype after long-term passaging (passage 10). d, Representative brightfield and immunofluorescence images showing long-term F/R1-cultured P65KO hiPS cells maintained stable colony morphology and expressed core (SOX2, green; OCT4, red) and primed (CD24, green) pluripotency markers. Blue, DAPI. Scale bars, 200 μm. e, Representative haematoxylin and eosin staining images of a teratoma generated by P65KO hiPS cells (clone 1A3) showing lineage differentiation towards three germ layers. Scale bar, 200 μm. f, Representative fluorescence images of day-5 co-cultured and separately cultured P65KO hiPS cells (green, clone 1A3) and mEpiSCs (red). Scale bar, 400 μm. g, Growth curves of co-cultured (blue) and separately cultured (red) P65KO hiPS cells (clone 1B1) and mEpiSCs. n = 3, biological replicates. Data are mean ± s.e.m. h, Representative fluorescence images of day-5 co-cultured and separately cultured P65KO hiPS cells (clone 1B1, green) and mEpiSCs (red). Scale bar, 400 μm. i, Sanger sequencing result showing out-of-frame homozygous 13-bp deletion in MYD88KO hiPS cells. Bold, PAM sequence. j, Western blot analysis confirmed the lack of MYD88 protein expression in MYD88KO hiPS cells. k, Representative brightfield and immunofluorescence images showing longterm F/R1-cultured MYD88KO hiPS cells maintained stable colony morphology and expressed core (SOX2, green; OCT4, red) and primed (CD24, green) pluripotency markers. Blue, DAPI. Scale bars, 200 μm. l, Representative haematoxylin and eosin staining images of a teratoma generated by MYD88KO hiPS cells showing lineage differentiation towards three germ layers. Scale bar, 200 μm. m, Representative fluorescence images of day-5 co-cultured and separately cultured MYD88KO hiPS cells (green) and mEpiSCs (red). Scale bar, 400 μm. n, Western blot analyses of IKBA, P65, phospho-P65 (s468), P53 protein expression levels in co-cultured and separately cultured wild-type and mutant (P65KO, TP53KO and MYD88KO) HFF-hiPS cells. Vinculin was used as a loading control. Boxed areas were from separate blots. o, Bar graphs showing the fold changes of protein expression levels (shown in n) in co-cultured versus separately cultured wild-type and mutant HFF-hiPS cells. n = 1, biological replicate. Experiments in b, j and n were repeated independently three times with similar results. For gel source data, see Supplementary Fig. 1. Images in d–f, h and k–m are representative of three independent experiments.
Extended Data Fig. 8 |. Overcoming interspecies PSC competition enhances survival and chimerism of human primed PSCs in early mouse embryos.
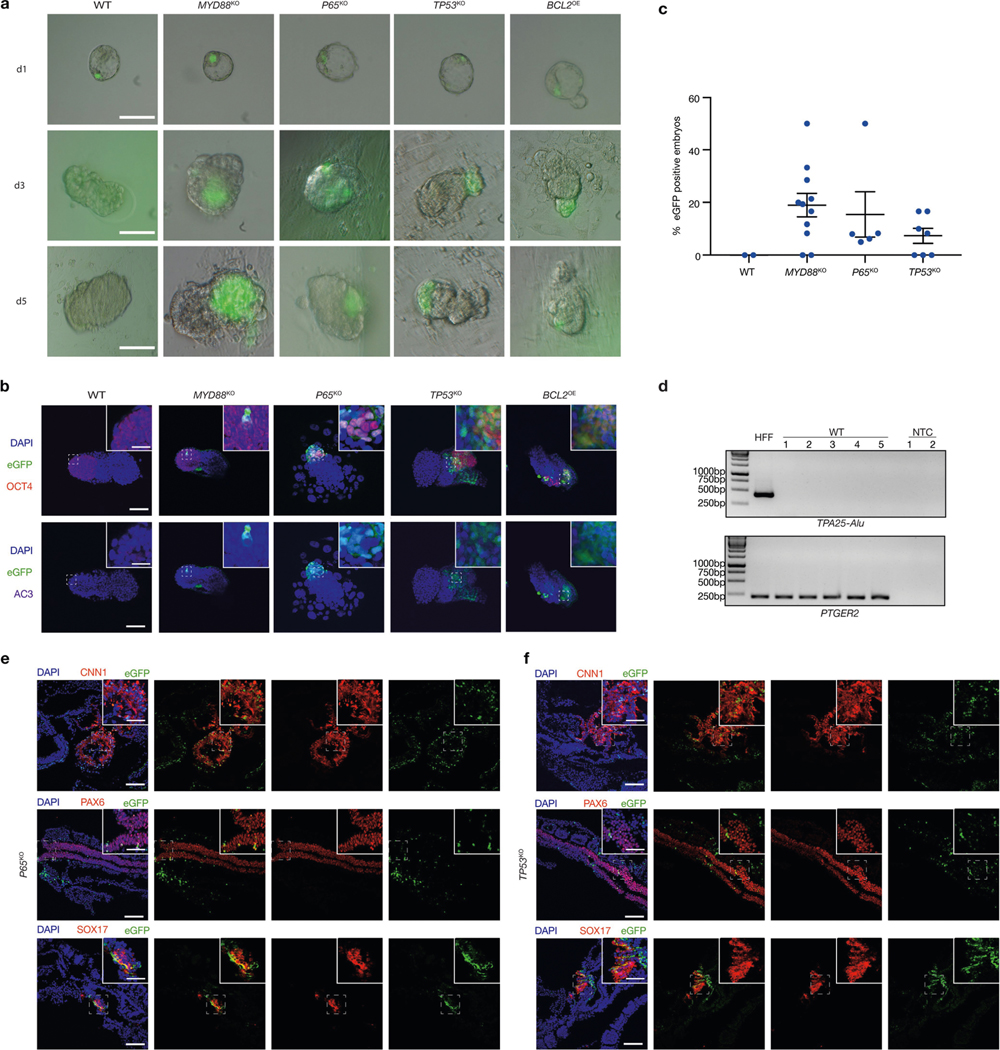
a, Representative brightfield and fluorescence merged images of mouse embryos cultured for 1 day (d1), 3 days (d3) and 5 days (d5) after blastocyst injection with wild-type, MYD88KO, P65KO, TP53KO and BCL2OE hiPS cells. Scale bars, 100 μm. b, Representative immunofluorescence images of day-5 mouse embryos co-stained with OCT4 (red), eGFP (green) and AC3 (purple) after blastocyst injection with wild-type, MYD88KO, P65KO, TP53KO and BCL2OE hiPS cells. Top, eGFP and OCT4 merged images with DAPI; bottom, eGFP and AC3 merged images with DAPI. Scale bars, 100 μm and 50 μm (insets). c, Dot plot showing the percentages of eGFP+ E8–E9 mouse embryos derived from wild-type, MYD88KO, P65KO and TP53KO hiPS cells. Each blue dot represents one embryo transfer experiment. n = 2 (WT), n = 11 (MYD88KO), n = 5 (P65KO) and n = 7 (TP53KO), independent experiments (Supplementary Table 2). d, Genomic PCR analysis of E8–E9 mouse embryos derived from blastocyst injection of wild-type hiPS cells. TPA25-Alu denotes a human-specific primer. PTGER2 was used as a loading control. HFF, HFF-hiPS cells. NTC, non-template control. The experiment was repeated independently three times with similar results. For gel source data, see Supplementary Fig. 1. e, f, Representative immunofluorescence images showing contribution and differentiation of eGFP-labelled P65KO (e) and TP53KO (f) hiPS cells in E8–E9 mouse embryos. Embryo sections were stained with antibodies against eGFP and lineage markers including CNN1 (mesoderm, top), PAX6 (ectoderm, middle) and SOX17 (endoderm, bottom). Scale bars, 100 μm and 50 μm (insets). Images in a, b, e and f are representative of three independent experiments.
Extended Data Fig. 9 |. Primed PSC competition among different species.
a, Representative brightfield images showing the derivation of rat EpiSCs cultured in F/R1 medium. Left, an isolated E7.5 Sprague Dawley (SD) rat epiblast; middle, day-2 rat epiblast outgrowth; right, rat EpiSCs at passage 11 (P11). Scale bars, 200 μm (left); 100 μm (middle and right). b, Representative brightfield images showing typical colony morphologies of rat EpiSCs, rhesus ES cells (ORMES23) and bovine ES cells grown in F/R1 medium, Scale bar, 200 μm. c, Representative immunofluorescence images showing long-term F/R1-cultured rat EpiSCs, ORMES23 rhesus ES cells and bovine ES cells expressed pluripotency transcription factors SOX2 (green) and OCT4 (red/green). Blue, DAPI. Scale bars, 200 μm. d, Growth curves of co-cultured (blue) and separately cultured (red) H1-hES cells and rat EpiSCs. Plating ratio of 4:1 (human:rat). n = 3, biological replicates. e, Growth curves of co-cultured (blue) and separately cultured (red) ORMES23 rhesus ES cells and rat EpiSCs. Plating ratio of 4:1 (rhesus:rat). n = 6, biological replicates. f, Quantification of AC3+ cells in day-3 co-cultured and separately cultured ORMES23 rhesus ES cells (blue) and mEpiSCs (red), n = 10, randomly selected 318.2 × 318.2 μm2 fields examined over three independent experiments. g, Growth curves of co-cultured (blue) and separately cultured (red) P65KO hiPS cells (clone 1B1) and rat EpiSCs. n = 3, biological replicates. h, Growth curves of co-cultured (blue) and separately cultured (red) MYD88KO hiPS cells and rat EpiSCs. n = 3, biological replicates. i, Growth curves of co-cultured (blue) and separately cultured (red) H1-hES cells and ORMES23 rhesus ES cells. Plating ratio of 1:1 (rhesus:human). n = 3, biological replicates. j, Growth curves of co-cultured (blue) and separately cultured (red) mEpiSCs and rat EpiSCs. Plating ratio of 1:1 (mouse:rat). n = 3, biological replicates. k, Growth curves of co-cultured (blue) and separately cultured (red) bovine ES cells and ORMES23 rhesus ES cells. Plating ratio of 1:1 (cow:rhesus). n = 3, biological replicates. l, Growth curves of co-cultured (blue) and separately cultured (red) bovine ES cells and rat EpiSCs. Plating ratio of 4:1 (cow:rat). n = 3, biological replicates. Images in a–c are representative of three independent experiments. P values determined by unpaired two-tailed t-test (d, e, k, l) or one-way ANOVA with Tukey’s multiple comparison (f). All data are mean ± s.e.m.
Extended Data Fig. 10 |. Effects of suppressing MYD88–P53–P65 signalling on human–human/monkey primed PSC co-culture and rat cell chimerism in mouse embryos.
a, Growth curves of co-cultured (blue) and separately cultured (red) wild-type and BCL2OE hiPS cells. n = 3, biological replicates. b, Growth curves of co-cultured (blue) and separately cultured (red) wild-type and TP53KO hiPS cells. n = 3, biological replicates. c, Growth curves of co-cultured (blue) and separately cultured (red) wild-type and P65KO hiPS cells. n = 3, biological replicates. d, Growth curves of co-cultured (blue) and separately cultured (red) wild-type and MYD88KO hiPS cells. n = 3, biological replicates. e, Growth curves of co-cultured (blue) and separately cultured (red) BCL2OE hiPS cells and ORMES23 rhesus ES cells. n = 3, biological replicates. f, Growth curves of co-cultured (blue) and separately cultured (red) TP53KO hiPS cells and ORMES23 rhesus ES cells. n = 3, biological replicates. g, Growth curves of co-cultured (blue) and separately cultured (red) P65KO hiPS cells and ORMES23 rhesus ES cells. n = 3, biological replicates. h, Growth curves of co-cultured (blue) and separately cultured (red) MYD88KO hiPS cells and ORMES23 rhesus ES cells. n = 3, biological replicates. i, Sanger sequencing result showing out-of-frame homozygous 22-bp deletion in Myd88KO rat ES cells. Bold, PAM sequence. j, Sanger sequencing result showing out-of-frame homozygous 1-bp deletion in Tp53KO rat ES cells. k, Dot plot showing the chimeric contribution levels of wild-type, Myd88KO and Tp53KO rat ES cells in E10.5 mouse embryos. Each blue dot indicates one E10.5 embryo. n = 13 (WT), n = 14 (Myd88KO), and n = 17 (Tp53KO), independent embryos. P values determined by one-way ANOVA with LSD multiple comparison. All data are mean ± s.e.m.
Supplementary Material
Acknowledgements
We thank E. Olson and M. Buszczak for critical reading of the manuscript, D. Schmitz for proofreading the manuscript, R. Jaenisch and T. Theunissen for sharing WIBR3 (5iLAF) naive hES cells; A. Smith for sharing H9 (PXGL) naive hES cells; T. Hishida (Salk) for providing pCAG-IP-mKO, pCAG-IP-eGFP and pCAG-IP-Bcl2 plasmids; L. Zhang for technical support; the Salk Stem Cell Core for providing some of the culture reagents; and the services provided by China National GeneBank and NCBI Gene Expression Omnibus. J.W. is a Virginia Murchison Linthicum Scholar in Medical Research and funded by Cancer Prevention & Research Institute of Texas (CPRIT RR170076) and Hamon Center for Regenerative Science & Medicine. L.Y. is partially supported by a trainee fellowship from the Hamon Center for Regenerative Science & Medicine. H.R.B. is supported by National Science Foundation Graduate Research Fellowship (2019241092) E.H.C. is supported by NIH grants (R01 AR053173 and R01 GM098816) and the HHMI Faculty Scholar Award. H.X., J.L. and Y.G. are supported by Guangdong Provincial Key Laboratory of Genome Read and Write (no. 2017B030301011).
Footnotes
Competing interests C.Z., Y.H. and J.W. are inventors on a patent application (applied through the Board of Regents of The University of Texas System, application number 62/963,801; status of application pending) entitled ‘Modulating TLR, NF-KB and p53 Signalling Pathways to Enhance Interspecies Chimerism Between Evolutionary Distant Species’ arising from this work. The other authors declare no competing interests.
Additional information
Supplementary information The online version contains supplementary material available at https://doi.org/10.1038/s41586-021-03273-0.
Peer review information Nature thanks Megan Munsie, Pierre Savatier, Miguel Torres and the other, anonymous, reviewer(s) for their contribution to the peer review of this work.
Data availability
The RNA-seq datasets generated in this study have been deposited in the CNSA (https://db.cngb.org/cnsa/) of CNGBdb with accession code CNP0000803, and also NCBI Gene Expression Omnibus (GEO; http://www.ncbi.nlm.nih.gov/geo) under accession number GSE142394. Source data are provided with this paper.
References
- 1.Amoyel M & Bach EA Cell competition: how to eliminate your neighbours. Development 141, 988–1000 (2014). [DOI] [PMC free article] [PubMed] [Google Scholar]
- 2.Wu J. & Izpisua Belmonte JC Dynamic pluripotent stem cell states and their applications. Cell Stem Cell 17, 509–525 (2015). [DOI] [PubMed] [Google Scholar]
- 3.Hackett JA & Surani MA Regulatory principles of pluripotency: from the ground state up. Cell Stem Cell 15, 416–430 (2014). [DOI] [PubMed] [Google Scholar]
- 4.Kobayashi T. et al. Generation of rat pancreas in mouse by interspecific blastocyst injection of pluripotent stem cells. Cell 142, 787–799 (2010). [DOI] [PubMed] [Google Scholar]
- 5.Wu J. et al. Interspecies chimerism with mammalian pluripotent stem cells. Cell 168, 473–486.e15 (2017). [DOI] [PMC free article] [PubMed] [Google Scholar]
- 6.Yamaguchi T. et al. Interspecies organogenesis generates autologous functional islets. Nature 542, 191–196 (2017). [DOI] [PubMed] [Google Scholar]
- 7.Goto T. et al. l. Generation of pluripotent stem cell-derived mouse kidneys in Sall1-targeted anephric rats. Nat. Commun 10, 451 (2019). [DOI] [PMC free article] [PubMed] [Google Scholar]
- 8.Isotani A, Hatayama H, Kaseda K, Ikawa M. & Okabe M. Formation of a thymus from rat ES cells in xenogeneic nude mouse↔rat ES chimeras. Genes Cells 16, 397–405 (2011). [DOI] [PubMed] [Google Scholar]
- 9.Honda A. et al. Flexible adaptation of male germ cells from female iPSCs of endangered Tokudaia osimensis. Sci. Adv 3, e1602179 (2017). [DOI] [PMC free article] [PubMed] [Google Scholar]
- 10.Xiang AP et al. Extensive contribution of embryonic stem cells to the development of an evolutionarily divergent host. Hum. Mol. Genet 17, 27–37 (2008). [DOI] [PubMed] [Google Scholar]
- 11.Theunissen TW et al. Molecular criteria for defining the naive human pluripotent state. Cell Stem Cell 19, 502–515 (2016). [DOI] [PMC free article] [PubMed] [Google Scholar]
- 12.Fu R. et al. Domesticated cynomolgus monkey embryonic stem cells allow the generation of neonatal interspecies chimeric pigs. Protein Cell 25, 1–11 (2019). [DOI] [PMC free article] [PubMed] [Google Scholar]
- 13.Morata G. & Ripoll P. Minutes: mutants of Drosophila autonomously affecting cell division rate. Dev. Biol 42, 211–221 (1975). [DOI] [PubMed] [Google Scholar]
- 14.Shakiba N. et al. Cell competition during reprogramming gives rise to dominant clones. Science 364, eaan0925 (2019). [DOI] [PubMed] [Google Scholar]
- 15.Nichols J. & Smith A. Naive and primed pluripotent states. Cell Stem Cell 4, 487–492 (2009). [DOI] [PubMed] [Google Scholar]
- 16.Weinberger L, Ayyash M, Novershtern N. & Hanna JH Dynamic stem cell states: naive to primed pluripotency in rodents and humans. Nat. Rev. Mol. Cell Biol 17, 155–169 (2016). [DOI] [PubMed] [Google Scholar]
- 17.Boroviak T, Loos R, Bertone P, Smith A. & Nichols J. The ability of inner-cell-mass cells to self-renew as embryonic stem cells is acquired following epiblast specification. Nat. Cell Biol 16, 516–528 (2014). [DOI] [PMC free article] [PubMed] [Google Scholar]
- 18.Kojima Y. et al. The transcriptional and functional properties of mouse epiblast stem cells resemble the anterior primitive streak. Cell Stem Cell 14, 107–120 (2014). [DOI] [PubMed] [Google Scholar]
- 19.Wu J. et al. An alternative pluripotent state confers interspecies chimaeric competency. Nature 521, 316–321 (2015). [DOI] [PMC free article] [PubMed] [Google Scholar]
- 20.Theunissen TW et al. Systematic identification of culture conditions for induction and maintenance of naive human pluripotency. Cell Stem Cell 15, 471–487 (2014). [DOI] [PMC free article] [PubMed] [Google Scholar]
- 21.Guo G. et al. Epigenetic resetting of human pluripotency. Development 144, 2748–2763 (2017). [DOI] [PMC free article] [PubMed] [Google Scholar]
- 22.Gafni O. et al. Derivation of novel human ground state naive pluripotent stem cells. Nature 504, 282–286 (2013). [DOI] [PubMed] [Google Scholar]
- 23.Yang Y. et al. Derivation of pluripotent stem cells with in vivo embryonic and extraembryonic potency. Cell 169, 243–257.e25 (2017). [DOI] [PMC free article] [PubMed] [Google Scholar]
- 24.Clavería C, Giovinazzo G, Sierra R. & Torres M. Myc-driven endogenous cell competition in the early mammalian embryo. Nature 500, 39–44 (2013). [DOI] [PubMed] [Google Scholar]
- 25.Bowling S. et al. P53 and mTOR signalling determine fitness selection through cell competition during early mouse embryonic development. Nat. Commun 9, 1763 (2018). [DOI] [PMC free article] [PubMed] [Google Scholar]
- 26.Sancho M. et al. Competitive interactions eliminate unfit embryonic stem cells at the onset of differentiation. Dev. Cell 26, 19–30 (2013). [DOI] [PMC free article] [PubMed] [Google Scholar]
- 27.Hashimoto M. & Sasaki H. Epiblast formation by TEAD-YAP-dependent expression of pluripotency factors and competitive elimination of unspecified cells. Dev. Cell 50, 139–154.e5 (2019). [DOI] [PubMed] [Google Scholar]
- 28.Clavería C. & Torres M. Cell competition: mechanisms and physiological roles. Annu. Rev. Cell Dev. Biol 32, 411–439 (2016). [DOI] [PubMed] [Google Scholar]
- 29.Martins VC et al. Cell competition is a tumour suppressor mechanism in the thymus. Nature 509, 465–470 (2014). [DOI] [PubMed] [Google Scholar]
- 30.Wagstaff L. et al. Mechanical cell competition kills cells via induction of lethal p53 levels. Nat. Commun 7, 11373 (2016). [DOI] [PMC free article] [PubMed] [Google Scholar]
- 31.Dejosez M, Ura H, Brandt VL & Zwaka TP Safeguards for cell cooperation in mouse embryogenesis shown by genome-wide cheater screen. Science 341, 1511–1514 (2013). [DOI] [PubMed] [Google Scholar]
- 32.Zhang Q, Lenardo MJ & Baltimore D. 30 Years of NF-κB: a blossoming of relevance to human pathobiology. Cell 168, 37–57 (2017). [DOI] [PMC free article] [PubMed] [Google Scholar]
- 33.Meyer SN et al. An ancient defense system eliminates unfit cells from developing tissues during cell competition. Science 346, 1258236 (2014). [DOI] [PMC free article] [PubMed] [Google Scholar]
- 34.Bedzhov I, Leung CY, Bialecka M. & Zernicka-Goetz M. In vitro culture of mouse blastocysts beyond the implantation stages. Nat. Protocols 9, 2732–2739 (2014). [DOI] [PubMed] [Google Scholar]
- 35.Hu Z. et al. Transient inhibition of mTOR in human pluripotent stem cells enables robust formation of mouse-human chimeric embryos. Sci. Adv 6, eaaz0298 (2020). [DOI] [PMC free article] [PubMed] [Google Scholar]
- 36.Bogliotti YS et al. Efficient derivation of stable primed pluripotent embryonic stem cells from bovine blastocysts. Proc. Natl Acad. Sci. USA 115, 2090–2095 (2018). [DOI] [PMC free article] [PubMed] [Google Scholar]
- 37.Mitalipov S. et al. Isolation and characterization of novel rhesus monkey embryonic stem cell lines. Stem Cells 24, 2177–2186 (2006). [DOI] [PubMed] [Google Scholar]
- 38.Wang X. et al. Human embryonic stem cells contribute to embryonic and extraembryonic lineages in mouse embryos upon inhibition of apoptosis. Cell Res. 28, 126–129 (2018). [DOI] [PMC free article] [PubMed] [Google Scholar]
- 39.Huang K. et al. BMI1 enables interspecies chimerism with human pluripotent stem cells. Nat. Commun 9, 4649 (2018). [DOI] [PMC free article] [PubMed] [Google Scholar]
- 40.Das S. et al. Generation of human endothelium in pig embryos deficient in ETV2. Nat. Biotechnol 38, 297–302 (2020). [DOI] [PubMed] [Google Scholar]
- 41.Bayerl J. et al. Tripartite inhibition of SRC-WNT-PKC signalling consolidates human naïve pluripotency. Preprint at 10.1101/2020.05.23.112433 (2020). [DOI] [Google Scholar]
- 42.Yu L. et al. Derivation of intermediate pluripotent stem cells amenable to primordial germ cell specification. Cell Stem Cell 10.1016/j.stem.2020.11.003 (2020). [DOI] [PubMed] [Google Scholar]
- 43.Li P. et al. Germline competent embryonic stem cells derived from rat blastocysts. Cell 135, 1299–1310 (2008). [DOI] [PMC free article] [PubMed] [Google Scholar]
- 44.Coghill PA, Kesselhuth EK, Shimp EA, Khismatullin DB & Schmidtke DW Effects of microfluidic channel geometry on leukocyte rolling assays. Biomed. Microdevices 15, 183–193 (2013). [DOI] [PubMed] [Google Scholar]
- 45.Nelson CM, Liu WF & Chen CS Manipulation of cell-cell adhesion using bowtie-shaped microwells. Methods Mol. Biol 370, 1–10 (2007). [DOI] [PubMed] [Google Scholar]
- 46.Godar S. et al. Growth-inhibitory and tumor- suppressive functions of p53 depend on its repression of CD44 expression. Cell 134, 62–73 (2008). [DOI] [PMC free article] [PubMed] [Google Scholar]
- 47.Kim D, Langmead B. & Salzberg SL HISAT: a fast spliced aligner with low memory requirements. Nat. Methods 12, 357–360 (2015). [DOI] [PMC free article] [PubMed] [Google Scholar]
- 48.Pertea M. et al. StringTie enables improved reconstruction of a transcriptome from RNA-seq reads. Nat. Biotechnol 33, 290–295 (2015). [DOI] [PMC free article] [PubMed] [Google Scholar]
- 49.Love MI, Huber W. & Anders S. Moderated estimation of fold change and dispersion for RNA-seq data with DESeq2. Genome Biol. 15, 550 (2014). [DOI] [PMC free article] [PubMed] [Google Scholar]
Associated Data
This section collects any data citations, data availability statements, or supplementary materials included in this article.
Supplementary Materials
Data Availability Statement
The RNA-seq datasets generated in this study have been deposited in the CNSA (https://db.cngb.org/cnsa/) of CNGBdb with accession code CNP0000803, and also NCBI Gene Expression Omnibus (GEO; http://www.ncbi.nlm.nih.gov/geo) under accession number GSE142394. Source data are provided with this paper.


