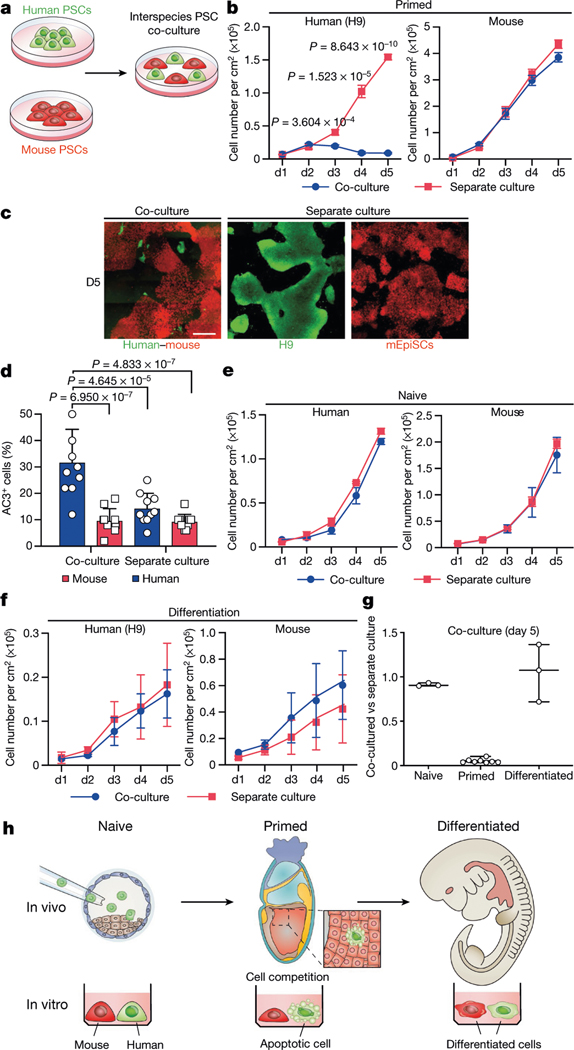
Fig. 1 |. Cell competition between human and mouse primed PSCs.
a, A schematic of human and mouse PSC co-culture. b, Growth curves of co-cultured (blue) and separately cultured (red) H9-hES cells (left) and mEpiSCs (right) grown in the F/R1 culture condition. n = 8, biological replicates. c, Representative fluorescence images of day-5 co-cultured and separately cultured H9-hES cells (green) and mEpiSCs (red). Scale bar, 400 μm. d, Quantification of AC3+ cells in day-3 co-cultured and separately cultured H9-hES cells (blue) and mEpiSCs (red). n = 10, randomly selected 318.2 × 318.2 μm2 fields examined over three independent experiments. e, Growth curves of co-cultured (blue) and separately cultured (red) human and mouse naive PSCs, grown in 5iLAF medium. n = 3, biological replicates. f, Growth curves of co-differentiation (blue) and separate differentiation (red) cultures of H9-hES cells and mEpiSCs. n = 3, biological replicates. g, Ratios (co-culture versus separate culture) of day-5 live human cell numbers in naïve (n = 3), primed (n = 8) and differentiation (n = 3) cell culture conditions. n, biological replicates. h, Schematic summary of human and mouse PSC competition. Plating ratio was 4:1 (human:mouse) for all co-cultures shown. P values determined by unpaired two-tailed t-test (b) or one-way analysis of variance (ANOVA) with Tukey’s multiple comparison (d). All data are mean ± s.e.m.

