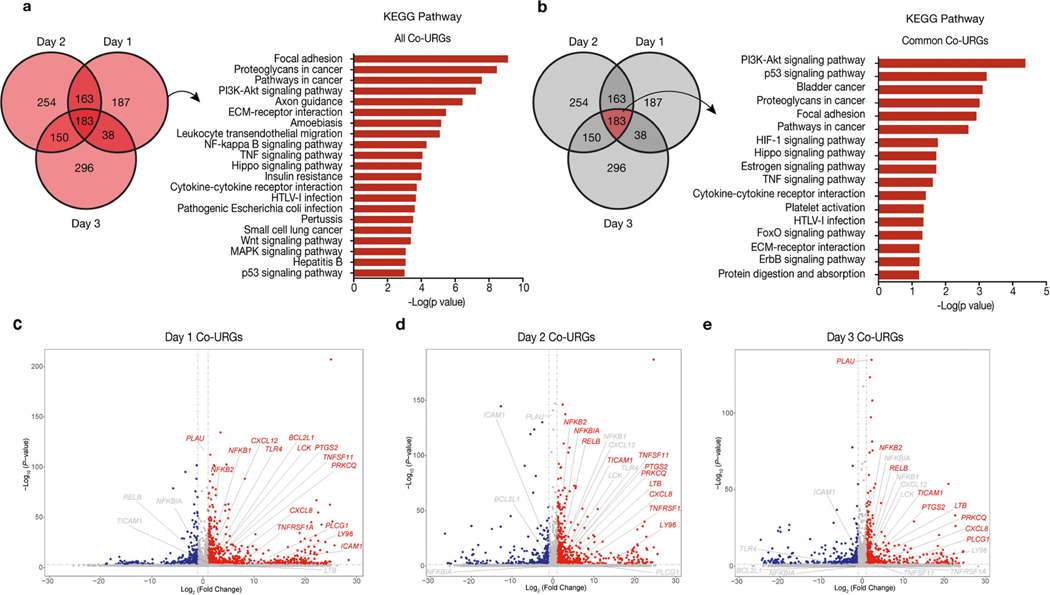
Extended Data Fig. 6 |. Comparative RNA-seq analysis between co-cultured and separately cultured H9-hES cells.
a, b, KEGG pathways enriched in all (days 1, 2 and 3 combined) (a) and common (commonly shared among days 1, 2 and 3) (b) co-URGs in H9-hES cells. c–e, Volcano plots showing significantly upregulated (red) and downregulated (blue) genes in co-cultured versus separately cultured H9-hES cells on days 1 (c), 2 (d) and 3 (e). NF-κB pathway-related genes are highlighted in the volcano plots. P values determined by a modified one-sided Fisher’s exact test (EASE score) (a, b) or Wald test (c–e).

