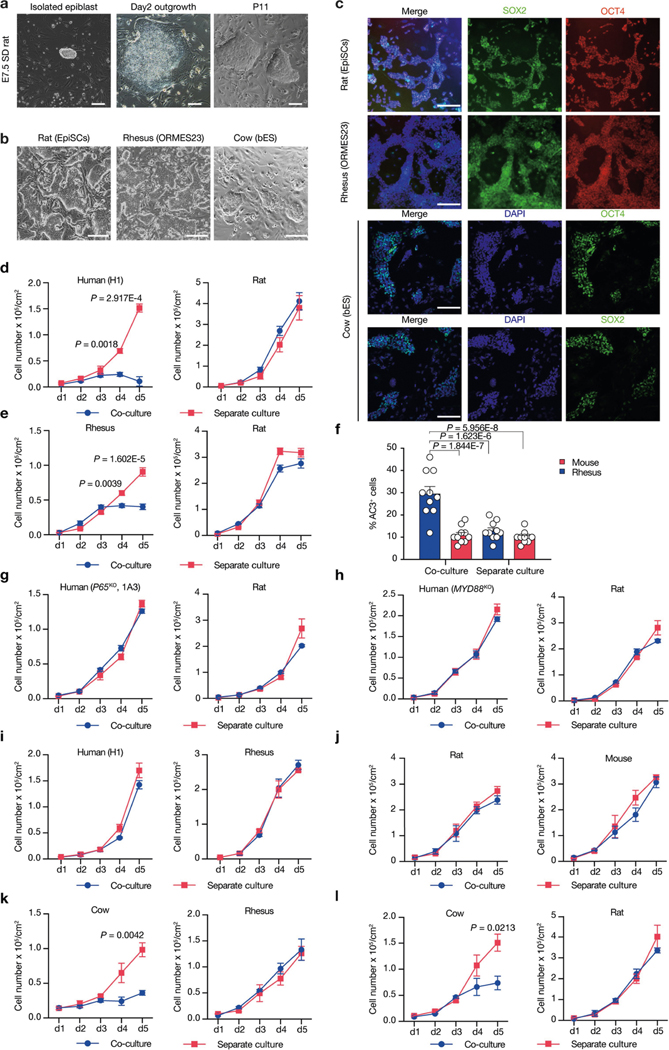
Extended Data Fig. 9 |. Primed PSC competition among different species.
a, Representative brightfield images showing the derivation of rat EpiSCs cultured in F/R1 medium. Left, an isolated E7.5 Sprague Dawley (SD) rat epiblast; middle, day-2 rat epiblast outgrowth; right, rat EpiSCs at passage 11 (P11). Scale bars, 200 μm (left); 100 μm (middle and right). b, Representative brightfield images showing typical colony morphologies of rat EpiSCs, rhesus ES cells (ORMES23) and bovine ES cells grown in F/R1 medium, Scale bar, 200 μm. c, Representative immunofluorescence images showing long-term F/R1-cultured rat EpiSCs, ORMES23 rhesus ES cells and bovine ES cells expressed pluripotency transcription factors SOX2 (green) and OCT4 (red/green). Blue, DAPI. Scale bars, 200 μm. d, Growth curves of co-cultured (blue) and separately cultured (red) H1-hES cells and rat EpiSCs. Plating ratio of 4:1 (human:rat). n = 3, biological replicates. e, Growth curves of co-cultured (blue) and separately cultured (red) ORMES23 rhesus ES cells and rat EpiSCs. Plating ratio of 4:1 (rhesus:rat). n = 6, biological replicates. f, Quantification of AC3+ cells in day-3 co-cultured and separately cultured ORMES23 rhesus ES cells (blue) and mEpiSCs (red), n = 10, randomly selected 318.2 × 318.2 μm2 fields examined over three independent experiments. g, Growth curves of co-cultured (blue) and separately cultured (red) P65KO hiPS cells (clone 1B1) and rat EpiSCs. n = 3, biological replicates. h, Growth curves of co-cultured (blue) and separately cultured (red) MYD88KO hiPS cells and rat EpiSCs. n = 3, biological replicates. i, Growth curves of co-cultured (blue) and separately cultured (red) H1-hES cells and ORMES23 rhesus ES cells. Plating ratio of 1:1 (rhesus:human). n = 3, biological replicates. j, Growth curves of co-cultured (blue) and separately cultured (red) mEpiSCs and rat EpiSCs. Plating ratio of 1:1 (mouse:rat). n = 3, biological replicates. k, Growth curves of co-cultured (blue) and separately cultured (red) bovine ES cells and ORMES23 rhesus ES cells. Plating ratio of 1:1 (cow:rhesus). n = 3, biological replicates. l, Growth curves of co-cultured (blue) and separately cultured (red) bovine ES cells and rat EpiSCs. Plating ratio of 4:1 (cow:rat). n = 3, biological replicates. Images in a–c are representative of three independent experiments. P values determined by unpaired two-tailed t-test (d, e, k, l) or one-way ANOVA with Tukey’s multiple comparison (f). All data are mean ± s.e.m.

