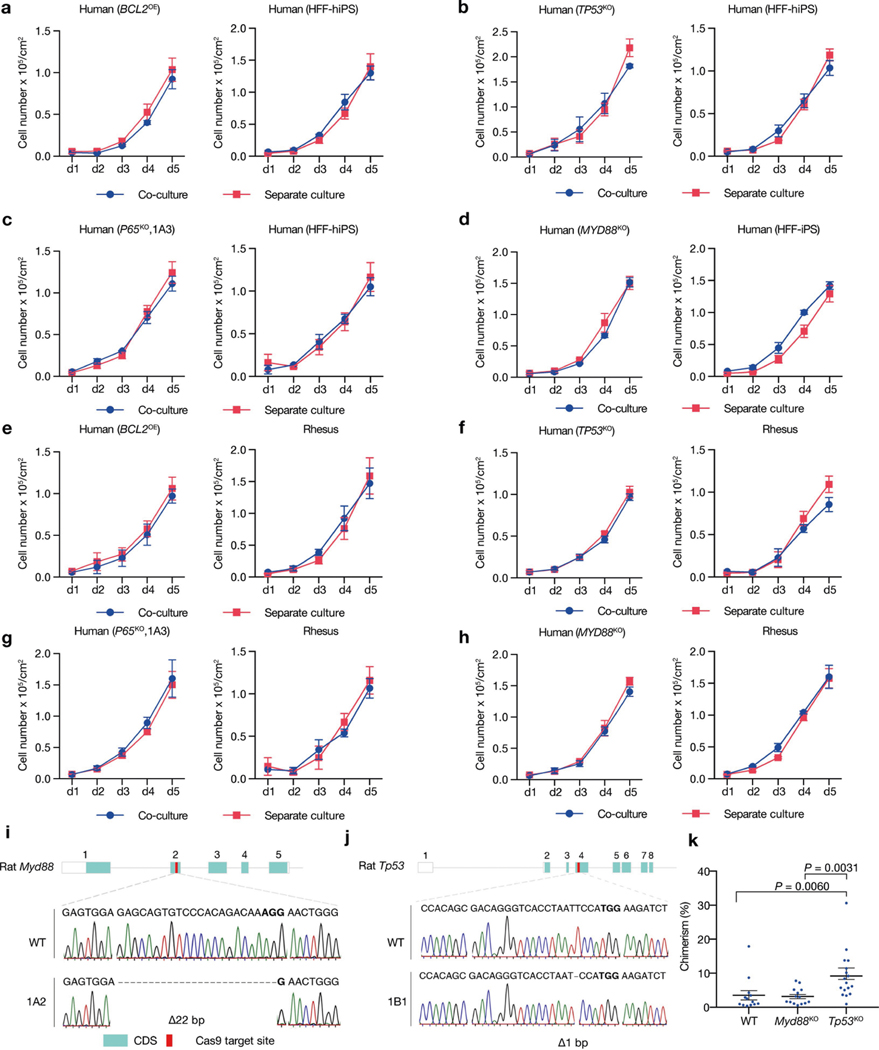
Extended Data Fig. 10 |. Effects of suppressing MYD88–P53–P65 signalling on human–human/monkey primed PSC co-culture and rat cell chimerism in mouse embryos.
a, Growth curves of co-cultured (blue) and separately cultured (red) wild-type and BCL2OE hiPS cells. n = 3, biological replicates. b, Growth curves of co-cultured (blue) and separately cultured (red) wild-type and TP53KO hiPS cells. n = 3, biological replicates. c, Growth curves of co-cultured (blue) and separately cultured (red) wild-type and P65KO hiPS cells. n = 3, biological replicates. d, Growth curves of co-cultured (blue) and separately cultured (red) wild-type and MYD88KO hiPS cells. n = 3, biological replicates. e, Growth curves of co-cultured (blue) and separately cultured (red) BCL2OE hiPS cells and ORMES23 rhesus ES cells. n = 3, biological replicates. f, Growth curves of co-cultured (blue) and separately cultured (red) TP53KO hiPS cells and ORMES23 rhesus ES cells. n = 3, biological replicates. g, Growth curves of co-cultured (blue) and separately cultured (red) P65KO hiPS cells and ORMES23 rhesus ES cells. n = 3, biological replicates. h, Growth curves of co-cultured (blue) and separately cultured (red) MYD88KO hiPS cells and ORMES23 rhesus ES cells. n = 3, biological replicates. i, Sanger sequencing result showing out-of-frame homozygous 22-bp deletion in Myd88KO rat ES cells. Bold, PAM sequence. j, Sanger sequencing result showing out-of-frame homozygous 1-bp deletion in Tp53KO rat ES cells. k, Dot plot showing the chimeric contribution levels of wild-type, Myd88KO and Tp53KO rat ES cells in E10.5 mouse embryos. Each blue dot indicates one E10.5 embryo. n = 13 (WT), n = 14 (Myd88KO), and n = 17 (Tp53KO), independent embryos. P values determined by one-way ANOVA with LSD multiple comparison. All data are mean ± s.e.m.

