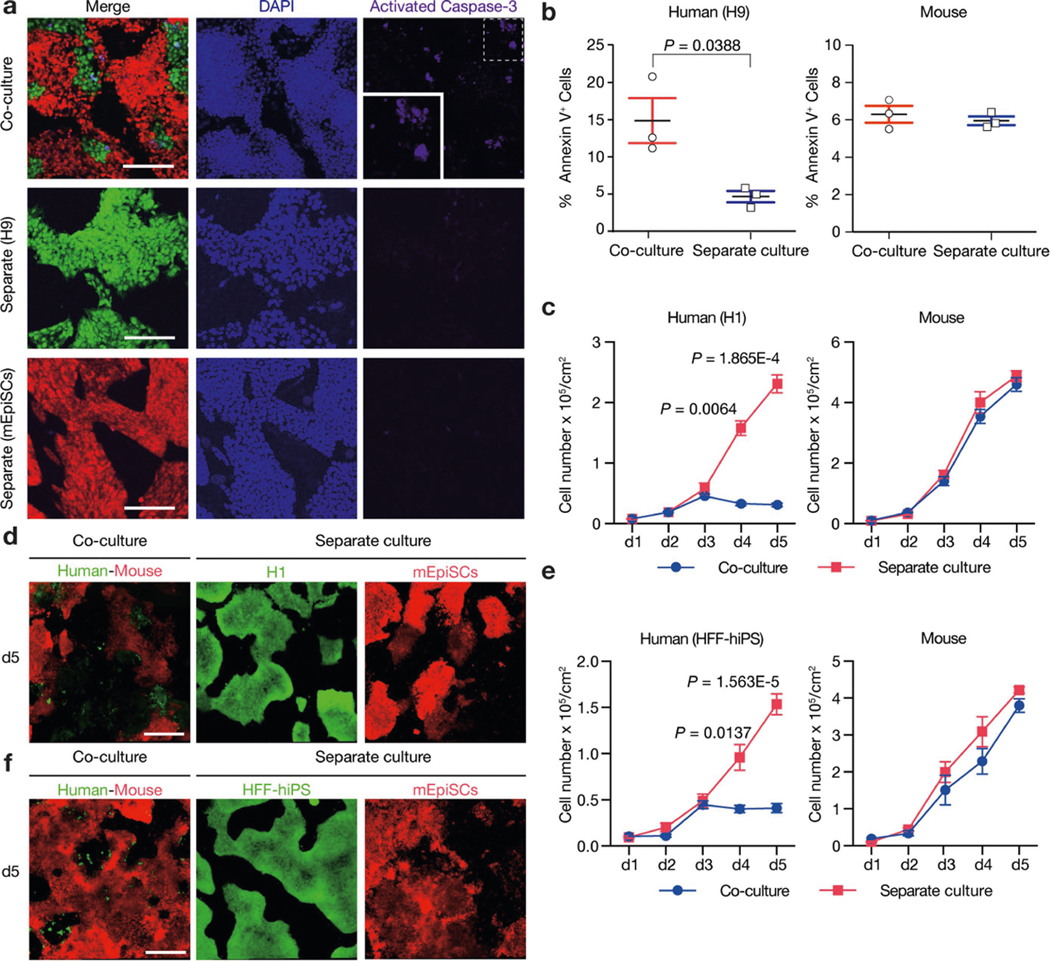
Extended Data Fig. 2 |. Human–mouse primed PSC competition.

a, Representative immunofluorescence images showing AC3 staining of day-3 co-cultured and separately cultured H9-hES cells (green) and mEpiSCs (red). Blue, DAPI; purple, AC3. Inset, a higher-magnification image of boxed area with dotted line. Scale bars, 200 μm. b, Dot plots showing the percentages of annexin V+ cells in day-3 co-cultured and separately cultured H9-hES cells (left) and mEpiSCs (right). n = 3, biological replicates. c, Growth curves of co-cultured (blue) and separately cultured (red) H1-hES cells (left) and mEpiSCs (right). Plating ratio of 4:1 (human:mouse), n = 3, biological replicates. d, Representative fluorescence images of day-5 co-cultured and separately cultured H1-hES cells (green) and mEpiSCs (red). Scale bar, 400 μm. e, Growth curves of co-cultured (blue) and separately cultured (red) HFF-hiPS cells and mEpiSCs. Plating ratio of 4:1 (human:mouse), n = 5, biological replicates. f, Representative fluorescence images of day-5 co-cultured and separately cultured HFF-hiPS cells (green) and mEpiSCs (red). Scale bar, 400 μm. Experiments in a, d and f were repeated independently three times with similar results. P values determined by unpaired two-tailed t-test (b, c, e). All data are mean ± s.e.m.
