

Abstract
The recent advent of whole exon (exome)‐capture technology, coupled with second‐generation sequencers, has made it possible to readily detect genomic alterations that affect encoded proteins in cancer cells. Such target resequencing of the cancer genome, however, fails to detect most clinically‐relevant gene fusions, given that such oncogenic fusion genes are often generated through intron‐to‐intron ligation. To develop a resequencing platform that simultaneously captures point mutations, insertions–deletions (indels), and gene fusions in the cancer genome, we chose cDNA as the input for target capture and extensive resequencing, and we describe the versatility of such a cDNA‐capture system. As a test case, we constructed a custom target‐capture system for 913 cancer‐related genes, and we purified cDNA fragments for the target gene set from five cell lines of CML. Our target gene set included Abelson murine leukemia viral oncogene homolog 1 (ABL1), but it did not include breakpoint cluster region (BCR); however, the sequence output faithfully detected reads spanning the fusion points of these two genes in all cell lines, confirming the ability of cDNA capture to detect gene fusions. Furthermore, computational analysis of the sequence dataset successfully identified non‐synonymous mutations and indels, including those of tumor protein p53 (TP53). Our data might thus support the feasibility of a cDNA‐capture system coupled with massively parallel sequencing as a simple platform for the detection of a variety of anomalies in protein‐coding genes among hundreds of cancer specimens. (Cancer Sci 2012; 103: 131–135)
Cancer is thought to result from various alterations of the genome, including point mutations, insertions–deletions (indels), and genomic rearrangements.( 1 ) Whereas comprehensive sequencing of the cancer genome, or “cancer genome resequencing”, is a promising approach to the identification of such anomalies, and to provide a basis for the development of effective treatment strategies for cancer, determination of the nucleotide sequence of the entire human genome with conventional Sanger sequencers remains a highly demanding task. However, the recent advent of massively parallel sequencing systems, or second‐generation sequencers, has rendered such projects manageable in private laboratories( 2 ) and triggered the formation of large‐scale consortia, such as The Cancer Genome Atlas and International Cancer Genome Consortium,( 3 ) to undertake cancer genome resequencing for hundreds of specimens. Cancer genome resequencing with massively parallel sequencers has already provided a wealth of information on genome‐wide mutation status for melanoma,( 4 ) acute myeloid leukemia,( 5 ) hepatocellular carcinoma,( 6 ) and other cancers.
Even with the current massively parallel sequencers, however, the determination and compilation of the full genome sequence for a given sample might still take almost 1 month. Comparison of the cancer genome among many specimens thus remains time‐consuming and labor intensive. Anomalies in protein‐coding genes likely play a major role in carcinogenesis. Given that exonic regions occupy only ∼1.3% of the human genome, sequencing such targeted regions would be expected to markedly facilitate the discovery of proteins that are activated or inactivated specifically in cancer cells. Indeed, target‐capture strategies, coupled with massively parallel sequencers, have revealed important genetic changes in cancer,( 7 ) as well as in hereditary disorders.( 8 , 9 )
One important drawback of such target‐capture approaches, however, is their inability to detect gene fusions. Most cancer‐associated gene fusion events occur within introns (resulting in exon‐to‐exon ligation in the corresponding mRNA), and exon capture does not reveal breakage and ligation of intronic regions. Recurrent gene fusions were once thought to be rare in epithelial tumors compared with hematologic malignancies and sarcomas;( 10 ) however, our recent discovery of the echinoderm microtubule associated protein like‐4 (EML4)‐anaplastic lymphoma kinase (ALK) fusion gene in lung cancer and the discovery by others of rearrangements in loci for the v‐ets avian erythroblastosis virus E26 oncogene homolog (ETS) family of transcription factors in prostate cancer have led to a revision of this notion.( 11 , 12 ) It would thus be desirable to develop a resequencing platform that is able to capture, within a reasonable timeframe, all gene fusions, point mutations, and indels in the cancer genome. In pursuit of this goal, we have now examined the efficacy of high‐throughput sequencing of captured cDNA for the identification of such cancer genome anomalies.
Materials and Methods
Cell lines. Cell lines established from the blast crisis stage of CML, including MEG‐01s, KCL‐22‐SR, K562, NCO2, and KU812,( 13 , 14 ) were obtained from the Japanese Collection of Research Bioresources (Osaka, Japan) and were maintained in RPMI‐1640 medium (Invitrogen, Carlsbad, CA, USA) supplemented with 10% FBS (Invitrogen). Total RNA was isolated from each cell line with the use of an RNeasy mini kit (Qiagen, Valencia, CA, USA) and was subjected to cDNA synthesis with an oligo(dT) primer.
Gene expression profiling. The cDNA prepared from total poly(A)‐RNA of KCL‐22‐SR cells was subjected to hybridization with the HGU95Av2 microarray (Affymetrix, Santa Clara, CA, USA), as described previously.( 15 ) The expression intensity of each test gene on the array was normalized by the 50th percentile value.
cDNA‐capture methods. RNA probes of 120 bases were designed to cover (with a 60‐base overlap) cDNA of 913 human protein‐coding genes (Table S1), and were synthesized by Agilent Technologies (Santa Clara, CA, USA). During the design of the probes, the Repeat Masker dataset (http://www.repeatmasker.org) was used to remove probes corresponding to repetitive sequences in the human genome. Hybridization of DNA fragments to the RNA probes was performed according to the protocols recommended for the SureSelect Target Enrichment system (Agilent). We also used the SureSelect Human X Chromosome Demo kit (Agilent) to examine purification efficiency. Purified DNA fragments were then subjected to sequencing with a Genome Analyzer IIx (GAIIx; Illumina, San Diego, CA, USA) for 76 bases from both ends by the paired‐end sequencing system.
Computational pipeline. Raw read data were quality filtered on the basis of the presence of the Illumina adaptor sequences and a Q‐value of ≥20. The resulting read sequences were then subjected to an in‐house computational pipeline to identify various mutations (Fig. S1). In brief, read sequences were matched with the Bowtie algorithm( 16 ) to the cDNA sequences of the 913 genes used to construct our custom‐made SureSelect system. The matched reads were then examined for the presence of non‐synonymous mutations and single nucleotide polymorphisms (SNP) deposited in dbSNP (build 132, http://www.ncbi.nlm.nih.gov/projects/SNP/index.html). The remaining reads were further matched to the cDNA sequences with Burrows‐Wheeler Aligner (BWA) and Basic Local Alignment Search Tool (BLAST) algorithms to search for indels and multiple mutations.( 17 , 18 ) Candidates for non‐synonymous mutations were identified only when ≥20% of reads correspond to the mutations at positions with ≥50 coverage.
For the selection of reads corresponding to possible fusion cDNA, nucleotide sequences of 20 bp were obtained from both ends of each read and were separately matched to RefSeq mRNA (http://www.ncbi.nlm.nih.gov), KnownGeneMrna,( 19 ) and the human genome sequence (GRCh37, http://www.ncbi.nlm.nih.gov/projects/genome/assembly/grc/human/data/?build=37). Reads were considered to be derived from fusion genes if the ends of a given read matched to different genes within the 913‐gene group, or one end matched to a single gene within the 913‐gene group and the other end matched to a sequence in RefSeq, KnownGeneMrna, or the human genome sequence that did not correspond to the 913 genes. Candidates for fusion genes were identified only when four or more reads were mapped to possible fusion points.
RT–PCR. To confirm the presence of an alternatively‐spliced mixed‐lineage leukemia (MLL) mRNA, we subjected oligo(dT)‐primed cDNA of KU812 cells to PCR with the combination of the F‐1 primer (5′‐ACCTCGTGGGAGACCTAGAAGTGG‐3′) and the R primer (5′‐AGTCATTGGAAGCTTGTCTGCCTG‐3′), or with the combination of the F‐2 primer (5′‐CCTGTGGGTAGGGTTTCCAAAGAG‐3′) and the R primer.
Results
Efficiency of cDNA‐capture sequencing. Paired‐end sequencing of target‐captured cDNA was briefly described in a previous study;( 20 ) however, how the efficiency of target purification with cDNA compares with that with genomic DNA remains unclear. We therefore attempted to optimize the conditions for cDNA purification with the SureSelect system. Oligo(dT)‐primed cDNA of KCL‐22‐SR cells were fragmented to a mean size of 500 or 200 bp and then subjected to purification with the use of the SureSelect Human X Chromosome Demo kit, which is designed to capture genomic sequences derived from the human X chromosome. Genomic DNA of KCL‐22‐SR cells was similarly processed and hybridized with the X Chromosome Demo kit. The purified fragments at either 4 or 8 pM were then sequenced by the GAIIx system.
The X chromosome‐mapped cDNA reads occupied 62.1%, 81.6%, 62.4%, and 82.2% of quality filter‐passed reads for the experiments with 4 pM of 500‐bp fragments, 4 pM of 200‐bp fragments, 8 pM of 500‐bp fragments, and 8 pM of 200‐bp fragments, respectively (Fig. 1). Thus, these results suggested that the shorter cDNA fragments were captured more efficiently than the longer ones. Furthermore, the purification efficiency for genomic DNA fragments was not higher than that for cDNA, irrespective of DNA concentration and fragmentation size (Fig. 1), supporting the feasibility of cDNA‐capture approaches.
Figure 1.

Comparison of capture efficiency between cDNA and genomic DNA. Genomic DNA or cDNA of KCL‐22‐SR cells was fragmented to a mean size of 200 or 500 bp, and then subjected to purification with the SureSelect Human X Chromosome Demo kit, followed by GAIIx sequencing at a concentration of 4 or 8 pM (the latter indicated by an asterisk). Numbers of raw reads, reads with a Q‐value of ≥20 (Q ≥ 20), and reads mapped to the human X chromosome are shown for each experiment. Percentage of X chromosome‐mapped reads among the reads with a Q‐value of ≥20 is shown on the right.
The ability to detect breakpoint cluster region (BCR)‐Abelson murine leukemia viral oncogene homolog 1 (ABL1) fusion reads was reduced for the cDNA sheared to ∼200 bp compared with that for those of ∼500 bp (see below). The former cDNA detected 83.7% or 76% of the fusion reads detected by the latter cDNA at input concentrations of 4 and 8 pM, respectively. This result is in line with our computational bootstrap trial (n = 10 000) showing that the number of randomly‐fragmented, 200‐bp reads encompassing the BCR–ABL1 fusion point is ∼2.5 times higher than that of 500‐bp reads (data not shown). However, given that the total number of high‐quality reads was much higher in the data for the 200‐bp cDNA than in those for the 500‐bp cDNA (Fig. 1), we chose to use 8 pM of cDNA with a mean size of 200 bp for further experiments.
Custom cDNA‐capture system. We also tested whether extensive sequencing of cDNA generated from total poly(A)‐RNA (unselected cDNA) might serve to identify gene fusions, point mutations, and indels. For this purpose, unselected cDNA were prepared from KCL22‐SR cells, and subjected to GAIIx sequencing, yielding 34.1 million reads, which mapped to 36 128 RefSeq entries (data not shown). The distribution of read number per transcript in the data is shown in Figure 2a. Among the 36 128 entries, only 200 (0.55%) accounted for ∼20% of total reads, and 4.55% accounted for ∼50% of reads. Thus, as expected, resequencing data for unselected cDNA consist mostly of reads corresponding to a limited number of highly‐abundant transcripts.
Figure 2.

Capture of a selected set of cDNA. (a) Read number for each gene was calculated from the sequencing data for the unselected cDNA of KCL‐22‐SR cells. Genes were sorted according to their read number. A small number of genes accounted for most of the sequence reads. (b) Functional annotation for the encoded proteins of our target cDNA (n = 913). (c) Read number per nucleotide for each captured cDNA in KCL‐22‐SR cells is compared with the expression intensity (arbitrary units) of the same cDNA examined with an HGU95Av2 microarray. Pearson’s correlation coefficient (r) for the comparison is also demonstrated.
We therefore attempted to construct a custom SureSelect system to capture cDNA for cancer‐related genes. For this purpose, we selected 913 genes that yielded 56 892 hybridization probes corresponding to ∼3.77 Mbp of total capture capacity. The target genes encoded human protein kinases (all members in the human genome), transcription regulators, phosphatases, and other proteins (Fig. 2b; Table S1).
To compare the information provided by the sequence data from unselected and captured cDNA, we purified target cDNA from KCL‐22‐SR cells with the use of our custom SureSelect system, and determined their nucleotide sequences with GAIIx. A comparable amount of filter‐passed reads (39.2 million) to that of unselected cDNA were thus obtained. We found that 88% of the captured cDNA were mapped to the target genes in our SureSelect system, while only 6.6% of the unselected cDNA were mapped to the 913 targets (data not shown). The read number obtained for each gene in the captured cDNA dataset is shown in Figure S2, with the distribution being markedly different from that obtained by sequencing of the unselected cDNA (Fig. 2a). As expected, the read number per nucleotide in each cDNA for the captured dataset was highly correlated to the expression intensity of the same gene quantified with the HGU95Av2 GeneChip expression array (Pearson’s correlation coefficient = 0.770, P < 2.2 × 10⁻¹⁶) (Fig. 2c).
We further isolated target cDNA from other CML cell lines, including K562, KU812, MEG‐01s, and NCO2, and the purified cDNA fragments were subjected to GAIIx sequencing. As in the case for KCL‐22‐SR, 86–88% of the obtained reads were successfully mapped to the target cDNA in each cell line (Table S2).
Screening of fusion cDNA. Our target set of 913 genes did not include BCR, but it did contain ABL1. Thus, if we were able to isolate sequence reads encompassing the fusion point of BCR–ABL1, cDNA‐capture approaches for a given gene set would likely be able to detect gene fusions to unknown partners. In fact, we detected 45 sequence reads for KCL‐22‐SR cells that covered the BCR–ABL1 fusion point (Fig. 3a). Likewise, the sequence datasets for K562, KU812, MEG‐01s, and NCO2 cells contained 53, 8, 11, and 10 such fusion reads, respectively (data not shown). Furthermore, our sequence data faithfully recapitulated two variants of BCR–ABL1 cDNA in these cell lines; a fusion variant between exon 13 of BCR and exon 2 of ABL1 was detected in KCL‐22‐SR, MEG‐01s, and NCO2 cells, whereas a fusion variant between exon 14 of BCR and exon 2 of ABL1 was detected in K562 and KU812 cells.( 14 )
Figure 3.
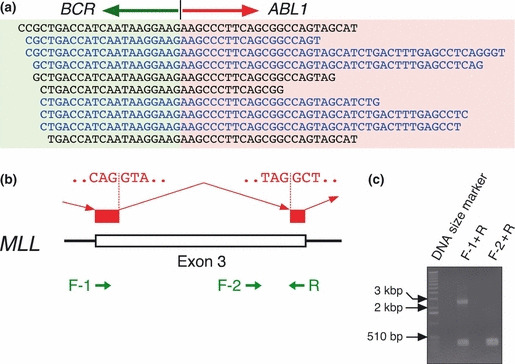
Detection of gene fusions and alternative mRNA splicing in CML cells. (a) Our computational pipeline yielded 45 reads for KCL‐22‐SR cells that encompassed the fusion point of breakpoint cluster region (BCR)‐Abelson murine leukemia viral oncogene homolog 1 (ABL1) cDNA, some of which are shown aligned. Reads in the sense or antisense strand are designated in black and blue letters, respectively, and the BCR and ABL1 portions of the sequences are shaded differentially. (b) Some of the reads that mapped to exon 3 of mixed‐lineage leukemia (MLL) skipped a 2193‐bp region within this exon. Nucleotide sequences of the cryptic splicing sites are shown, as are the positions of PCR primers used to confirm the alternative splicing. (c) Gel electrophoresis of the RT–PCR products obtained with total RNA isolated from KU812 cells and with either the F‐1 and R primer pair or the F‐2 and R primer pair. A 1‐kb ladder of DNA size markers was also included.
In addition to BCR–ABL1, we identified 72 independent candidates for fusion cDNA (including fusions to non‐coding RNA) from the CML cell lines. Surprisingly, however, the screening of fusion genes among the unselected cDNA of KCL‐22‐SR with our rather non‐stringent threshold (≥4 reads mapped to a candidate fusion point) failed to isolate BCR–ABL1 cDNA. We could not even detect any fusion candidates (involving one of our target genes in either or both ends of fusion events) from this dataset, while a total of nine candidates (including BCR–ABL1) were isolated from the captured cDNA of the same cell line.
Our Bowtie mapping of both ends of each read to human mRNA or genome databases (Fig. S1) resulted in the detection of not only BCR–ABL1 fusions, but also a large number of alternatively‐spliced messages. From the captured cDNA of KCL‐22‐SR, for instance, we could detect 79 alternatively‐spliced transcripts for 72 independent genes (data not shown). In contrast, from the unselected cDNA of the same cell line, only three independent, alternatively‐spliced transcripts were identified among three genes within the 913 targets.
One such example of alternatively‐spliced message was MLL (ensemble accession no.: ENST00000389506) in KU812, MEG‐01s, and K562 cells. In addition to a set of reads that completely matched exon 3 of MLL, we obtained reads that lacked an internal 2193‐bp sequence in exon 3 (Fig. 3b). Such in‐frame truncation would be expected to generate an MLL protein lacking amino acids 276–1006 of the wild‐type protein. To confirm the presence of such transcripts, we performed RT–PCR analysis with total RNA from KU812 cells, and PCR primers designed as in Figure 3b. The combination of the F‐1 and R primers would be expected to yield both the wild‐type (2536 bp) and truncated (343 bp) products, whereas that of the F‐2 and R primers would yield only the wild‐type product of 339 bp. Gel electrophoresis of the RT–PCR products confirmed the presence of the truncated mRNA (Fig. 3c). Given that the donor and acceptor sites for this alternative splicing harbor the consensus sequences for mRNA splicing (Fig. 3b), some CML cells likely make use of such cryptic splicing sites after MLL transcription.
Other variants. From the captured cDNA for KCL‐22‐SR, NCO2, MEG‐01s, K562, and KU812 cells, we detected 156, 18, 28, 23, and 21 non‐synonymous mutations among the 913 target genes, respectively. An analysis of the unselected cDNA from KCL‐22‐SR, however, identified only 19 mutations within the target genes, 16 of which were discovered in the captured cDNA as well. Comparison of the read sequences from the unselected KCL‐22‐SR cDNA to all RefSeq exonic sequences discovered a total of 597 non‐synonymous mutations.
Furthermore, 19, eight, four, 11, and two indels were detected with the captured cDNA of KCL‐22‐SR, NCO2, MEG‐01s, K562, and KU812, respectively. Most of the detected indels were only 1 bp in length, whereas the others were either 2 or 3 bp (Fig. S3). Detailed analysis of these nucleotide changes will be described elsewhere (Toshihide Ueno and Yoshihiro Yamashita, personal communication).
One of the most frequent genetic changes in the blast crisis of CML is point mutation or loss (or both) of TP53.( 21 ) Indeed, our sequence data for this gene revealed non‐synonymous point mutations in NCO2 and KU812 cells, a 1‐bp insertion in K562 cells, a 1‐bp deletion in KCL‐22‐SR cells, and a 3‐bp deletion in MEG‐01s cells (Fig. 4; Fig. S4; Table S3), all of which were confirmed by Sanger sequencing (data not shown). In NCO2 cells, for instance, 100% of TP53 reads harbored a G‐to‐C substitution at nucleotide position 993 of TP53 mRNA (GenBank accession no.: NM_000546), resulting in a glycine‐to‐arginine amino acid change (Fig. 4a). The data were also indicative of loss of heterozygosity for TP53 in NCO2 cells. Similarly, 75% or 78% of TP53 reads contained a C insertion or a CAC deletion in K562 (Fig. 4b) or MEG‐01s (Fig. S4) cells, respectively.
Figure 4.
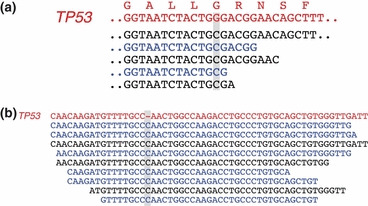
Anomalies in TP53 in CML cell lines. (a) Read sequences for NCO2 cells are shown aligned with the reference nucleotide and predicted amino acid sequences (red letters) for TP53, revealing a G‐to‐C substitution in all the reads. Sense or antisense strands are denoted in black and blue letters, respectively. (b) Alignment of the read sequences for K562 cells with the cDNA sequence of TP53 as in (a), revealing a C insertion.
Discussion
We have shown that a cDNA‐capture system, coupled with massively parallel sequencing, is a feasible and relatively simple approach to the simultaneous detection of point mutations, indels, and gene fusions in target cDNA. There are, however, both advantages and disadvantages of this technique compared with the conventional exon‐capture system for genomic DNA.
The ability to detect gene fusions, in addition to other mutations with a single sequencing reaction, is one of the most important benefits of the cDNA‐capture approach. Furthermore, the efficiency of exon capture with genomic DNA is dependent on the sequence context of each exon. The mean exon size for the human genome is only <200 bp, and the efficiency of exon purification is markedly affected by GC content and sequence complexity.( 22 ) In contrast, even exons with a high GC content might be well isolated by the cDNA‐capture system if adjacent exons have a normal GC content and are efficiently targeted by hybridization probes.
Levin et al. ( 20 ) conducted deep sequencing of captured cDNA for K562 cells, and identified five candidates for fusion genes in addition to BCR–ABL1. However, we could not detect any of the five candidates through our analysis with K562, probably because our 913 target genes did not contain those involved in the gene fusions in their report, other than nascent polypeptide‐associated complex alpha subunit (NACA). While Levin et al. discovered primase, DNA, polypeptide 1 (PRIM1)–NACA fusion transcripts, the low expression level of PRIM1–NACA in K562 (only 2.5% of that of BCR–ABL1 in their dataset)( 20 ) might account for the failure in our analysis.
However, for experiments based on capture of genomic DNA, sequencing a paired normal specimen allows the efficient subtraction of rare SNP not present in the current databases from the dataset of cancer tissue. This is not always the case, however, for the cDNA‐capture approach, given that gene expression profiles differ markedly among samples (even among those obtained from the same individual). Genes with sequence alterations in the cancer specimen might not be expressed in a given normal specimen, and it is not possible to readily determine whether such alterations are germ‐line polymorphisms, while algorithms to predict the effect on protein functions for a given amino acid change are currently available( 23 ) and synonymous‐to‐non‐synonymous ratio of nucleotide alterations for a given gene/dataset might provide clues as to how such changes are selected in tumor cells.( 24 )
In addition, the cDNA‐capture system cannot obtain a sufficient number of reads for genes expressed at a low level, and the overall sensitivity of cDNA capture is dependent on the total read number provided by sequencers. We are able to run only two samples per flow cell of the GAIIx system, whereas up to eight samples can be run in a single flow cell for whole exome sequencing of human genomic DNA.
Despite such limitations, our study shows that cDNA capture is an efficient process, and extensive sequencing of such purified cDNA is a straightforward approach to interrogate the target cDNA for various genetic changes in a single platform. Large‐scale resequencing of hundreds of cancer specimens might thus become within the scope of private laboratories with the adoption of the cDNA‐capture approach.
Disclosure Statement
K. Fukumura, M. Ando, M. Kawazu, Y.L. Choi and H. Mano belong to the Department of Medical Genomics, Graduate School of Medicine, University of Tokyo, which receives research funding from Illumina Inc.
Supporting information
Fig. S1. Algorithm of the computational pipeline.
Fig. S2. Read number distribution of all poly(A)‐RNA data.
Fig. S3. Numbers of 1‐, 2‐, or 3‐bp indels for the entire dataset.
Fig. S4. A CAG‐deletion in the TP53 message in MEG‐01s cells.
Table S1. Gene list for the custom cDNA‐capture system.
Table S2. Purification of the target cDNA in CML cell lines.
Table S3. TP53 mutation status in CML cell lines.
Supporting info item
Supporting info item
Supporting info item
Supporting info item
Supporting info item
Supporting info item
Supporting info item
Acknowledgments
This study was supported in part by grants for Research on Human Genome Tailor‐Made and for Third‐Term Comprehensive Control Research for Cancer from the Ministry of Health, Labor, and Welfare of Japan; Grants‐in‐Aid for Scientific Research (B) and for Young Scientists (A) from the Ministry of Education, Culture, Sports, Science, and Technology of Japan; and by grants from the Japan Society for the Promotion of Science, Takeda Science Foundation, the Naito Foundation, Sankyo Foundation of Life Science, The Sagawa Foundation for Promotion of Cancer Research, the Yasuda Medical Foundation, the Mitsubishi Foundation, and Kobayashi Foundation for Cancer Research.
References
- 1. Stratton MR, Campbell PJ, Futreal PA. The cancer genome. Nature 2009; 458: 719–24. [DOI] [PMC free article] [PubMed] [Google Scholar]
- 2. Mardis ER. A decade’s perspective on DNA sequencing technology. Nature 2011; 470: 198–203. [DOI] [PubMed] [Google Scholar]
- 3. Ledford H. Big science: the cancer genome challenge. Nature 2010; 464: 972–4. [DOI] [PubMed] [Google Scholar]
- 4. Pleasance ED, Cheetham RK, Stephens PJ et al. A comprehensive catalogue of somatic mutations from a human cancer genome. Nature 2010; 463: 191–6. [DOI] [PMC free article] [PubMed] [Google Scholar]
- 5. Ley TJ, Mardis ER, Ding L et al. DNA sequencing of a cytogenetically normal acute myeloid leukaemia genome. Nature 2008; 456: 66–72. [DOI] [PMC free article] [PubMed] [Google Scholar]
- 6. Totoki Y, Tatsuno K, Yamamoto S et al. High‐resolution characterization of a hepatocellular carcinoma genome. Nat Genet 2011; 43: 464–9. [DOI] [PubMed] [Google Scholar]
- 7. Wei X, Walia V, Lin JC et al. Exome sequencing identifies GRIN2A as frequently mutated in melanoma. Nat Genet 2011; 43: 442–6. [DOI] [PMC free article] [PubMed] [Google Scholar]
- 8. Otto EA, Hurd TW, Airik R et al. Candidate exome capture identifies mutation of SDCCAG8 as the cause of a retinal‐renal ciliopathy. Nat Genet 2010; 42: 840–50. [DOI] [PMC free article] [PubMed] [Google Scholar]
- 9. Bilguvar K, Ozturk AK, Louvi A et al. Whole‐exome sequencing identifies recessive WDR62 mutations in severe brain malformations. Nature 2010; 467: 207–10. [DOI] [PMC free article] [PubMed] [Google Scholar]
- 10. Mitelman F. Recurrent chromosome aberrations in cancer. Mutat Res 2000; 462: 247–53. [DOI] [PubMed] [Google Scholar]
- 11. Soda M, Choi YL, Enomoto M et al. Identification of the transforming EML4–ALK fusion gene in non‐small‐cell lung cancer. Nature 2007; 448: 561–6. [DOI] [PubMed] [Google Scholar]
- 12. Tomlins SA, Rhodes DR, Perner S et al. Recurrent fusion of TMPRSS2 and ETS transcription factor genes in prostate cancer. Science 2005; 310: 644–8. [DOI] [PubMed] [Google Scholar]
- 13. Ohmine K, Nagai T, Tarumoto T et al. Analysis of gene expression profiles in an imatinib‐resistant cell line, KCL22/SR. Stem Cells 2003; 21: 315–21. [DOI] [PubMed] [Google Scholar]
- 14. Drexler HG, MacLeod RA, Uphoff CC. Leukemia cell lines: in vitro models for the study of Philadelphia chromosome‐positive leukemia. Leuk Res 1999; 23: 207–15. [DOI] [PubMed] [Google Scholar]
- 15. Choi YL, Tsukasaki K, O’Neill MC et al. A genomic analysis of adult T‐cell leukemia. Oncogene 2007; 26: 1245–55. [DOI] [PubMed] [Google Scholar]
- 16. Langmead B, Trapnell C, Pop M, Salzberg SL. Ultrafast and memory‐efficient alignment of short DNA sequences to the human genome. Genome Biol 2009; 10: R25. [DOI] [PMC free article] [PubMed] [Google Scholar]
- 17. Altschul SF, Gish W, Miller W, Myers EW, Lipman DJ. Basic local alignment search tool. J Mol Biol 1990; 215: 403–10. [DOI] [PubMed] [Google Scholar]
- 18. Li H, Durbin R. Fast and accurate short read alignment with Burrows–Wheeler transform. Bioinformatics 2009; 25: 1754–60. [DOI] [PMC free article] [PubMed] [Google Scholar]
- 19. Fujita PA, Rhead B, Zweig AS et al. The UCSC Genome Browser database: update 2011. Nucleic Acids Res 2011; 39: D876–82. [DOI] [PMC free article] [PubMed] [Google Scholar]
- 20. Levin JZ, Berger MF, Adiconis X et al. Targeted next‐generation sequencing of a cancer transcriptome enhances detection of sequence variants and novel fusion transcripts. Genome Biol 2009; 10: R115. [DOI] [PMC free article] [PubMed] [Google Scholar]
- 21. Calabretta B, Perrotti D. The biology of CML blast crisis. Blood 2004; 103: 4010–22. [DOI] [PubMed] [Google Scholar]
- 22. Shen P, Wang W, Krishnakumar S et al. High‐quality DNA sequence capture of 524 disease candidate genes. Proc Natl Acad Sci USA 2011; 108: 6549–54. [DOI] [PMC free article] [PubMed] [Google Scholar]
- 23. Adzhubei IA, Schmidt S, Peshkin L et al. A method and server for predicting damaging missense mutations. Nat Methods 2010; 7: 248–9. [DOI] [PMC free article] [PubMed] [Google Scholar]
- 24. Babenko VN, Basu MK, Kondrashov FA, Rogozin IB, Koonin EV. Signs of positive selection of somatic mutations in human cancers detected by EST sequence analysis. BMC Cancer 2006; 6: 36. [DOI] [PMC free article] [PubMed] [Google Scholar]
Associated Data
This section collects any data citations, data availability statements, or supplementary materials included in this article.
Supplementary Materials
Fig. S1. Algorithm of the computational pipeline.
Fig. S2. Read number distribution of all poly(A)‐RNA data.
Fig. S3. Numbers of 1‐, 2‐, or 3‐bp indels for the entire dataset.
Fig. S4. A CAG‐deletion in the TP53 message in MEG‐01s cells.
Table S1. Gene list for the custom cDNA‐capture system.
Table S2. Purification of the target cDNA in CML cell lines.
Table S3. TP53 mutation status in CML cell lines.
Supporting info item
Supporting info item
Supporting info item
Supporting info item
Supporting info item
Supporting info item
Supporting info item