

Abstract
Transforming growth factor‐β (TGF‐β)‐stimulated clone‐22 (TSC‐22), also called TSC22D1‐2, is a putative tumor suppressor. We previously identified TSC‐22 downstream of an active mutant of fms‐like tyrosine kinase‐3 (Flt3). Here, we show that TSC‐22 works as a tumor suppressor through inhibiting Ras/Raf signaling. Notably, TSC‐22 was upregulated by Ras/Raf activation, whereas its upregulation was inhibited by concurrent STAT5 activation. Although TSC‐22 was normally retained in the cytoplasm by its nuclear export signal (NES), Ras/Raf activation caused nuclear translocation of TSC‐22, but not TSC22D1‐1. Unlike glucocorticoid‐induced leucine zipper (GILZ/TSC22D3‐2) previously characterized as a negative regulator of Ras/Raf signaling, TSC‐22 failed to interact physically with Ras/Raf. Importantly, transduction with TSC‐22, but not TSC22D1‐1, suppressed the growth, transformation and tumorigenesis of NIH3T3 cells expressing oncogenic H‐Ras: this suppression was enhanced by transduction with a TSC‐22 mutant lacking NES that had accumulated in the nucleus. Collectively, upregulation and nuclear translocation of TSC‐22 played an important role in the feedback suppression of Ras/Raf signaling. Consistently, TSC22D1‐deficient mice were susceptible to tumorigenesis in a mouse model of chemically‐induced liver tumors bearing active mutations of Ras/Raf. Thus, TSC‐22 negatively regulated Ras/Raf signaling through a mechanism different from GILZ, implicating TSC‐22 as a novel suppressor of oncogenic Ras/Raf‐induced tumors. (Cancer Sci 2012; 103: 26–33)
The gene encoding transforming growth factor β (TGF‐β)‐stimulated clone‐22 (TSC‐22) was originally isolated as a TGF‐β‐inducible gene.( 1 ) The TSC‐22 domain (TSC22D) family of leucine zipper protein includes TSC22D1, TSC22D2, TSC22D3 and TSC22D4. TSC‐22, also called TSC22D1‐2, is a short isoform of TSC22D1 including two splice variants, whereas TSC22D1‐1 is a long splice variant.( 2 , 3 , 4 ) Glucocorticoid‐induced leucine zipper (GILZ), also called TSC22D3‐2, is a splice variant of TSC22D3.( 4 , 5 , 6 , 7 ) TSC‐22 contains a nuclear export signal (NES) at the N‐terminus, followed by a TSC‐box and a leucine zipper motif.( 2 , 3 , 8 , 9 ) TSC‐22 homodimerizes or heterodimerizes with other transcription factors.( 10 ) Forced expression of TSC‐22 induces growth suppression, apoptosis or differentiation in several tumor/leukemia cell lines.( 11 , 12 , 13 , 14 ) Interestingly, expression of TSC‐22 was downregulated in several cancers.( 15 , 16 , 17 ) In addition, TSC‐22 was epigenetically silenced in large granular lymphocyte leukemia.( 14 ) In contrast, TSC‐22 was upregulated by many different stimuli.( 1 , 2 ) However, the mechanism underlying the transcriptional upregulation of TSC‐22 has remained obscure. We recently reported that TSC‐22 was upregulated by an active mutant of FMS‐like tyrosine kinase‐3 (Flt3) harboring a point mutation in the kinase domain (Flt3‐TKD).( 13 ) In contrast, a Flt3 active mutant harboring an internal tandem duplication in the juxtamembrane domain (Flt3‐ITD) did not significantly increase TSC‐22 expression.( 13 ) According to extensive research, both Flt3‐TKD and Flt3‐ITD constitutively activate both Ras and the signal transducer and activator of transcription 5 (STAT5), but STAT5 activation is prominent in the signaling pathway downstream of Flt3‐ITD as compared with Flt3‐TKD.( 18 , 19 , 20 , 21 ) Therefore, we hypothesized that TSC‐22 expression was regulated by Ras and/or STAT5 activation.
Constitutive activation of Ras/Raf/MEK/ERK signaling pathways promotes tumorigenesis; oncogenic Ras or B‐Raf mutations are found in 30 or 8%, respectively, of human cancers.( 22 , 23 , 24 , 25 , 26 , 27 ) Intriguingly, GILZ serves as a negative regulator of Ras signaling, through its direct binding to both Ras and Raf.( 28 , 29 ) However, the impact of TSC‐22 on Ras signaling remains to be resolved. In the present study, we delineated that TSC‐22 was a novel negative‐feedback regulator of Ras/Raf signaling.
Materials and Methods
Cells. Ba/F3 cells, Ba/F3‐Δraf(DD)14 (kindly provided by Takaya Satoh, Kobe University, Japan and Martin McMahon, UCSF, USA), NIH3T3 cells, 293T cells and Plat‐E cells were maintained, as described previously.( 13 , 30 , 31 )
Reagents. Cytokines were obtained from R&D Systems (Minneapolis, MN, USA). Mouse anti‐Ras Ab (clone RAS10) was from Millipore (Billerica, MA, USA). Rabbit anti‐TSC‐22 Ab was generated as described previously.( 13 ) All other reagents were from Sigma‐Aldrich (Saint Louis, MO, USA) unless stated otherwise.
DNA constructs. The cDNA fragment of TSC‐22, TSC22D1‐1 or GILZ was tagged with a Flag epitope at the C terminus. The resultant TSC‐22‐, TSC22D1‐1‐, or GILZ‐Flag was subcloned into pMXs‐IRES‐puror (pMXs‐IP) to generate pMXs‐TSC‐22‐, TSC22D1‐1‐ or GILZ‐Flag‐IP. Deletion mutants of TSC‐22‐Flag, TSC‐22‐ΔNES‐Flag and TSC‐22‐Δbox‐Flag, were generated by PCR, using pMXs‐TSC‐22‐Flag‐IP as a template and mutant synthetic oligonucleotides as primers: TSC‐22‐ΔNES‐Flag was devoid of the N‐terminal region (1–33 amino acids) containing NES; TSC‐22‐Δbox‐Flag was devoid of a TSC‐box (34–64 amino acids). Fag‐tagged TSC‐22 mutants were subcloned into pMXs‐IP to generate pMXs‐TSC‐22‐ΔNES‐Flag‐IP or pMXs‐TSC‐22‐Δbox‐Flag‐IP. An oncogenic H‐Ras‐G12V, K‐Ras‐G12V or M‐Ras‐G22V generated using two‐step PCR methods was subcloned into pMXs‐IRES‐blasticidiner (pMXs‐IB) to generate pMXs‐H‐Ras‐G12V, pMXs‐K‐Ras‐G12V or pMXs‐M‐Ras‐G22V‐IB. Other plasmids have been described previously.( 13 , 20 , 32 , 33 )
Transfection and infection. Retroviral transfection was performed as described previously.( 13 , 33 , 34 )
Diethylnitrosamine‐induced liver tumor model. WT and TSC22D1‐deficient mice on a C57BL/6 background were housed according to the guidelines of the Institute of Medical Science, University of Tokyo. All procedures were approved by an institutional review committee. For hepatocarcinogenesis, male mice were intraperitoneally injected with 25 mg/kg of diethylnitrosamine (DEN) (Sigma‐Aldrich) at 15 days of age. These mice were observed for development of tumors, and were killed at 8 months of age for assessment of liver tumors, as described previously.( 35 , 36 , 37 ) Briefly, the largest lobes were removed and fixed in 4% paraformaldehyde overnight. For each mouse, externally visible tumors larger than 0.5 mm were counted, and the maximum tumor diameter was measured.
Immunoprecipitation and western blot analysis. Immunoprecipitation and Western blotting were performed as described previously.( 13 )
Analysis of cell growth. Cell growth was estimated by quantitating luminescence, as described previously.( 13 )
Gene expression analysis. Real‐time reverse transcription‐polymerase chain reaction was performed, as described previously.( 38 ) cDNA was amplified under the following conditions: one cycle of 95°C for 10 s, 40 cycles of 95°C for 5 s and 60°C for 25 s. All samples were independently analyzed at least three times. The following primers were used: 5′‐ATCCCAATGGTGTAGACCAGAGA‐3′ and 5′‐ACACTTGC ACCAGAGCTATT‐3′ for TSC‐22; 5′‐CGTTTCTTCCTCTCCTGTTGCT‐3′ and 5′‐CTGTGCAAGTCCATCGACCT‐3′ for TSC22D1‐1; 5′‐CATCACTATTGGCAACGAGC‐3′ and 5′‐ACGCAGCTCAGTAACAGTCC‐3′ for β‐actin.
In vitro and in vivo transformation assays. For focus‐formation assays, NIH3T3 cells transfected with indicated plasmids were cultured for 2 weeks without antibiotic selection, and focus‐formation was visualized by crystal violet staining and counted. For soft agar colony formation assays or tumor formation assays, we first generated a pool of NIH3T3 cells that had been infected with retroviruses harboring H‐Ras‐G12V and selected with blasticidine. Then, H‐Ras‐G12V‐transduced NIH3T3 cells were further infected with retroviruses harboring TSC‐22 WT or mutants and selected with puromycin. We used a pool of the transduced cells in the experiments. For soft agar colony formation assays, proliferation at 3 weeks after a semisolid culture was assessed by manual counting of colonies generated by the transduced NIH3T3 cells. For tumor formation assays, NOD/SCID mice (Charles River Laboratories, Yokohama, Japan) were subcutaneously inoculated with equal numbers (2 × 10⁶) of the transduced NIH3T3 cells. At the indicated time, the mice were killed and tumor weights were measured.
Immunostaining. Immunostaining of 293T cells transiently transfected with indicated expression plasmids was performed, as described previously.( 38 )
Statistical analysis. Statistical significance was calculated using the Student t‐test for independent variables in Excel (Microsoft). P‐values <0.05 were considered statistically significant.
Results
Ras/Raf activation upregulated TSC‐22, while concurrent signal transducer and activator of transcription 5 activation was able to inhibit its upregulation. We have previously shown that TSC‐22 is upregulated by Flt3‐TKD, but not Flt3‐ITD.( 13 ) To address the underlying mechanism, we first examined whether the active mutant of Ras or STAT5 affected TSC‐22 expression as both Ras and STAT5 are key effectors downstream of Flt3 active mutants.( 19 , 21 ) By using RT‐PCR analysis, we confirmed that TSC‐22 transcript levels were higher in Flt3‐TKD‐transduced Ba/F3 cells as compared with Flt3‐ITD‐transduced or mock‐transduced Ba/F3 cells (Fig. 1A). Notably, TSC‐22 transcript levels of Ba/F3 cells expressing active mutant of H‐Ras were much higher than those of mock‐transduced Ba/F3 cells, indicating that H‐Ras activation upregulated TSC‐22 (Fig. 1A). In contrast, transduction with the active mutant of STAT5 lowered transcript levels of TSC‐22 in Ba/F3 cells (Fig. 1A). Consistently, transient expression of oncogenic H‐Ras induced the transcriptional activation of TSC‐22 promoter in 293T cells (Fig. S1A). As illustrated by Western blot analysis, transduction with oncogenic K‐Ras and M‐Ras as well as H‐Ras led to the upregulation of TSC‐22 at protein levels in Ba/F3 cells (Fig. 1B). In addition, TSC‐22 protein levels were higher in oncogenic H‐Ras‐transduced NIH3T3 cells as compared with mock‐transduced NIH3T3 cells (Fig. 1C). Expression of oncogenic Ras proteins transduced into Ba/F3 cells or NIH3T3 cells was confirmed by using anti‐Ras Ab (Fig. 1B,C). Collectively, these results indicate that Ras activation upregulated TSC‐22 at both transcript and protein levels independently of cell type. In contrast, Flt3‐ITD, Flt3‐TKD or active mutant of H‐Ras or STAT5 did not significantly change the expression of TSC22D1‐1, a long splice variant of TSC22D1 (Fig. 1A). To examine whether activation of Raf/MEK/ERK signaling downstream of Ras was involved in the upregulation of TSC‐22, we applied a system in which β‐estradiol stimulation induces Raf activation in Ba/F3 cells.( 31 ) Remarkably, treatment with β‐estradiol induced ERK phosphorylation as well as the upregulation of TSC‐22 at protein levels 4–8 h after the stimulation (Fig. S1B). These results indicated that Ras activation upregulated TSC‐22 mainly through Raf/MEK/ERK signaling pathways. In contrast, Ras activation did not upregulate GILZ (Fig. S2). Based on the finding that STAT5 activation was prominent in the signaling downstream of Flt3‐ITD as compared with Flt3‐TKD,( 19 , 20 , 21 ) we speculated that the marked activation of STAT5 in Flt3‐ITD‐expressing cells is responsible for the downregulation of TSC‐22. Indeed, further transduction with the active mutant of STAT5 downregulated TSC‐22 at transcript levels in Flt3‐TKD‐expressing or oncogenic H‐Ras‐expressing Ba/F3 cells (Fig. 1D,E). Taken together, Ras/Raf activation upregulated TSC‐22, whereas concurrent STAT5 activation was able to inhibit its upregulation.
Figure 1.
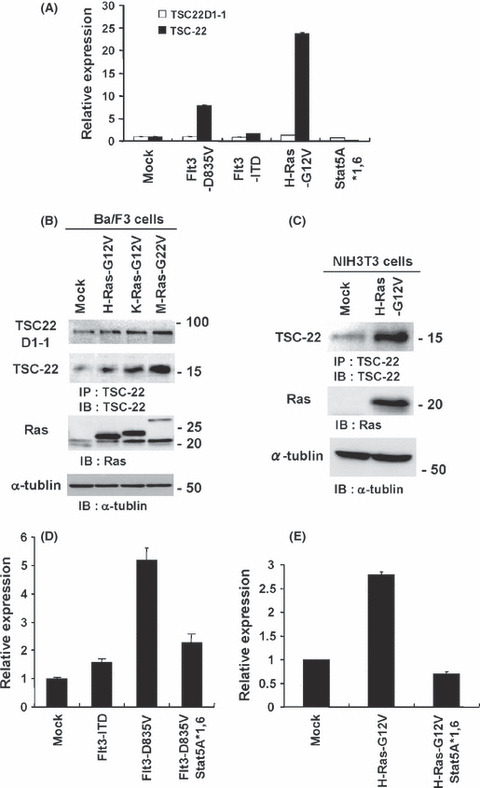
Ras activation upregulated TSC‐22, while STAT5 activation suppressed the upregulation. (A) Relative expression levels of TSC‐22 or TSC22D1‐2 of Ba/F3 cells transduced with Flt3‐D835V, Flt3‐ITD, H‐Ras‐G12V, STAT5A1*6 or mock were estimated by using RT‐PCR. (B and C) Lysates of Ba/F3 cells transduced with H‐Ras‐G12V, K‐Ras‐G12V, M‐Ras‐G12V or mock (first and second panel in B) and lysates of NIH3T3 cells transduced with H‐Ras‐G12V or mock (first panel in C) were immunoprecipitated with anti‐TSC‐22Ab, followed by immunoblotting with the same Ab. Cell lysates were immunoblotted with anti‐Ras Ab (third panel in B, second panel in C) or anti‐α‐tublin Ab (fourth panel in B, third panel in C). (D and E) Relative expression levels of TSC‐22 among Ba/F3 cells transduced with Flt3‐ITD, Flt3‐D835V, Flt3‐D835V plus STAT5A1*6, or mock (D) or Ba/F3 cells transduced with H‐Ras‐G12V, H‐Ras‐G12V plus STAT5A1*6, or mock (E), estimated using RT‐PCR. (A–E) Data are representative of three independent experiments.
Enforced expression of TSC‐22, but not TSC22D1‐1, suppressed the growth, transformation and tumorigenesis of NIH3T3 cells expressing oncogenic H‐Ras. We found the growth‐suppressive effect of TSC‐22 in non‐hematopoietic NIH3T3 cells as well as in several hematopoietic cell lines.( 13 ) Notably, transduction with TSC22D1‐1 did not affect the growth in NIH3T3 cells (Fig. S3). These results imply that TSC22D1 variants (TSC22 and TSC22D1‐1) have different effects on cell growth. Moreover, cell cycle and apoptosis analysis showed that TSC‐22 inhibited the growth of NIH3T3 cells by both suppressing proliferation and promoting apoptosis (data not shown). We next asked whether TSC‐22 modulated Ras/Raf signaling after being upregulated by Ras/Raf activation. Similar to parental NIH3T3 cells, oncogenic H‐Ras‐expressing NIH3T3 cells suffered growth suppression by further transduction with TSC‐22, but not TSC22D1‐1 (Fig. 2B). We also note the suppressive effect of TSC‐22 on the oncogenic H‐Ras‐induced transforming activity. As shown in Figure 2(C), the number of transformation foci induced by oncogenic H‐Ras in NIH3T3 cells was lowered by co‐transfection with the TSC‐22 expression vector at levels comparable to that with the GILZ expression vector. In contrast, co‐transfection with the TSC‐22 expression vector did not affect the oncogenic Src‐induced transforming activity (Fig. 2D), indicating that the role of TSC‐22 in the suppression of oncogenic transformation is specific to Ras‐induced transformation. Of note, TSC22D1‐1 failed to impact on the oncogenic Ras‐induced and Src‐induced transforming activity (Fig. 2C,D). Anchorage‐independent colony formation of oncogenic H‐Ras‐transduced NIH3T3 cells in soft agar was also suppressed by transduction with TSC‐22 (Fig. 2E). Importantly, small interference RNA treatment of oncogenic H‐Ras‐transduced NIH3T3 cells with TSC‐22 oligonucleotides, but not nonspecific oligonucleotides, decreased protein expression of TSC‐22 (Fig. S4), and enhanced the growth and anchorage‐independent colony formation of these cells (Fig. S5). These results indicate that TSC‐22, but not TSC22D1‐1, negatively regulated oncogenic H‐Ras signaling in vitro. To further explore whether TSC‐22 inhibited oncogenic H‐Ras‐induced tumorigenesis, we subcutaneously injected equal numbers of NIH3T3 cells transduced with oncogenic H‐Ras alone or with TSC‐22 or TSC22D1‐1 into the flanks of immunocompromised mice. After injection, subcutaneous tumors grew rapidly in the mice injected with NIH3T3 cells transduced with oncogenic H‐Ras alone or oncogenic H‐Ras with TSC22D1‐1. In contrast, the growth of tumors formed by NIH3T3 cells expressing oncogenic H‐Ras with TSC‐22 appeared to be slow. Consistent with these observations, the mice inoculated with NIH3T3 cells expressing oncogenic H‐Ras with TSC‐22 had tumors of significantly lower weight compared with those inoculated with NIH3T3 cells expressing oncogenic H‐Ras alone or oncogenic H‐Ras with TSC22D1‐1 (Figs. 3A,B). These results indicate that TSC‐22, but not TSC22D1‐1, suppressed the in vivo tumorigenesis of NIH3T3 cells expressing oncogenic H‐Ras.
Figure 2.
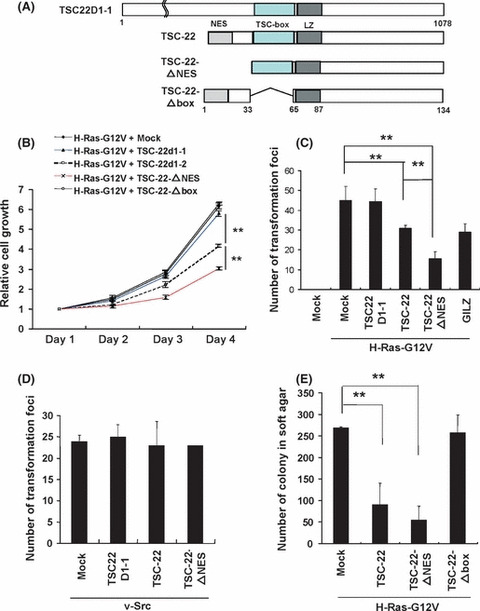
TSC‐22‐mediated suppression of the growth and transformation of NIH3T3 cells expressing oncogenic H‐Ras was enhanced by the deletion of a nuclear export signal (NES). (A) Schematic of TSC22D1‐1, TSC‐22 and TSC‐22 mutants. The domain of NES, TSC‐box or leucine zipper (LZ) is indicated. (B) The growth of NIH3T3 cells transduced with H‐Ras‐G12V plus TSC22D1‐1, TSC‐22, TSC‐22‐ΔNES, TSC‐22‐Δbox or mock. The means and the SD are shown, representing three independent experiments. (C) NIH3T3 cells were transfected with pMXs‐H‐Ras‐G12V‐IB plus pMXs‐TSC22D1‐1‐, TSC‐22‐, TSC‐22‐ΔNES‐, or GILZ, glucocorticoid‐induced leucine zipper.(GILZ)‐Flag‐IP or pMXs‐IP, or pMXs‐IB plus pMXs‐IB. (D) NIH3T3 cells were transfected with pBabe‐puro‐v‐Src together with pMXs‐TSC22D1‐1‐, TSC‐22‐, or TSC‐22‐ΔNES‐Flag‐IP or pMXs‐IP. The number of the foci in each dish was measured 14 days after transfection. (E) NIH3T3 cells transduced with H‐Ras‐G12V plus TSC‐22‐Flag, TSC‐22‐ΔNES‐Flag, TSC‐22‐Δbox‐Flag or mock were cultured in soft agar for 21 days. The number of the colony in each dish was measured. (C–E) The means and SD of four dishes, representing three independent experiments, are shown. **Levels of significance where P < 0.01.
Figure 3.
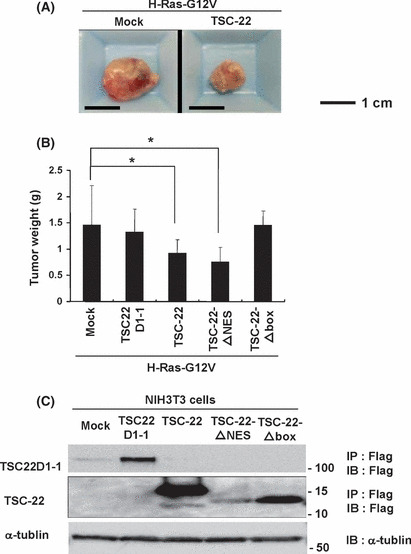
In vivo growth of NIH3T3 cells expressing H‐Ras‐G12V was suppressed by enforced expression of TSC‐22. (A) Representative appearance of the tumors expressing H‐Ras‐G12V plus TSC‐22 (right) or mock (left). Scale bar, 1 cm. (B) Equal number of NIH3T3 cells transduced with H‐Ras‐G12V plus TSC22D1‐1, TSC‐22, TSC22‐ΔNES, TSC‐22‐Δbox or mock were subcutaneously injected into NOD‐SCID mice (eight per group). Tumor weights were measured 20 days after injection. The mean and the SD of each group are shown, representing two independent experiments. *Levels of significance where P < 0.05. (C) Expression of TSC22D1‐1, TSC‐22, TSC‐22‐ΔNES or TSC‐22‐Δbox in the transduced NIH3T3 cells. Cell lysates were immunoprecipitated with anti‐Flag Ab followed by immunoblotting with anti‐Flag Ab (first and second panel) or immunoblotted with anti‐α‐tublin Ab (third panel). Data are representative of three independent experiments.
TSC‐22‐mediated suppression of Ras/Raf signaling was dampened by the deletion of a TSC‐box, while it was enhanced by the deletion of a nuclear export signal. To explore which domain of TSC‐22 played an important role in the suppression of Ras/Raf signaling, we constructed a TSC‐22 mutant lacking an NES (TSC‐22‐ΔNES) or a TSC‐box (TSC‐22‐Δbox) (Fig. 2A). Expression of TSC‐22 mutants in the transduced NIH3T3 cells was confirmed by using anti‐Flag Ab (Fig. 3C). Interestingly, the deletion of a TSC‐box dampened the suppressive effect of TSC‐22 on the growth and tumorigenesis of NIH3T3 cells expressing oncogenic H‐Ras (2, 3), indicating that a TSC‐box played a critical role in the suppressive function of TSC‐22. In contrast, the deletion of an NES tended to enhance the ability of TSC‐22 to suppress oncogenic H‐Ras‐induced activation events (2, 3). These results indicated that the localization of TSC‐22 was closely related to its function. To confirm this, 293T cells transiently expressing a Flag‐tagged TSC‐22, TSC22D1‐1 or TSC22‐ΔNES were immunostained with anti‐Flag Ab. Microscopic examination showed that both TSC‐22 and TSC22D1‐1 were localized in the cytoplasm under steady state conditions, while TSC22‐ΔNES was expressed in the nucleus as well as in the cytoplasm (Fig. 4A,B). Therefore, TSC‐22 was normally retained in the cytoplasm by its NES, which is in accordance with the previous reports.( 9 ) We next asked if Ras/Raf activation affected the localization of TSC‐22. After Flag‐tagged TSC‐22 or TSC22D1‐1 together with oncogenic H‐Ras or mock were transiently expressed in 293T cells, we performed similar experiments by using anti‐Flag Ab or anti‐Ras Ab. As shown in Fig. 4B, H‐Ras activation induced nuclear translocation of TSC‐22, but not of TSC22D1‐1, although oncogenic H‐Ras was substantially localized in the cytoplasm. In addition, transient expression of an active mutant of Raf also caused the nuclear translocation of TSC‐22, whereas that of the active mutant of STAT5 did not (Fig. S6). Although it has been reported that GILZ negatively regulates Ras/Raf signaling through its binding to Ras or Raf,( 28 , 29 ) we were not able to detect any physical interaction of TSC‐22 and Ras/Raf in the immunoprecipitation experiments (Fig. S7 and data not shown). Therefore, Ras/Raf activation led to the translocation of TSC‐22, but not TSC22D1‐1, from the cytosol to the nucleus, where TSC‐22 negatively regulated Ras/Raf signaling by a mechanism different from GILZ.
Figure 4.
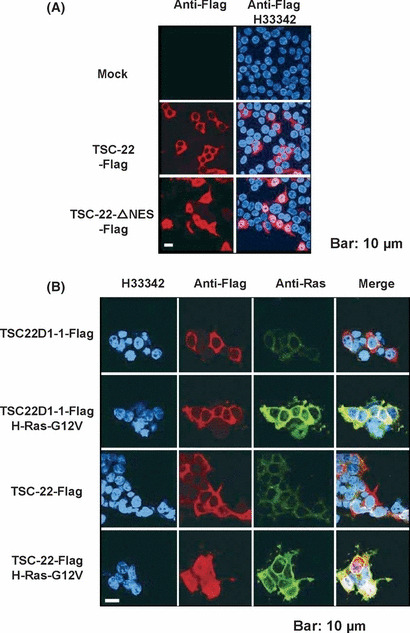
Ras activation induced the nuclear translocation of TSC‐22, but not TSC22D1‐1 in 293T cells. (A) 293T cells were transiently transfected with pMXs‐TSC22‐ or TSC22‐ΔNES‐Flag‐IP or pMXs‐IP. After 48 h, the cells were stained with mouse anti‐Flag Ab (M2), followed by secondary staining with Alexa Fluor 546‐conjugated goat anti‐mouse IgG Ab. (B) The 293T cells were transiently transfected with pMXs‐H‐Ras‐G12V‐IB or pMXs‐IB together with pMXs‐TSC22D1‐1‐ or TSC‐22‐Flag‐IP. After 48 h, the cells were stained with rabbit anti‐Flag Ab or mouse anti‐Ras Ab, followed by secondary staining with Alexa Fluor 546‐conjugated goat anti‐rabbit IgG Ab or Alexa Fluor 488‐cnjugated goat anti‐mouse IgG Ab, respectively. Nuclei were counterstained with Hoechst (H33342). Fluorescent images were examined using a laser confocal microscope. The data shown are representative of five independent experiments. Scale bar, 10 μm.
TSC22D1‐deficient mice were susceptible to tumorigenesis in a mouse model of carcinogen‐induced liver tumors involving B‐Raf mutations. For further analysis, we used TSC22D1‐deficient mice in which retroviral insertion in the first intron of TSC‐22 disrupted expression of both TSC22D1‐1 and TSC‐22 (TSC22D1‐2) (Data S1 and Fig. S8).( 39 , 40 ) Indeed, Western blot analysis showed that protein expression of both TSC22D1‐1 and TSC‐22 were absent in brain lysates of TSC22D1‐deficient mice (Fig. S8C). TSC22D1‐deficient mice were born at the expected Mendelian ratio and showed no obvious abnormalities, including spontaneous tumors. We next asked whether the negative‐feedback effect of TSC‐22 on Ras/Raf signaling was implicated in the formation of tumors induced by active mutations of Ras/Raf. To this end, we compared N‐nitrosodiethylamine (DEN)‐induced hepatocartinogenesis in WT and in TSC22D1‐deficient mice, because it had been reported that most of C57BL/6 mice developed B‐Raf‐mutated hepatocellular carcinoma (HCC) where the downstream signaling was constitutively activated.( 35 , 37 , 41 ) In fact, B‐Raf mutation (B‐Raf(V637E)) was observed in HCC samples derived from the WT mice (n = 3) and TSC22D1‐deficient mice (N = 4) (data not shown). We found that WT mice developed liver tumors of varying numbers and sizes 8 months after treatment with DEN. Measurement revealed that the tumors formed in TSC22D1‐deficient mice were significantly larger and more numerous than those in WT mice (Fig. 5A,B). Considering that TSC‐22, but not TSC22D1‐1, negatively regulated Ras/Raf signaling, the enhancement of DEN‐induced hepatocarcinogenesis in TSC22D1‐deficient mice was presumably due to the lack of TSC‐22, but not TSC22D1‐1. These results, taken together, implicate TSC‐22 as a suppressor of tumors bearing Ras/Raf mutations.
Figure 5.
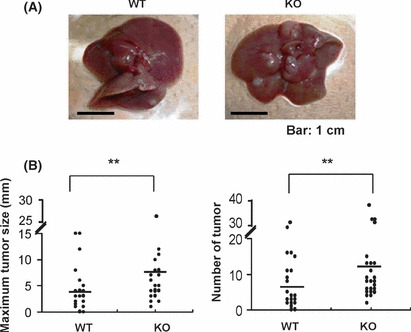
TSC22D1‐deficient mice were susceptible to tumorigenesis in a mouse model of DEN‐induced liver tumors involving B‐Raf mutations. (A) WT and TSC22D1‐deficient male mice were killed to measure the number and maximum size of DEN‐induced tumors. Representative photograph of livers derived from WT and TSC22D1‐deficient mice. Scale bar, 1 cm. (B) Maximum size (left panel) and number (right panel) of DEN‐induced tumors are shown in each of WT mice or TSC22D1‐deficient mice. The mean maximum size and number in WT mice (n = 15) or TSC22D1‐deficient mice (n = 15) is indicated. **Levels of significance where P < 0.01.
Discussion
In the present study, we delineated a novel mechanism to regulate TSC‐22 expression: Ras/Raf activation upregulated TSC‐22 at both transcription and protein levels, while the prominent activation of STAT5 counteracted with Ras‐induced upregulation of TSC‐22. These results explain why TSC‐22 expression was differently regulated by the two types of Flt3 active mutants. Of note, TSC22D1‐1 expression was not significantly affected by Ras/Raf and/or STAT5 activation. Taken together, it is likely that TSC‐22 expression is regulated by the balance of Ras/Raf and STAT5 activation in the cells. However, we cannot rule out the involvement of other signaling pathways in regulating TSC‐22 expression. Because GILZ (TSC22D3‐2) was reported to negatively regulate Ras/Raf signaling, we speculated that TSC‐22 was a negative regulator of Ras/Raf signaling as well.( 28 , 29 ) Indeed, this hypothesis was supported by our observations that enforced expression of TSC‐22 inhibited the growth, transformation and tumorigenesis of NIH3T3 cells expressing oncogenic H‐Ras and that knockdown of TSC‐22 enhanced the growth and anchorage‐independent colony formation of oncogenic H‐Ras‐transduced NIH3T3 cells. However, we were not able to detect the physical binding of TSC‐22 to Ras, Raf or ERK in our co‐immunoprecipitation experiments (Fig. S7 and data not shown). The binding of GILZ to Ras or Raf was reported to be responsible for the GILZ‐mediated suppression of Ras/Raf signaling, and a TSC‐box or an N‐terminal region is required for the binding of GILZ to Ras or Raf, respectively.( 28 , 29 ) The differing capacities to bind Ras/Raf might be explained by the structural difference of a TSC‐box or an N‐terminal region between TSC‐22 and GILZ. In any case, these results suggested that different mechanisms were involved in the negative regulation of Ras/Raf signaling by TSC‐22 or GILZ. Understanding of the relevant mechanism in the case of TSC‐22 was facilitated by analyzing TSC‐22 mutants, TSC‐22‐ΔNES and TSC‐22‐Δbox. Obviously, the deletion of a TSC‐box failed to induce the suppression of Ras/Raf signaling. Thus, a TSC‐box was pivotal in this function of TSC‐22. However, it seemed that the deletion of NES led to the nuclear retention of TSC‐22 and the acceleration of TSC‐22‐mediated suppression of Ras/Raf activation events. In addition, TSC‐22 was localized in the cytoplasm under steady‐state conditions, whereas Ras/Raf activation robustly induced the nuclear translocation of TSC‐22. These results illustrate that nuclear localization of TSC‐22 was necessary for the efficient suppression of Ras/Raf signaling.
Before analyzing TSC22D1‐deficient mice, in which expression of both TSC‐22 and TSC22D1‐1 was lost, we carefully examined the in vitro function of TSC22D1‐1 in comparison to TSC‐22. The differences between TSC22D1‐1 and TSC‐22 in our experimental results provided evidence that TSC22D1‐1 was not involved in the negative‐feedback regulation of Ras/Raf signaling. Based on this notion, we analyzed TSC22D1‐deficient mice of apparently normal growth and development, including the susceptibility to spontaneous cancer. These observations agreed with the phenotypes of TSC‐22‐deficient mice recently generated by Yu et al.,( 14 ) except for a subtle weight loss of kidney and heart found in TSC‐22‐deficient mice. It should be noted that TSC22D1‐1 expression was not mentioned in TSC‐22‐deficient mice.( 14 ) Therefore, the lack of TSC22 and/or TSC22D1‐1 did not promote the spontaneous formation of cancer. As far as we know, models with chemically‐induced tumors have so far not been used with TSC22D1‐deficient mice. Accumulated studies have shown that in most cases, DEN‐induced hepatocarcinoma harbored oncogenic Ras/Raf mutations; B‐Raf mutations were observed in approximately 96% of the C57BL/6 mice treated with DEN.( 35 , 37 , 41 ) Therefore, we examined the DEN‐induced hepatocarcinogenesis of WT and TSC22D1‐deficient mice. Importantly, it was clear that TSC22D1‐deficient mice were susceptible to Ras/Raf activation‐mediated tumorigenesis. Taking into consideration all the results described above, we find TSC‐22 to be a negative regulator of Ras/Raf signaling in vitro and in vivo. During our research, Hömig‐Hölzel et al. ( 42 ) reported that TSC‐22 and TSC22D1‐1 control B‐Raf‐induced senescence. Their results support our conclusion that TSC‐22 is a negative regulator of Ras/Raf signaling, although different functions of TSC22D1‐1 are shown by us and Hömig‐Hölzel et al. Whereas they mainly focus on cell senescence in in vitro experiments, we investigate cellular transformation using both in vitro and in vivo experiments.
In conclusion, Ras/Raf activation induced upregulation and nuclear translocation of TSC‐22, resulting in the feedback downregulation of the Ras/Raf signaling. Identification of TSC‐22 as a suppressor of tumors caused by Ras/Raf activation will lead to the development of a molecularly targeted therapy against cancer involving oncogenic Ras/Raf mutations.
Disclosure Statement
The authors have no conflict of interest.
Supporting information
Fig. S1. Ras/Raf activation upregulated TSC‐22 at both transcript and protein levels.
Fig. S2. Relative expression levels of GILZ of Ba/F3 cells (A) or NIH3T3 cells (B) transduced with H‐Ras‐G12V or mock were estimated by RT‐PCR.
Fig. S3. Transduction with TSC‐22, but not TSC22D1‐1, inhibited the cell growth in NIH3T3 cells.
Fig. S4. Protein expression of TSC‐22 in NIH3T3 cells transfected with small interference RNA (siRNA) for TSC‐22.
Fig. S5. Effect of siRNA treatment with TSC‐22 oligonucleotides on the growth and anchorage‐independent colony formation of H‐Ras‐G12V‐transduced NIH3T3 cells.
Fig. S6. Activation of Raf‐1, but not STAT5, induced the nuclear translocation of TSC‐22 in 293T cells.
Fig. S7. TSC‐22 failed to interact physically with oncogenic H‐Ras.
Fig. S8. Genotyping of WT and TSC22D1‐deficient mice.
Data S1. Material and methods.
Supporting info item
Supporting info item
Supporting info item
Supporting info item
Supporting info item
Supporting info item
Supporting info item
Supporting info item
Supporting info item
Acknowledgments
We thank Dr. Hitoshi Kawamata for providing plasmids. We also thank Dr. Takaya Satoh and Dr. Martin McMahon for providing cells and plasmids. We are grateful to Dr. Dovie Wylie for her excellent language assistance. This study was supported by grants from the Ministry of Education, Science, Technology, Sports and Culture, Japan.
References
- 1. Shibanuma M, Kuroki T, Nose K. Isolation of a gene encoding a putative leucine zipper structure that is induced by transforming growth factor beta 1 and other growth factors. J Biol Chem 1992; 267: 10219–24. [PubMed] [Google Scholar]
- 2. Hamil KG, Hall SH. Cloning of rat Sertoli cell follicle‐stimulating hormone primary response complementary deoxyribonucleic acid: Regulation of TSC‐22 gene expression. Endocrinology 1994; 134: 1205–12. [DOI] [PubMed] [Google Scholar]
- 3. Jay P, Ji JW, Marsollier C, Taviaux S, Berge‐Lefranc JL, Berta P. Cloning of the human homologue of the TGF beta‐stimulated clone 22 gene. Biochem Biophys Res Commun 1996; 222: 821–6. [DOI] [PubMed] [Google Scholar]
- 4. Fiol DF, Mak SK, Kültz D. Specific TSC22 domain transcripts are hypertonically induced and alternatively spliced to protect mouse kidney cells during osmotic stress. FEBS J 2007; 274: 109–24. [DOI] [PubMed] [Google Scholar]
- 5. D’Adamio F, Zollo O, Moraca R et al. A new dexamethasone‐induced gene of the leucine zipper family protects T lymphocytes from TCR/CD3‐activated cell death. Immunity 1997; 7: 803–12. [DOI] [PubMed] [Google Scholar]
- 6. Cannarile L, Zollo O, D’Adamio F et al. Cloning, chromosomal assignment and tissue distribution of human GILZ, a glucocorticoid hormone‐induced gene. Cell Death Differ 2001; 8: 201–3. [DOI] [PubMed] [Google Scholar]
- 7. Wu X, Yamada‐Mabuchi M, Morris EJ et al. The Drosophila homolog of human tumor suppressor TSC‐22 promotes cellular growth, proliferation, and survival. Proc Natl Acad Sci USA 2008; 105: 5414–9. [DOI] [PMC free article] [PubMed] [Google Scholar]
- 8. Treisman JE, Lai ZC, Rubin GM. Shortsighted acts in the decapentaplegic pathway in Drosophila eye development and has homology to a mouse TGF‐beta‐responsive gene. Development 1995; 121: 2835–45. [DOI] [PubMed] [Google Scholar]
- 9. Hino S, Kawamata H, Uchida D et al. Nuclear translocation of TSC‐22 (TGF‐beta‐stimulated clone‐22) concomitant with apoptosis: TSC‐22 as a putative transcriptional regulator. Biochem Biophys Res Commun 2000; 278: 659–64. [DOI] [PubMed] [Google Scholar]
- 10. Kester HA, Blanchetot C, den Hertog J, van der Saag PT, van der Burg B. Transforming growth factor‐beta‐stimulated clone‐22 is a member of a family of leucine zipper proteins that can homo‐ and heterodimerize and has transcriptional repressor activity. J Biol Chem 1999; 274: 27439–47. [DOI] [PubMed] [Google Scholar]
- 11. Ohta S, Yanagihara K, Nagata K. Mechanism of apoptotic cell death of human gastric carcinoma cells mediated by transforming growth factor beta. Biochem J 1997; 324: 777–82. [DOI] [PMC free article] [PubMed] [Google Scholar]
- 12. Gupta RA, Sarraf P, Brockman JA et al. Peroxisome proliferator‐activated receptor gamma and transforming growth factor‐beta pathways inhibit intestinal epithelial cell growth by regulating levels of TSC‐22. J Biol Chem 2003; 278: 7431–8. [DOI] [PubMed] [Google Scholar]
- 13. Lu Y, Kitaura J, Oki T et al. Identification of TSC‐22 as a potential tumor suppressor that is upregulated by Flt3‐D835V but not Flt3‐ITD. Leukemia 2007; 21: 2246–57. [DOI] [PubMed] [Google Scholar]
- 14. Yu J, Ershler M, Yu L et al. TSC‐22 contributes to hematopoietic precursor cell proliferation and repopulation and is epigenetically silenced in large granular lymphocyte leukemia. Blood 2009; 113: 5558–67. [DOI] [PMC free article] [PubMed] [Google Scholar]
- 15. Nakashiro K, Kawamata H, Hino S et al. Down‐regulation of TSC‐22 (transforming growth factor beta‐stimulated clone 22) markedly enhances the growth of a human salivary gland cancer cell line in vitro and in vivo . Cancer Res 1998; 58: 549–55. [PubMed] [Google Scholar]
- 16. Shostak KO, Dmitrenko VV, Garifulin OM et al. Downregulation of putative tumor suppressor gene TSC‐22 in human brain tumors. J Surg Oncol 2003; 82: 57–64. [DOI] [PubMed] [Google Scholar]
- 17. Rentsch CA, Cecchini MG, Schwaninger R et al. Differential expression of TGF beta‐stimulated clone 22 in normal prostate and prostate cancer. Int J Cancer 2006; 118: 899–906. [DOI] [PubMed] [Google Scholar]
- 18. Hayakawa F, Towatari M, Kiyoi H et al. Tandem‐duplicated Flt3 constitutively activates STAT5 and MAP kinase and introduces autonomous cell growth in IL‐3‐dependent cell lines. Oncogene 2000; 19: 624–31. [DOI] [PubMed] [Google Scholar]
- 19. Mizuki M, Fenski R, Halfter H et al. Flt3 mutations from patients with acute myeloid leukemia induce transformation of 32D cells mediated by the Ras and STAT5 pathways. Blood 2000; 96: 3907–14. [PubMed] [Google Scholar]
- 20. Murata K, Kumagai H, Kawashima T et al. Selective cytotoxic mechanism of GTP‐14564, a novel tyrosine kinase inhibitor in leukemia cells expressing a constitutively active Fms‐like tyrosine kinase 3 (FLT3). J Biol Chem 2003; 278: 32892–8. [DOI] [PubMed] [Google Scholar]
- 21. Choudhary C, Schwäble J, Brandts C et al. AML‐associated Flt3 kinase domain mutations show signal transduction differences compared with Flt3 ITD mutations. Blood 2005; 106: 265–73. [DOI] [PubMed] [Google Scholar]
- 22. Vojtek AB, Der CJ. Increasing complexity of the Ras signaling pathway. J Biol Chem 1998; 273: 19925–8. [DOI] [PubMed] [Google Scholar]
- 23. Dhillon AS, Hagan S, Rath O, Kolch W. MAP kinase signalling pathways in cancer. Oncogene 2007; 26: 3279–90. [DOI] [PubMed] [Google Scholar]
- 24. Kolch W. Coordinating ERK/MAPK signalling through scaffolds and inhibitors. Nat Rev Mol Cell Biol 2005; 6: 827–37. [DOI] [PubMed] [Google Scholar]
- 25. Malumbres M, Barbacid M. Ras oncogenes: the first 30 years. Nat Rev Cancer 2003; 3: 459–65. [DOI] [PubMed] [Google Scholar]
- 26. Wan PT, Garnett MJ, Roe SM et al. Mechanism of activation of the RAF‐ERK signaling pathway by oncogenic mutations of B‐RAF. Cell 2004; 116: 855–67. [DOI] [PubMed] [Google Scholar]
- 27. Lauchle JO, Kim D, Le DT et al. Response and resistance to MEK inhibition in leukaemias initiated by hyperactive Ras. Nature 2009; 461: 411–4. [DOI] [PMC free article] [PubMed] [Google Scholar]
- 28. Ayroldi E, Zollo O, Bastianelli A et al. GILZ mediates the antiproliferative activity of glucocorticoids by negative regulation of Ras signaling. J Clin Invest 2007; 117: 1605–15. [DOI] [PMC free article] [PubMed] [Google Scholar]
- 29. Ayroldi E, Zollo O, Macchiarulo A, Di Marco B, Marchetti C, Riccardi C. Glucocorticoid‐induced leucine zipper inhibits the Raf‐extracellular signal‐regulated kinase pathway by binding to Raf‐1. Mol Cell Biol 2002; 22: 7929–41. [DOI] [PMC free article] [PubMed] [Google Scholar]
- 30. Samuels ML, Weber MJ, Bishop JM, McMahon M. Conditional transformation of cells and rapid activation of the mitogen‐activated protein kinase cascade by an estradiol‐dependent human Raf‐1 protein kinase. Mol Cell Biol 1993; 13: 6241–52. [DOI] [PMC free article] [PubMed] [Google Scholar]
- 31. Terada K, Kaziro Y, Satoh T. Analysis of Ras‐dependent signals that prevent caspase‐3 activation and apoptosis induced by cytokine deprivation in hematopoietic cells. Biochem Biophys Res Commun 2000; 267: 449–55. [DOI] [PubMed] [Google Scholar]
- 32. Onishi M, Nosaka T, Misawa K et al. Identification and characterization of a constitutively active STAT5 mutant that promotes cell proliferation. Mol Cell Biol 1998; 18: 3871–9. [DOI] [PMC free article] [PubMed] [Google Scholar]
- 33. Kitamura T, Koshino Y, Shibata F et al. Retrovirus‐mediated gene transfer and expression cloning: powerful tools in functional genomics. Exp Hematol 2003; 11: 1007–14. [PubMed] [Google Scholar]
- 34. Morita S, Kojima T, Kitamura T. Plat‐E: an efficient and stable system for transient packaging of retroviruses. Gene Ther 2000; 7: 1063–6. [DOI] [PubMed] [Google Scholar]
- 35. Jaworski M, Buchmann A, Bauer P, Riess O, Schwarz M. B‐Raf and Ha‐Ras mutations in chemically induced mouse liver tumors. Oncogene 2005; 24: 1290–5. [DOI] [PubMed] [Google Scholar]
- 36. Naugler WE, Sakurai T, Kim S et al. Gender disparity in liver cancer due to sex differences in MyD88‐dependent IL‐6 production. Science 2007; 317: 121–4. [DOI] [PubMed] [Google Scholar]
- 37. Buchmann A, Karcier Z, Schmid B, Strathmann J, Schwarz M. Differential selection for B‐raf and Ha‐Ras mutated liver tumors in mice with high and low susceptibility to hepatocarcinogenesis. Mutat Res 2008; 638: 66–74. [DOI] [PubMed] [Google Scholar]
- 38. Kato N, Kitaura J, Doki N et al. Two types of C/EBPα mutations play distinct but collaborative roles in leukemogenesis: lessons from clinical data and BMT models. Blood 2011; 117: 221–33. [DOI] [PubMed] [Google Scholar]
- 39. Zambrowicz BP, Abuin A, Ramirez‐Solis R et al. Wnk1 kinase deficiency lowers blood pressure in mice: a gene‐trap screen to identify potential targets for therapeutic intervention. Proc Natl Acad Sci USA 2003; 100: 14109–14. [DOI] [PMC free article] [PubMed] [Google Scholar]
- 40. Zambrowicz BP, Friedrich GA, Buxton EC, Lilleberg SL, Person C, Sands AT. Disruption and sequence identification of 2,000 genes in mouse embryonic stem cells. Nature 1998; 392: 608–11. [DOI] [PubMed] [Google Scholar]
- 41. Kalkuhl A, Troppmair J, Buchmann A et al. p21Ras downstream effectors are increased in activity or expression in mouse liver tumors but do not differ between Ras‐mutated and Ras‐wild‐type lesions. Hepatology 1998; 27: 1081–8. [DOI] [PubMed] [Google Scholar]
- 42. Hömig‐Hölzel C, van Doorn R, Vogel C et al. Antagonistic TSC22D1 variants control BRAF(E600)‐induced senescence. EMBO J 2011; 30: 1753–65. [DOI] [PMC free article] [PubMed] [Google Scholar]
Associated Data
This section collects any data citations, data availability statements, or supplementary materials included in this article.
Supplementary Materials
Fig. S1. Ras/Raf activation upregulated TSC‐22 at both transcript and protein levels.
Fig. S2. Relative expression levels of GILZ of Ba/F3 cells (A) or NIH3T3 cells (B) transduced with H‐Ras‐G12V or mock were estimated by RT‐PCR.
Fig. S3. Transduction with TSC‐22, but not TSC22D1‐1, inhibited the cell growth in NIH3T3 cells.
Fig. S4. Protein expression of TSC‐22 in NIH3T3 cells transfected with small interference RNA (siRNA) for TSC‐22.
Fig. S5. Effect of siRNA treatment with TSC‐22 oligonucleotides on the growth and anchorage‐independent colony formation of H‐Ras‐G12V‐transduced NIH3T3 cells.
Fig. S6. Activation of Raf‐1, but not STAT5, induced the nuclear translocation of TSC‐22 in 293T cells.
Fig. S7. TSC‐22 failed to interact physically with oncogenic H‐Ras.
Fig. S8. Genotyping of WT and TSC22D1‐deficient mice.
Data S1. Material and methods.
Supporting info item
Supporting info item
Supporting info item
Supporting info item
Supporting info item
Supporting info item
Supporting info item
Supporting info item
Supporting info item