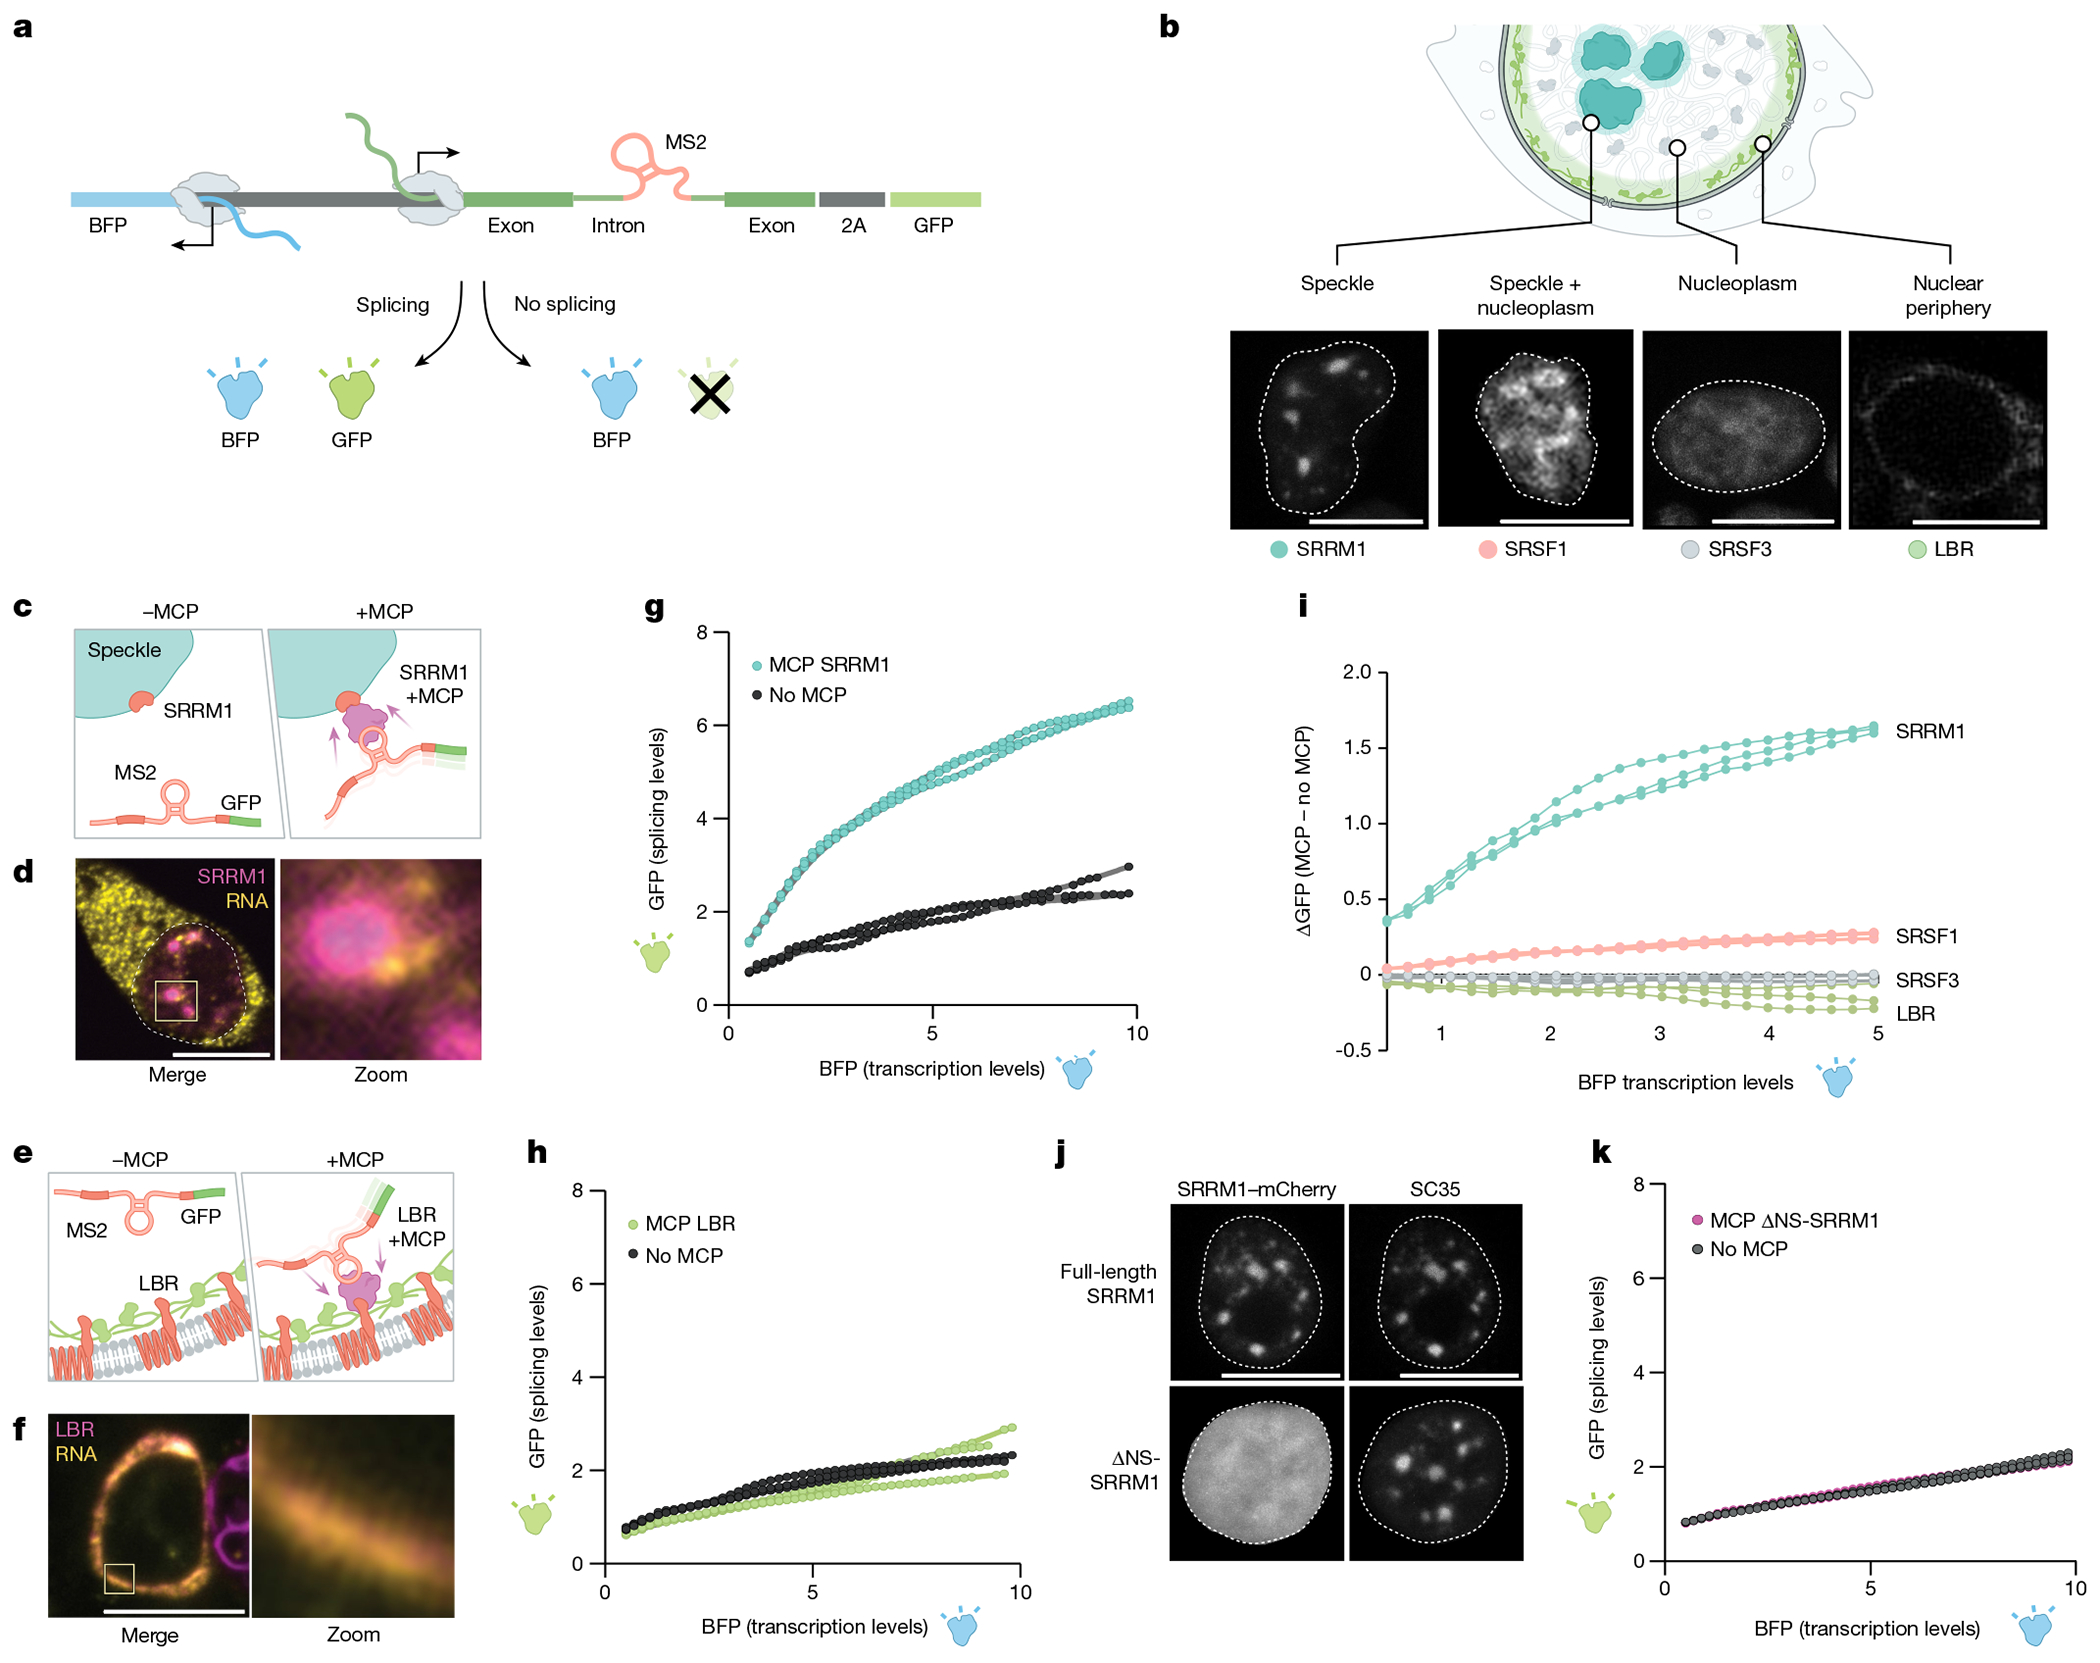
Fig. 5 |. Pre-mRNA organization around nuclear speckles drives splicing efficiency.

a, Schematic of the pre-mRNA splicing assay using a bidirectional GFP and BFP fluorescence-based readout. The MS2 stem–loop is embedded within the intron. GFP is expressed only when the reporter is spliced and was measured by FACS. b, Top, schematic of specific nuclear locations (speckle, speckle + nucleoplasm, nucleoplasm and nuclear periphery). Bottom, mCherry fluorescence of their corresponding proteins (SRRM1, SRSF1; SRSF3 and LBR). The nucleus is outlined in white. n = 3 biological replicates. c, Schematic of SRRM1 tagged with mCherry with or without a MCP tag. The MCP protein binds to the complementary MS2 stem–loop embedded within the intron of the pre-mRNA reporter. d, Single-molecule RNA FISH and zoom-in images of the localization of SRRM1 and MCP with the mCherry reporter. Nucleus is outlined in white. n = 3 biological replicates. e, Schematic of LBR tagged with mCherry with or without a MCP tag. f, Single-molecule RNA FISH and zoom-in images of the localization of LBR and MCP with the mCherry. n = 3 biological replicates. g, Fluorescence intensity of GFP (y axis) versus BFP (x axis) for three replicates of SRRM1 ± MCP. h, Fluorescence intensity of GFP (y axis) versus BFP (x axis) for three replicates of LBR ± MCP. i, Difference of GFP expression between constructs with or without MCP (y axis) versus BFP fluorescence intensity (x axis) for all constructs tested. Three replicates plotted for each sample. j, Fluorescence microscopy for mCherry±SRRM1 (top left) and mCherry ΔNS-SRRM1 (bottom left) with co-immunofluorescence for SC35 (top right and bottom right). n = 3 biological replicates. k, GFP levels (y axis) versus fluorescence intensity (levels) of BFP (x axis) (bottom) for three replicates of SRRM1 ΔNS-SRRM1 ± MCP. Scale bars, 10 μm (b,d,f,j). Illustrations in a–c and e created by Inna-Marie Strazhnik, Caltech.
