

Abstract
Purpose:
To estimate percent excess deaths during the COVID-19 pandemic by rural-urban residence in the United States and to describe rural-urban disparities by age, sex, and race/ethnicity.
Methods:
Using US mortality data, we used overdispersed Poisson regression models to estimate monthly expected death counts by rurality of residence, age group, sex, and race/ethnicity, and compared expected death counts with observed deaths. We then summarized excess deaths over 6 6-month time periods.
Findings:
There were 16.9% (95% confidence interval [CI]: 16.8, 17.0) more deaths than expected between March 2020 and February 2023. The percent excess varied by rurality (large central metro: 18.2% [18.1, 18.4], large fringe metro: 15.6% [15.5, 15.8], medium metro: 18.1% [18.0, 18.3], small metro: 15.5% [15.3, 15.7], micropolitan rural: 16.3% [16.1, 16.5], and noncore rural: 15.8% [15.6, 16.1]). The percent excess deaths were 20.2% (20.1, 20.3) for males and 13.6% (13.5, 13.7) for females, and highest for Hispanic persons (49% [49.0, 49.6]), followed by non-Hispanic Black persons (28% [27.5, 27.9]) and non-Hispanic White persons (12% [11.6, 11.8]). The 6-month time periods with the highest percent excess deaths for large central metro areas were March 2020-August 2020 and September 2020-February 2021; for all other areas, these time periods were September 2020-February 2021 and September 2021-February 2022.
Conclusion:
Percent excess deaths varied by rurality, age group, sex, race/ethnicity, and time period. Monitoring excess deaths by rurality may be useful in assessing the impact of the pandemic over time, as rural-urban patterns appear to differ.
Keywords: demography, epidemiology, social determinants of health
INTRODUCTION
As of March 9, 2023, cumulative COVID-19 deaths per 100,000 residents were higher in rural (434) versus urban (327) counties in the United States.1 Yet, deaths attributed to COVID-19 may be an underestimate, accounting for only 80% of the overall mortality burden during the pandemic.2 Excess deaths provide a more complete measure of the impact of the pandemic because they include (1) deaths attributed to COVID-19 (ie, COVID is documented as a cause of death); (2) deaths indirectly caused by the pandemic (eg, deaths where COVID is not the underlying cause or one of the contributing causes—but the death could have been due to health care service delivery disruptions or other causes of death that increased during the pandemic such as homicide or drug overdose); and (3) deaths incorrectly identified on the death certificate as non-COVID-19 deaths (eg, deaths attributed to another cause when COVID-19 should have been documented as the underlying cause).3,4 Few studies have quantified excess deaths and related disparities by rurality in the United States since the start of the COVID-19 pandemic.
The Centers for Disease Control and Prevention’s (CDC) National Center for Health Statistics (NCHS) maintains a dashboard on excess deaths for the United States, showing weekly trends in excess mortality overall and by state in order to monitor the impact of the COVID-19 pandemic on mortality in near real-time.5 However, the dashboard does not show excess deaths by rural-urban residence, nor rural-urban disparities by age, sex, and race/ethnicity. Each of these demographic factors has been found to be associated with COVID-19 mortality rates and with other causes of death indirectly related to the pandemic,1,6–14 but data on how these factors interact with rurality are lacking.
A prior analysis of aggregated county-level data across the United States found rural-urban disparities in excess deaths during 2020, with large metro areas experiencing the highest percent excess deaths and large metro areas and nonmetro (rural) areas experiencing the highest rate of excess death per 100,000 residents.15 A similar analysis extended the study through February 2022,16 finding percent excess deaths decreased in large metro areas from 23% in the first year to 16% in the second year of the pandemic (starting in February 2021), whereas in nonmetro areas, the percent excess deaths increased from 20% in the first year to 23% in the second year of the pandemic. However, more recent trends after February 2022 have not been examined, and no study to our knowledge has examined disparities by age, sex, and race/ethnicity within rural-urban county of residence groupings.
The aims of our study were to estimate percent excess deaths during the COVID-19 pandemic by rural-urban residence in the United States and to describe rural-urban disparities by age, sex, and race/ethnicity using the most recent mortality data available.
METHODS
Data sources and years
For the purposes of this study, we defined the COVID-19 pandemic as beginning in March 2020 and extending through February 2023 (the most recent month with sufficiently complete provisional data [>85%] as of the time of analysis in April 2023).17 We used publicly available NCHS National Vital Statistics System (NVSS) mortality data downloaded from CDC Wide-ranging Online Data for Epidemiologic Research (WONDER).18 For establishing prepandemic trends in mortality rates, we used the NVSS Multiple Cause of Death Data, January 1999-February 2020 (254 months). For estimating the pandemic mortality rates, we used the Provisional NVSS Multiple Cause of Death Data, March 2020-February 2023 (36 months).
Statistical analysis
Observed and expected death counts
We tabulated observed deaths by rurality of residence, age group, and calendar month and year. For rurality of residence, we used the 2013 NCHS Urban-Rural Classification Scheme for Counties (large central metro, large fringe metro, medium metro, small metro, micropolitan [nonmetro], noncore [nonmetro]), which is based on the Office of Management and Budget’s February 2013 delineation of metropolitan and micropolitan statistical areas and Vintage 2012 postcensal estimates of the resident US population.19 We generated estimates of expected death counts during each month of the pandemic using the flexible Farrington surveillance algorithm20 from the “surveillance” package in R,21 which is the method used for the NCHS Dashboard.5 Briefly, this approach uses an overdispersed Poisson regression model to generate expected death counts for each population group being examined. In our primary analysis, we used 15 prior years of mortality data for each month (excluding pandemic months) and 2 months as the window’s half size (the months included before and after the current month each year) to estimate the baseline trends in expected death counts. This algorithm accounts for linear trends and seasonal patterns over the baseline time period.
Total number of excess deaths
We subtracted the expected death counts from the observed death counts for each month to calculate the total number of excess deaths per month. We allowed excess deaths to be negative; in other words, we did not recode negative excess death estimates to zero, consistent with other excess death studies15,22 but inconsistent with the NCHS Dashboard (which uses this strategy to correct for incomplete provisional death data in some states, which could downwardly bias excess death estimates).5 Negative excess death counts indicate that observed deaths were below the expected death counts for that month.
Percent excess deaths
The percent excess deaths (also known as “relative excess deaths”)16 was calculated by summing the observed death counts over a given time period and dividing by the sum of the expected death counts over the same time period. The percent excess deaths is, therefore, based on a ratio (ie, observed/expected), and was expressed as 100*((observed/expected)−1). We used the Ury method for calculating the 95% confidence interval for the percent excess deaths.23
Ratio of COVID-19 deaths to excess deaths
We queried NVSS Provisional Multiple Cause of Death Data files via WONDER to obtain the number of deaths attributed to COVID-19 (ie, COVID-19 was documented as one of the underlying or contributing causes of death listed on the death certificate) by rural-urban group during March 2020-February 2023. We then divided this count by the number of excess deaths over the same time period to calculate the ratio of COVID-19 deaths to excess deaths. This ratio can provide an indication of the proportion of excess mortality attributed directly to COVID-19 versus the proportion attributed to other causes of death. Variation in this ratio can be due to the level of accuracy of COVID-19 documentation on death certificates and the relative contribution of non-COVID-19 deaths indirectly related to the pandemic to total deaths, which may have varied across population groups during the pandemic.
Subgroup analyses
We also calculated the total number and percent excess deaths by age and rural-urban group for males and females, separately, and for non-Hispanic White, non-Hispanic Black, and Hispanic persons, separately. We conducted these stratified analyses because the pandemic’s effects on mortality have differed based on these demographic characteristics, though no study has yet examined these demographic factors within the context of rural-urban residence. Because of small death counts for some 10-year age groups after stratification by race/ethnicity (eg, Hispanic death counts for 5- to 14-year-olds in noncore rural areas by month were <10 for some months), we combined the youngest age groups in our data query to create a single group aged 0–44 years for each race/ethnicity group analysis. Small death counts by age and rural-urban group for other race/ethnicity groups (eg, non-Hispanic Asian residents of noncore rural areas) resulted in a large degree of data suppression—even after combining the youngest age groups—and thus results for other racial/ethnic subgroups are not included in this analysis.
Imputation
Subnational death counts between 0 and 9 are suppressed from the NVSS vital statistics data in CDC WONDER due to disclosure risk. Therefore, for the analyses that relied on 10-year age groupings, we performed a single imputation to randomly assign with equal probability a number between 0 and 9 to these suppressed cells (we assumed a uniform distribution). This resulted in imputations for 6.2% (110/1,740) of observation months (1,740 total months = 290 months [Jan 1999-Feb 2023] × 6 rural-urban groups) for age group 1–4 years for females; for all other 10-year age groupings, imputations were necessary for <1% (<17/1,740) of months. Imputations were not necessary for the analyses by race/ethnicity because we had combined the youngest age groups to create a single group aged 0–44 years.
Trends in excess deaths
We then summarized excess deaths over equally spaced time periods, in line with previous COVID-19 pandemic studies,16,24 to examine how excess mortality and related disparities changed over the course of the pandemic. The 6-month time periods were: March 2020-August 2020, September 2020-February 2021, March 2021-August 2021, September 2021-February 2022, March 2022-August 2022, and September 2022-February 2023. We calculated excess death rates per 100,000 population by dividing the total excess deaths by the population, using intercensal and postcensal single-race population counts released by the US Census Bureau.25 For the entire pandemic (March 2020-February 2023), we estimated the population using 3 times the annual population at the mid-point (July 1, 2021). For each 6-month time period, we estimated the population using one-half of the annual population for the year at the start of each time period. For the overall and sex-specific analyses, we present results for the youngest age groups combined (<1 year, 1–4, and 5–14 years old) due to the small number of deaths in these groups.
Sensitivity analyses
We conducted 2 sensitivity analyses to evaluate the impact of different analytic decisions on the results. First, we summed the excess death counts by age and rural-urban group after recoding negative excess death counts to zero, consistent with the NCHS Dashboard.5 We then calculated the percent excess by month for each age group with and without allowing negative excess deaths counts. Second, we explored the impact of using a shorter (10 years) and longer (20 years) number of prior years of mortality data for estimating the baseline trends of expected deaths to determine its impact on the results.
Ethical approval
This study was determined to be nonhuman subjects research by the Institutional Review Board at the University of Southern Maine.
RESULTS
Percent excess deaths
From March 2020 to February 2023, the percent excess deaths overall was 16.9% (95% confidence interval [CI]: 16.8, 17.0) (Table 1). The percent excess varied by rurality (large central metro: 18.2% [18.1, 18.4], large fringe metro: 15.6% [15.5, 15.8], medium metro: 18.1% [18.0, 18.3], small metro: 15.5% [15.3, 15.7], micropolitan rural: 16.3% [16.1, 16.5], and noncore rural: 15.8% [15.6, 16.1]). In addition, there was variation in the percent excess deaths by rural-urban residence within each age group (Figure 1). For example, among 4 of the 9 age groups (15–24, 35–44, 45–54, and 75–84 years), large central metro areas had the highest percent excess deaths. However, the highest percent excess deaths for age groups 0–14 and 85+ years were in noncore rural counties (albeit 95% confidence intervals were wide for 0- to 14-year-olds). For the 25- to 34-year, 55- to 64-year, and 65- to 74-year age groups, the highest percent excess deaths was in medium metro counties.
TABLE 1.
Percent excess (and 95% confidence interval), observed, observed COVID-19, expected, and excess deaths (and excess death rates) and ratio of observed COVID-19 deaths to excess deaths, by rural-urban county of residence during March 2020-February 2023.
| Rural-urban county of residence | Percent excess deatha | Percent excess deathsa (95% confidence interval) | Observed deaths | Observed COVID-19 deaths | Expected deaths | Excess deathsb | Ratio of observed COVID-19 deaths to excess deathsc | Excess death rates per 100,000d |
|---|---|---|---|---|---|---|---|---|
| Large central metro | 18.2 | (18.1,18.4) | 2,632,738 | 308,197 | 2,227,290 | 405,448 | 0.76 | 135.9 |
| Large fringe metro | 15.6 | (15.5,15.8) | 2,340,327 | 250,515 | 2,023,765 | 316,562 | 0.79 | 127.1 |
| Medium metro | 18.1 | (18.0,18.3) | 2,228,452 | 231,523 | 1,886,353 | 342,099 | 0.68 | 166.0 |
| Small metro | 15.5 | (15.3,15.7) | 1,051,099 | 112,399 | 910,136 | 140,963 | 0.80 | 158.7 |
| Micropolitan (nonmetro) | 16.3 | (16.1,16.5) | 1,065,192 | 118,478 | 915,915 | 149,277 | 0.79 | 185.0 |
| Noncore (nonmetro) | 15.8 | (15.6,16.1) | 820,852 | 94,094 | 708,862 | 111,990 | 0.84 | 205.1 |
| Total | 16.9 | (16.8,17.0) | 10,138,660 | 1,115,206 | 8,672,321 | 1,466,339 | 0.76 | 150.0 |
100*((Observed deaths divided by expected deaths)−1).
Observed deaths minus expected deaths.
Observed COVID-19 deaths divided by excess deaths. This represents an approximation of the proportion of excess deaths due to COVID-19 infection directly.
Excess deaths divided by population of rural-urban county of residence category (estimated using mid-point population [July 1, 2021] × 3).
FIGURE 1.
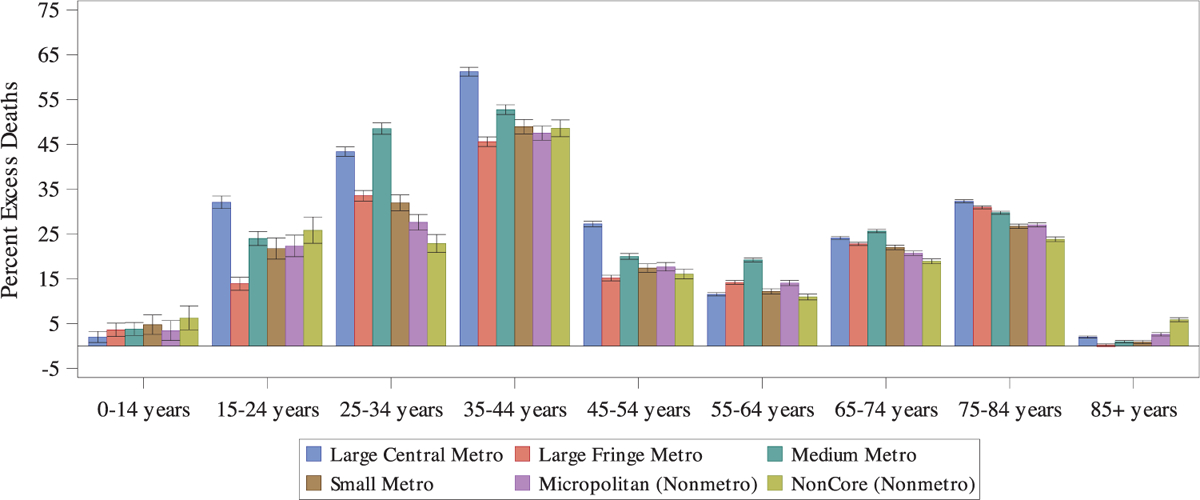
Percent excess deaths (and 95% confidence interval) by age group and rural-urban county of residence, March 2020-February 2023.
The 2 6-month periods with the highest percent excess deaths for the large central areas were the first and second 6 months of the pandemic (March 2020-August 2020 and September 2020-February 2021) (Figure 2). In contrast, the periods with the highest percent excess deaths among the large fringe metro, medium metro, small metro, micropolitan rural, and noncore rural areas were the second and fourth time periods (September 2020-February 2021 and September-February 2022), with the latter occurring 18–24 months after the start of the pandemic.
FIGURE 2.
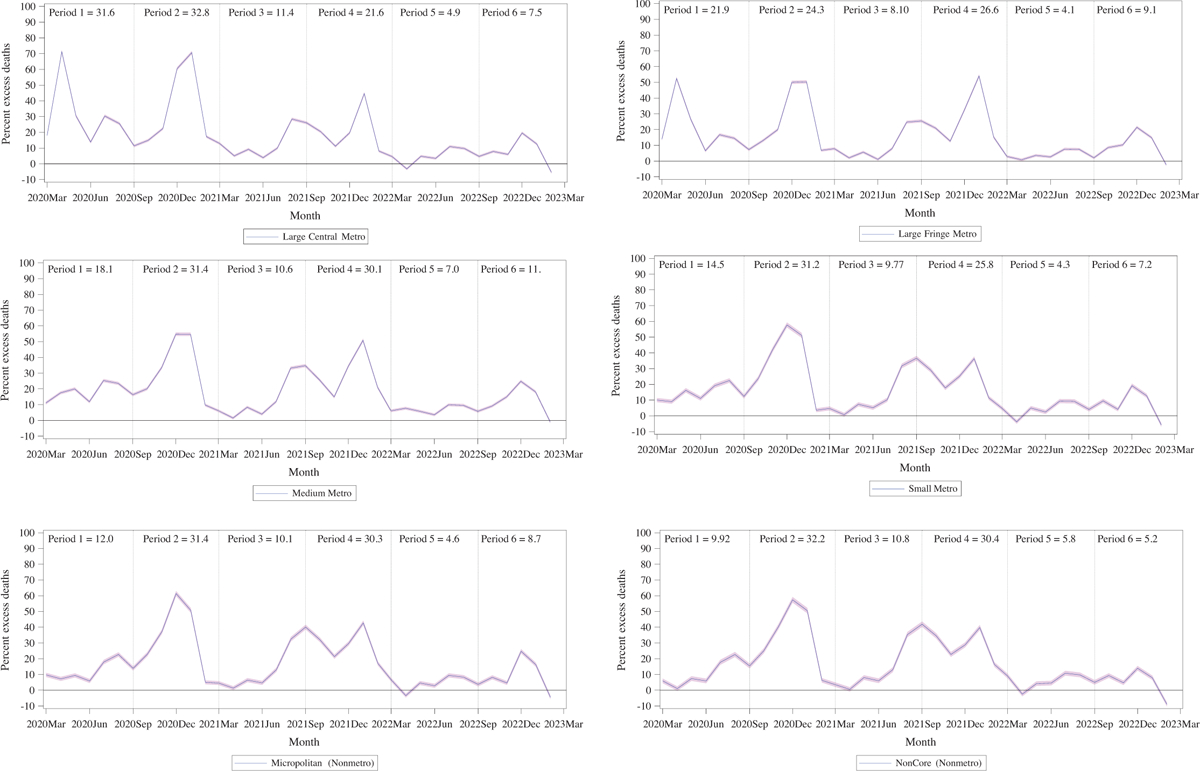
Percent excess deaths (with 95% confidence band) by rural-urban county of residence by month, with insets for percent excess deaths for each 6-month time period, March 2020-February 2023. Note: The 6-month time periods were: (1) March 2020-August 2020, (2) September 2020-February 2021, (3) March 2021-August 2021, (4) September 2021-February 2022, (5) March 2022-August 2022, and (6) September 2022-February 2023.
Total excess deaths
During the study period, we estimated that 8,672,321 deaths would have been expected to occur in the absence of the pandemic and the observed number of deaths was 10,138,660, yielding 1,466,339 total excess deaths (excess death rate 150.0 per 100,000) during the first 3 years (36 months) of the COVID-19 pandemic (Table 1 and Appendix S1). The greatest number of excess deaths were found for residents of large central metro counties (405,448) and the smallest number of excess deaths were found for noncore rural counties (111,990), reflecting in part the lower population counts in rural areas. The age groups with the largest total number of excess deaths were those aged 65–74 and 75–84 years, with large central metro, large fringe metro, and medium metro counties having the greatest number of excess deaths for these age groups (Figure 3). Children ages 0–14 years old had nearly zero excess deaths for each rural-urban area grouping.
FIGURE 3.
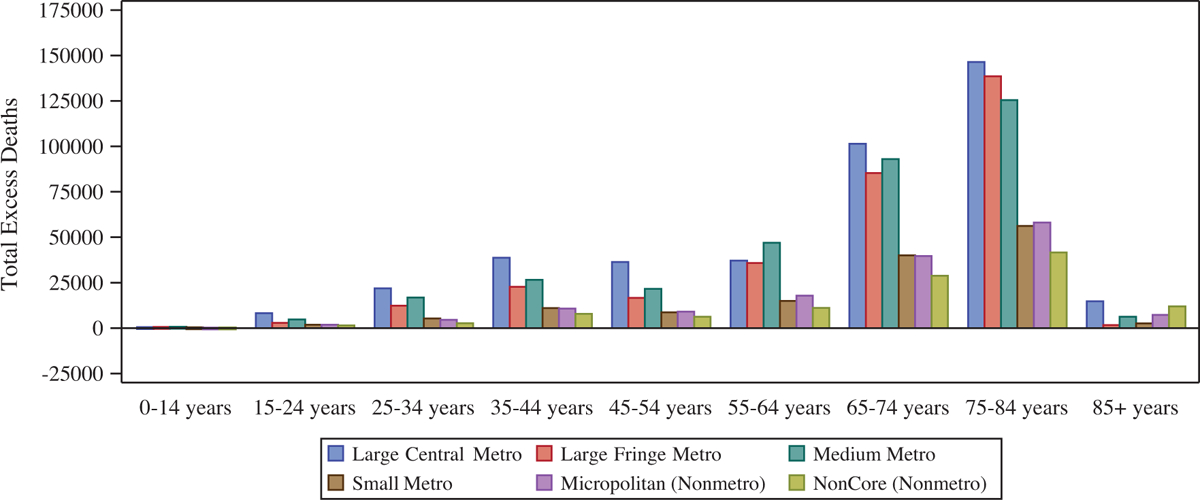
Number of estimated total excess deaths by age group and rural-urban county of residence, March 2020-February 2023.
Ratio of COVID-19 deaths to excess deaths
The ratio of COVID-19 deaths to excess deaths overall was 0.76, suggesting that 24% of excess deaths during the COVID-19 pandemic were not attributed to COVID-19 on death certificates (Table 1). This ratio was lowest in medium metro areas (0.68) and highest in noncore rural areas (0.84).
Stratification by sex
The percent excess deaths was 20.2% (20.1, 20.3) for males and 13.6% (13.5, 13.7) for females overall and within each rural-urban group (Table 2). Males and females had similar patterns in the percent excess deaths within rural-urban groups across the 6 6-month periods as were found overall (Appendices S2 and S3); however, for females living in large fringe metro areas, the percent excess deaths were highest for the first 2 6-month time periods, as compared with the second and fourth 6-month time periods overall.
TABLE 2.
Percent excess deathsa (and 95% confidence interval) by rural-urban county of residence grouped by sex and grouped by race/ethnicity during March 2020-February 2023.
| Rural-urban county of residence | Grouped by sex | Grouped by race/ethnicityb | ||||||||
|---|---|---|---|---|---|---|---|---|---|---|
| Male | 95% CI | Female | 95% CI | Hispanic | 95% CI | Non-Hispanic Black | 95% CI | Non-Hispanic White | 95% CI | |
| Large central metro | 21.6 | (21.4,21.8) | 14.3 | (40.2,41.0) | 40.6 | (40.2,41.0) | 25.5 | (25.1, 25.8) | 9.8 | (9.6, 9.9) |
| Large fringe metro | 20.3 | (20.1,20.5) | 11.8 | (11.6,12.0) | 74.0 | (73.2,74.9) | 33.4 | (32.9,33.9) | 10.1 | (9.9,10.2) |
| Medium metro | 22.2 | (22.0,22.4) | 13.8 | (13.5,14.0) | 56.7 | (56.0,57.4) | 29.4 | (28.9, 29.9) | 13.1 | (12.9,13.2) |
| Small metro | 17.1 | (16.8,17.4) | 13.3 | (13.0,13.6) | 50.3 | (49.0,51.6) | 24.9 | (24.1,25.7) | 12.3 | (12.0,12.5) |
| Micropolitan (nonmetro) | 17.8 | (17.5,18.1) | 14.9 | (14.6,15.2) | 42.6 | (41.2,43.9) | 27.2 | (26.3, 28.1) | 13.5 | (13.3,13.8) |
| Noncore (nonmetro) | 17.1 | (16.8,17.5) | 14.6 | (14.2,15.0) | 36.2 | (34.4,38.1) | 23.9 | (22.9,24.8) | 14.0 | (13.8,14.3) |
| Total | 20.2 | (20.1,20.3) | 13.6 | (13.5,13.7) | 49.3 | (49.0,49.6) | 27.7 | (27.5,27.9) | 11.7 | (11.6,11.8) |
100*((Observed deaths divided by expected deaths)−1).
Additional race/ethnicity groups could not be estimated due to small death counts in dataset used for estimating percent excess deaths (ie, after stratification by age group, month and year, and rural-urban county of residence).
Stratification by race/ethnicity
The percent excess deaths was highest for Hispanic persons (49% [49.0, 49.6]), followed by non-Hispanic Black persons (28% [27.5, 27.9]) and non-Hispanic White persons (12% [11.6, 11.8]) (Table 2). These gradients persisted within each rural-urban group (Table 2). Some race/ethnicity/age/rural-urban groups experienced negative excess deaths (ie, death counts below expected), such as non-Hispanic White 85+-year-old residents of large central metro and large fringe metro areas (Appendix S4).
Non-Hispanic White persons had similar patterns in the percent excess deaths within rural-urban groups across the 6 6-month periods as observed overall (Appendix S4). However, for Hispanic persons, the 2 6-month periods with the highest percent excess deaths for the large fringe metro areas were the first 2 6-month periods of the pandemic, not the second and fourth 6-month time periods as seen overall (Appendix S5). For non-Hispanic Black persons, the 2 6-month periods with the highest percent excess deaths were the first 2 6-month periods of the pandemic for each rural-urban area group, inconsistent with overall rural-urban patterns (Appendix S6).
Sensitivity analysis
Repeating the analyses after recoding negative excess death counts to zero by rural-urban age group and month, the estimated total number of excess deaths was larger than in our primary analysis, particularly for the 85+ years age group (Figure S1). Discrepancies in percent excess deaths by month across the pandemic based on how negative excess death months were handled were found for the 0–14, 55–64, and 85+ age groups, the only age groups to experience fewer deaths than expected at any month during the study period (Appendix S1).
When we specified a lower number of prior years (10 years) of mortality data in the estimations of baseline expected death counts, we calculated a percent excess deaths of 16.5% (16.5, 16.6). When we specified a higher number of prior years (20 years), we calculated a percent excess deaths of 19.6% (19.5, 19.7) (Appendices S7 and S8).
DISCUSSION
Summary of findings
During March 2020-February 2023, the percent excess deaths was nearly 17% and varied by rural-urban residence. Overall percent excess deaths were highest by sex for males, and highest for Hispanic persons, followed by non-Hispanic Black persons and non-Hispanic White persons. These patterns persisted within each rural-urban group. The highest percent excess deaths for the large central metro areas occurred during the first 2 6-month periods of the pandemic, whereas percent excess deaths among all other areas was highest for the second and fourth 6-month time periods after the start of the pandemic. Similar patterns over time were generally observed by sex, but not within each of the 3 race/ethnicity groups we examined.
Rural-urban differences in excess deaths in the United States
Our findings are largely consistent with previous studies examining rural-urban excess deaths. Ackley et al. estimated percent excess deaths to be 15% in 2020, ranging from 13% in rural counties to 20% in urban counties, with higher excess mortality observed in nonmetro areas in the Southwest, Southeast, Plains, and Rocky Mountains regions.15 While we did not stratify our analysis further by geography, we found a similar rural-to-urban gradient (with highest percent excess deaths in the most urban areas) during a more extended time period (March 2020-February 2023). Paglino et al. found that rural areas experienced an increase in the percent excess deaths from the first to second year of the pandemic, whereas urban areas experienced a decrease.16 This is also in line with our overall findings that the 2 highest percent excess death 6-month periods for large central urban areas were at the start of the pandemic, while for all other areas, there was a second peak in percent excess death occurring 18–24 months after the start of the pandemic. Our findings on the percent excess deaths contrast with rural-urban disparities in COVID-19 mortality rates. Rural areas have experienced higher cumulative COVID-19 mortality rates, especially after the initial wave of the pandemic in the spring of 2020.1,6 The discrepancies between rural-urban percent excess death disparities and COVID-19 mortality rates is due, in part, to higher underlying death rates (especially crude death rates) in rural areas. Some of the higher COVID-19 mortality rates in rural areas may be due to later (and lower) vaccination rates in rural areas across the United States.26
Unlike other reports, we found certain race/ethnicity age-rurality groups experienced negative cumulative excess deaths during the pandemic. For example, non-Hispanic White 85+-year-old residents of large central and large fringe metro areas. These findings could be due to spikes in excess deaths leading to lower-than-expected deaths in the subsequent months (as seen in Appendix S4), lower-than-expected rates of population growth for those groups during the pandemic, or possibly other factors like declining deaths due to other specific causes.
Excess deaths attributed to COVID-19
We estimated approximately 24% of excess deaths were not assigned to COVID-19 as an underlying or contributing cause of death. This is comparable with previous estimates for the United States ranging from 12.5% to 28%.2,15,27,28 Our study’s estimates varied according to rural-urban county of residence, likely due to racial and socioeconomic2 and health care access27 differences across areas, factors that can affect excess deaths not being assigned to COVID-19 as a cause of death. These excess deaths include deaths due to other causes that may have been indirectly related to the pandemic, such as a lack of access to emergency care for medical emergencies like stroke or hyperglycemic crisis.29–31 Surprisingly, we found the lowest percentage of excess deaths not assigned to COVID-19 in noncore rural areas (16%), which appears to be in contrast to findings from Stokes 2021 that counties in the upper versus lower quartile of rurality had a higher percentage of excess deaths not assigned to COVID-19 (21% vs 15%).2 However, the Stokes 2021 analysis was restricted to 2,096 counties (of 3,140 total in file) with 20 or more COVID-19 deaths in 2020, which likely excluded many noncore rural counties due to small numbers of COVID-19 deaths. An analysis by Ackely found the percentage of deaths not assigned to COVID-19 was lower in nonmetro counties (9%) than in large central metro counties (21%), which is consistent with what we found, though our rural-urban grouping methods and timeframes were different.15
Race/ethnicity disparities
The overall racial and ethnic disparities we found in percent excess deaths are consistent with previous studies on excess mortality during the COVID-19 pandemic.3,28,32–34 When compared with non-Hispanic White populations, higher excess death rates have been found for Hispanic, non-Hispanic Black, and American Indian/Alaskan Native populations in all-cause mortality,3,28,32–34 as well as excess deaths attributable to COVID-19.34 These same racial and ethnic groups also have experienced higher COVID-19 mortality7,9,10 and incidence rates.7 Some of these differences may be due to disparate health care access and underlying health conditions, and occupational differences by race/ethnicity, with employment in certain sectors (such as agriculture, manufacturing, and emergency sectors) associated with a higher risk of COVID-19 mortality.35,36 These differences in risk have, in turn, been attributed to systemic racism and economic and educational inequity.36,37 In addition, these findings could be due to higher-than-expected rates of population growth for those groups during the pandemic, particularly for certain rural-urban areas (eg, Hispanic populations in large fringe metro areas).38 Our study expands upon prior work by showing that racial and ethnic disparities persist within each of the 6-level NCHS rural-urban county of residence groupings.
Implications
Quantifying excess deaths during the COVID-19 pandemic by rurality of residence can highlight important disparities in the impact of the pandemic on specific populations. This information may be relevant for planning responses to future pandemics and reducing potential inequities. These findings can help identify areas or subgroups that may be most in need of public health interventions and focused efforts to improve access to preventive services and/or health care during and after a pandemic. Results shown here highlight disparities by sex and race/ethnicity in excess deaths associated with the COVID-19 pandemic within rural areas, describing patterns and trends that could help reduce harm to at-risk rural communities.
Limitations
Limitations of this study include sparse death counts by month after stratification by rural-urban residence, age group, year-month, sex, and race/ethnicity simultaneously. To surmount this, we examined sex and race/ethnicity separately, imputed counts for a small number of suppressed cells, and combined age groups with sparse data counts when necessary. Even after doing so, we were unable to examine additional race/ethnicity groups in our analysis. Also, death counts may be influenced by changes in the population size or age structure at the county level over time; some of this is already accounted for by the model we used, which incorporates trends over time, but shifts in population size or age structure could be partly responsible for the unexpected negative cumulative excess death findings we report for some groups. Modeling age-adjusted death rates would more fully account for these population changes, and for the differing age distributions by race/ethnicity (eg, the younger average age of Hispanic and non-Hispanic Black populations in the United States).39 Furthermore, provisional death certificate data are incomplete and may contain errors in the cause of death; it is unknown whether these error rates may be larger for rural areas.40,41 We conducted the analysis using monthly data, as weekly data would have been subject to a greater degree of data suppression; but the estimates derived from the flexible Farrington algorithm may differ based on the temporal resolution of the data. Finally, baseline expected counts of deaths were estimated separately for each rural-urban group, which might understate total inequities, considering baseline differences in mortality rates by rurality of residence and race/ethnicity. If the group with the lowest baseline mortality rate was used as the reference group to estimate excess deaths for all rural-urban groups, then disparities would be even wider.
Strengths
Strengths of our study include the examination of multiple subgroups within rural-urban county of residence groupings using the most complete data available at the national level; exploration of the sensitivity of our findings to different analytic choices related to modeling excess deaths (different baseline periods, including/excluding negative excess counts); and using a method consistent with what the CDC has been using throughout the pandemic (albeit with monthly—not weekly—data).
CONCLUSION
There were nearly 17% more deaths during the COVID-19 pandemic in the United States than were expected, with percent excess deaths varying by rurality, sex, age group, race/ethnicity, and time period. Males, Hispanic persons, and non-Hispanic Black persons experienced higher percent excess deaths overall and within each rural-urban group as compared to females and non-Hispanic White persons, respectively, and racial/ethnic groups showed distinct patterns over time. Routine monitoring of excess deaths by rurality of residence may be useful for tracking the impact of the pandemic over time, as rural-urban patterns appear to differ.
Supplementary Material
FUNDING INFORMATION
The findings and conclusions in this report are those of the authors and do not necessarily represent the official position of the US Federal Office of Rural Health Policy or that of the National Center for Health Statistics of the Centers for Disease Control and Prevention. These data are available from the National Center for Health Statistics.
The results reported in this paper correspond to the specific aims of a project supported by cooperative agreement #U1CRH03716 to ECZ from the US Federal Office of Rural Health Policy, Health Resources and Services Administration, Department of Health and Human Services.
No financial disclosures were reported by the authors of this paper.
Footnotes
CONFLICT OF INTEREST STATEMENT
The authors report no conflict of interest.
ETHICAL APPROVAL STATEMENT
This study was determined to be nonhuman subjects research by the Institutional Review Board at the University of Southern Maine.
SUPPORTING INFORMATION
Additional supporting information can be found online in the Supporting Information section at the end of this article.
REFERENCES
- 1.Ullrich F, Mueller K. COVID-19 Cases and Deaths, Metropolitan and Nonmetropolitan Counties Over Time (Update). 2023.
- 2.Stokes AC, Lundberg DJ, Elo IT, Hempstead K, Bor J, Preston SH. COVID-19 and excess mortality in the United States: a county-level analysis. PLoS Med. 2021;18(5):e1003571. [DOI] [PMC free article] [PubMed] [Google Scholar]
- 3.Rossen LM, Ahmad FB, Anderson RN, et al. Disparities in excess mortality associated with COVID-19 - United States, 2020. MMWR Morb Mortal Wkly Rep. 2021;70(33):1114–1119. [DOI] [PMC free article] [PubMed] [Google Scholar]
- 4.Woolf SH, Chapman DA, Sabo RT, Zimmerman EB. Excess deaths from COVID-19 and other causes in the US, March 1, 2020, to January 2, 2021. JAMA. 2021;325(17):1786–1789. [DOI] [PMC free article] [PubMed] [Google Scholar]
- 5.Excess Deaths Associated with COVID-19 Provisional Death Counts for Coronavirus Disease (COVID-19). Accessed December 7, 2023. https://www.cdc.gov/nchs/nvss/vsrr/covid19/excess_deaths.htm
- 6.Zahnd W, Gadag K, Ullrich F, Mueller K. COVID-19 Mortality Rates across Noncore, Micropolitan, and Metropolitan Counties by Community Characteristics, December 2020-January 2021. RUPRI Center for Rural Health Policy Analysis. [Google Scholar]
- 7.Hill L, Artiga S. COVID-19 Cases and Deaths by Race/Ethnicity: Current Data and Changes Over Time. Kaiser Family Foundation. Accessed January 29, 2023. https://www.kff.org/coronavirus-covid-19/issue-brief/covid-19-cases-and-deaths-by-race-ethnicity-current-data-and-changes-over-time/ [Google Scholar]
- 8.Curtin SC, Heron M. COVID-19 death rates in urban and rural areas: United States, 2020. NCHS Data Brief. Hyattsville, MD: National Center for Health Statistics. 2022(447):1–8. doi: 10.15620/cdc:121523 [DOI] [PubMed] [Google Scholar]
- 9.Lundberg DJ, Cho A, Raquib R, Nsoesie EO, Wrigley-Field E, Stokes AC. Geographic and temporal patterns in Covid-19 mortality by race and ethnicity in the United States from March 2020 to February 2022. 2022. doi: 10.1101/2022.07.20.22277872 [DOI] [Google Scholar]
- 10.Tejada-Vera B, Kramarow EA. COVID-19 Mortality in Adults Aged 65 and Over: United States, 2020. 2022. NCHS Data Brief No. 446. [PubMed] [Google Scholar]
- 11.Danielsen AC, Lee KMN, Boulicault M, et al. Sex disparities in COVID-19 outcomes in the United States: quantifying and contextualizing variation. Soc Sci Med. 2022;294:114716. [DOI] [PMC free article] [PubMed] [Google Scholar]
- 12.Rushovich T, Boulicault M, Chen JT, et al. Sex disparities in COVID-19 mortality vary across US racial groups. J Gen Intern Med. 2021;36(6):1696–1701. [DOI] [PMC free article] [PubMed] [Google Scholar]
- 13.Friedman JR, Hansen H. Evaluation of increases in drug overdose mortality rates in the US by race and ethnicity before and during the COVID-19 pandemic. JAMA Psychiatry. 2022;79(4):379–381. [DOI] [PMC free article] [PubMed] [Google Scholar]
- 14.Johnson KJ, Goss CW, Thompson JJ, et al. Assessment of the impact of the COVID-19 pandemic on health services use. Public Health Pract. 2022;3:100254. [DOI] [PMC free article] [PubMed] [Google Scholar]
- 15.Ackley CA, Lundberg DJ, Ma L, Elo IT, Preston SH, Stokes AC. County-level estimates of excess mortality associated with COVID-19 in the United States. SSM Popul Health. 2022;17:101021. [DOI] [PMC free article] [PubMed] [Google Scholar]
- 16.Paglino E, Lundberg DJ, Zhou Z, et al. Monthly excess mortality across counties in the United States during the Covid-19 pandemic, March 2020 to February 2022. 2022. doi: 10.1101/2022.04.23.22274192 [DOI] [PMC free article] [PubMed] [Google Scholar]
- 17.Provisional Death Counts for Coronavirus Disease (COVID-19). Technical Notes. “Delays in Reporting”. Accessed June 1, 2023. https://www.cdc.gov/nchs/nvss/vsrr/covid19/tech_notes.htm
- 18.CDC Wide-ranging ONline Data for Epidemiologic Research (WONDER). Accessed July 14, 2023. https://wonder.cdc.gov/
- 19.NCHS Urban-Rural Classification Scheme for Counties. Accessed December 7, 2023. https://www.cdc.gov/nchs/data_access/urban_rural.htm
- 20.Noufaily A, Enki DG, Farrington P, Garthwaite P, Andrews N, Charlett A. An improved algorithm for outbreak detection in multiple surveillance systems. Stat Med. 2013;32(7):1206–1222. [DOI] [PubMed] [Google Scholar]
- 21.Salmon M, Schumacher D, Höhle M. Monitoring count time series in R: aberration detection in public health surveillance. J Stat Softw. 2016;70(10):1–35. [Google Scholar]
- 22.Paglino E, Lundberg DJ, Cho A, et al. Excess all-cause mortality across counties in the United States, March 2020 to December 2021. 2022. doi: 10.1101/2022.04.23.22274192 [DOI] [Google Scholar]
- 23.Ury HK, Wiggins AD. Another shortcut method for calculating the confidence interval of a Poisson variable (or of a standardized mortality ratio). Am J Epidemiol. 1985;122(1):197–198. [DOI] [PubMed] [Google Scholar]
- 24.Tan AX, Hinman JA, Abdel Magid HS, Nelson LM, Odden MC. Association between income inequality and county-level COVID-19 cases and deaths in the US. JAMA Netw Open. 2021;4(5):e218799. [DOI] [PMC free article] [PubMed] [Google Scholar]
- 25.Single-Race Population Estimates United States July 1st Resident Population by State, County, Age, Sex, Single-Race, and Hispanic Origin, on CDC WONDER Online Database. Accessed October 19, 2023. https://wonder.cdc.gov/wonder/help/single-race.html#Citation
- 26.Saelee R, Zell E, Murthy BP, et al. Disparities in COVID-19 vaccination coverage between urban and rural counties—United States, December 14, 2020-January 31, 2022. MMWR Morb Mortal Wkly Rep. 2022;71(9):335–340. [DOI] [PMC free article] [PubMed] [Google Scholar]
- 27.Stokes AC, Lundberg DJ, Bor J, Elo IT, Hempstead K, Preston SH. Association of health care factors with excess deaths not assigned to COVID-19 in the US. JAMA Netw Open. 2021;4(9):e2125287. [DOI] [PMC free article] [PubMed] [Google Scholar]
- 28.Woolf SH, Chapman DA, Sabo RT, Zimmerman EB. Excess deaths from COVID-19 and other causes in the US, March 1, 2020, to January 2, 2021. JAMA. 2021;325(17):1784–1786. [DOI] [PMC free article] [PubMed] [Google Scholar]
- 29.Lange SJ, Ritchey MD, Goodman AB, et al. Potential indirect effects of the COVID-19 pandemic on use of emergency departments for acute life-threatening conditions—United States, January-May 2020. MMWR Morb Mortal Wkly Rep. 2020;69(25):795–800. [DOI] [PMC free article] [PubMed] [Google Scholar]
- 30.Hartnett KP, Kite-Powell A, DeVies J, et al. Impact of the COVID-19 pandemic on emergency department visits—United States, January 1, 2019-May 30, 2020. MMWR Morb Mortal Wkly Rep. 2020;69(23):699–704. [DOI] [PMC free article] [PubMed] [Google Scholar]
- 31.Czeisler ME, Barrett CE, Siegel KR, et al. Health care access and use among adults with diabetes during the COVID-19 pandemic—United States, February-March 2021. MMWR Morb Mortal Wkly Rep. 2021;70(46):1597–1602. [DOI] [PMC free article] [PubMed] [Google Scholar]
- 32.Chen R, Aschmann HE, Chen YH, et al. Racial and ethnic disparities in estimated excess mortality from external causes in the US, March to December 2020. JAMA Intern Med. 2022;182(7):776–778. [DOI] [PMC free article] [PubMed] [Google Scholar]
- 33.Rossen LM, Branum AM, Ahmad FB, Sutton P, Anderson RN. Excess deaths associated with COVID-19, by age and race and ethnicity—United States, January 26-October 3, 2020. MMWR Morb Mortal Wkly Rep. 2020;69(42):1522–1527. [DOI] [PMC free article] [PubMed] [Google Scholar]
- 34.Shiels MS, Haque AT, Haozous EA, et al. Racial and ethnic disparities in excess deaths during the COVID-19 pandemic, March to December 2020. Ann Intern Med. 2021;174(12):1693–1699. [DOI] [PMC free article] [PubMed] [Google Scholar]
- 35.Chen YH, Riley AR, Duchowny KA, et al. COVID-19 mortality and excess mortality among working-age residents in California, USA, by occupational sector: a longitudinal cohort analysis of mortality surveillance data. Lancet Public Health. 2022;7(9):e744–e753. [DOI] [PMC free article] [PubMed] [Google Scholar]
- 36.Magesh S, John D, Li WT, et al. Disparities in COVID-19 outcomes by race, ethnicity, and socioeconomic status: a systematic-review and meta-analysis. JAMA Netw Open. 2021;4(11):e2134147. [DOI] [PMC free article] [PubMed] [Google Scholar]
- 37.Chen YH, Matthay EC, Chen R, et al. Excess mortality in California by education during the COVID-19 pandemic. Am J Prev Med. 2022;63(5):827–836. [DOI] [PMC free article] [PubMed] [Google Scholar]
- 38.Passel JS, Lopez MH, Cohn D. U.S. Hispanic Population Continued its Geographic Spread in the 2010s. Accessed June 1, 2023. https://www.pewresearch.org/short-reads/2022/02/03/u-s-hispanic-population-continued-its-geographic-spread-in-the-2010s/
- 39.Siegel M, Critchfield-Jain I, Boykin M, Owens A. Actual racial/ethnic disparities in COVID-19 mortality for the non-Hispanic Black compared to non-Hispanic White population in 35 US states and their association with structural racism. J Racial Ethn Health Disparities. 2022;9(3):886–898. [DOI] [PMC free article] [PubMed] [Google Scholar]
- 40.Rossen LM, Ahrens KA, Womack LS, Uddin SFG, Branum AM. Rural-urban differences in maternal mortality trends in the United States, 1999–2017: accounting for the impact of the pregnancy status check-box. Am J Epidemiol. 2022;191(6):1030–1039. [DOI] [PMC free article] [PubMed] [Google Scholar]
- 41.Stokes AC, Lundberg DJ, Bor J, Bibbins-Domingo K. Excess deaths during the COVID-19 pandemic: implications for US death investigation systems. Am J Public Health. 2021;111(S2):S53–S54. [DOI] [PMC free article] [PubMed] [Google Scholar]
Associated Data
This section collects any data citations, data availability statements, or supplementary materials included in this article.