

Abstract
Asgard is a recently discovered superphylum of archaea that appears to include the closest archaeal relatives of eukaryotes1–5. Debate continues as to whether the archaeal ancestor of eukaryotes belongs within the Asgard superphylum or whether this ancestor is a sister group to all other archaea (that is, a two-domain versus a three-domain tree of life)6–8. Here we present a comparative analysis of 162 complete or nearly complete genomes of Asgard archaea, including 75 metagenome-assembled genomes that—to our knowledge—have not previously been reported. Our results substantially expand the phylogenetic diversity of Asgard and lead us to propose six additional phyla that include a deep branch that we have provisionally named Wukongarchaeota. Our phylogenomic analysis does not resolve unequivocally the evolutionary relationship between eukaryotes and Asgard archaea, but instead—depending on the choice of species and conserved genes used to build the phylogeny— supports either the origin of eukaryotes from within Asgard (as a sister group to the expanded Heimdallarchaeota–Wukongarchaeota branch) or a deeper branch for the eukaryote ancestor within archaea. Our comprehensive protein domain analysis using the 162 Asgard genomes results in a major expansion of the set of eukaryotic signature proteins. The Asgard eukaryotic signature proteins show variable phyletic distributions and domain architectures, which is suggestive of dynamic evolution through horizontal gene transfer, gene loss, gene duplication and domain shuffling. The phylogenomics of the Asgard archaea points to the accumulation of the components of the mobile archaeal ‘eukaryome’ in the archaeal ancestor of eukaryotes (within or outside Asgard) through extensive horizontal gene transfer.
Asgard is a recently discovered archaeal superphylum that is rapidly expanding, owing to metagenomic sequencing1–5. The Asgard genomes encode many more of the diverse eukaryotic signature proteins (ESPs) than do other archaea. The Asgard ESPs are enriched in proteins that are involved in membrane trafficking, vesicle formation and transport, cytoskeleton formation, and the ubiquitin network, which suggests that these archaea possess a eukaryote-type cytoskeleton and an intracellular membrane system2.
The discovery of the Asgard archaea had a substantial effect on debates surrounding the evolutionary relationship between eukaryotes and archaea, revolving around whether there are two or three domains in the tree of life6–8. The central question is whether the eukaryotic nuclear lineage evolved from a common ancestor that was shared with archaea (as in the three-domain tree) or from within the archaea (as in the two-domain tree). Previous phylogenomic analysis of the Asgard archaea has yielded strong support for a two-domain tree in which eukaryotes appear to share common ancestry with one of the Asgard lineages (Heimdallarchaeota)1,2,5. However, arguments have also been made for a three-domain topology: in particular, on the basis of the purported instability of the two-domain topology and on the phylogenetic analysis of RNA polymerases (which are some of the most highly conserved and universal proteins9,10)—arguments that have, in turn, been followed by counterarguments for two domains11.
Molecular phylogenetic methods alone are insufficient to resolve the ancestral relationship between archaea and eukaryotes, and supporting biological evidence is also required12. For example, the transition from the archaeal ether-linked membrane lipids to the eukaryotic ester-linked lipids that constitute eukaryotic (and bacterial) membranes13 is a major problem for scenarios in which eukaryotes have their origins in Asgard or any other archaeal lineage. Asgard archaea appear to possess an actin cytoskeleton that is regulated by accessory proteins (such as profilins and gelsolins) and an endosomal sorting complex required for transport machinery (ESCRT) that could function similarly to their eukaryotic counterparts14–16. Together with the presence of other ESPs, these observations imply an ancestral relationship between Asgard archaea and eukaryotes1,2,5. However, the biology of Asgard archaea remains poorly understood, in large part because of their recalcitrance to growth in culture17. To date, only one Asgard archaeon (‘Candidatus Prometheoarchaeum syntrophicum’ strain MK-D1) has been isolated, grown in culture and sequenced to obtain a complete, closed genome17. This organism has been reported to form extracellular protrusions that are involved in its interaction with syntrophic bacteria, but no visible organelle-like structure and little apparent intracellular complexity.
Here we describe the metagenomic mining of the expanding diversity of the Asgard superphylum, which includes the identification of six additional phylum-level lineages that thrive in a wide variety of eco-systems and that we infer possess versatile metabolic capacities. We show that these uncultivated Asgard groups carry a broad repertoire of ESPs, many of which—to our knowledge—have not previously been reported. Phylogenomic analysis of these genomes provides insights into the evolution of Asgard archaea but does not resolve whether the origins of eukaryotes lie within or outside Asgard.
Asgard genomes from metagenomics data
We reconstructed 75 metagenome-assembled genomes (MAGs) from the Asgard superphylum of archaea that, to our knowledge, have not previously been reported. These MAGs were recovered from highly diverse environments (Extended Data Fig. 1, Methods, Supplementary Table 1). For all of the analyses described in this Article, these 75 MAGs were combined with 87 publicly available genomes to produce a set of 162 Asgard genomes (Extended Data Figs. 2a, 3, Supplementary Information).
To improve the annotation of Asgard genomes and develop a platform for Asgard comparative genomics, we constructed clusters of orthologous genes (COGs) for Asgard and used computational methods to annotate as many Asgard proteins as possible—in particular attempting to expand the catalogue of Asgard ESPs (Methods, Supplementary Information). On average, 89% of the proteins encoded in the analysed genomes were covered by Asgard COGs (Supplementary Table 1). Thus, the Asgard COGs appear to be an efficient tool for the annotation and comparative genomic analysis of Asgard MAGs and complete genomes.
Expanding phylogenetic diversity of Asgard
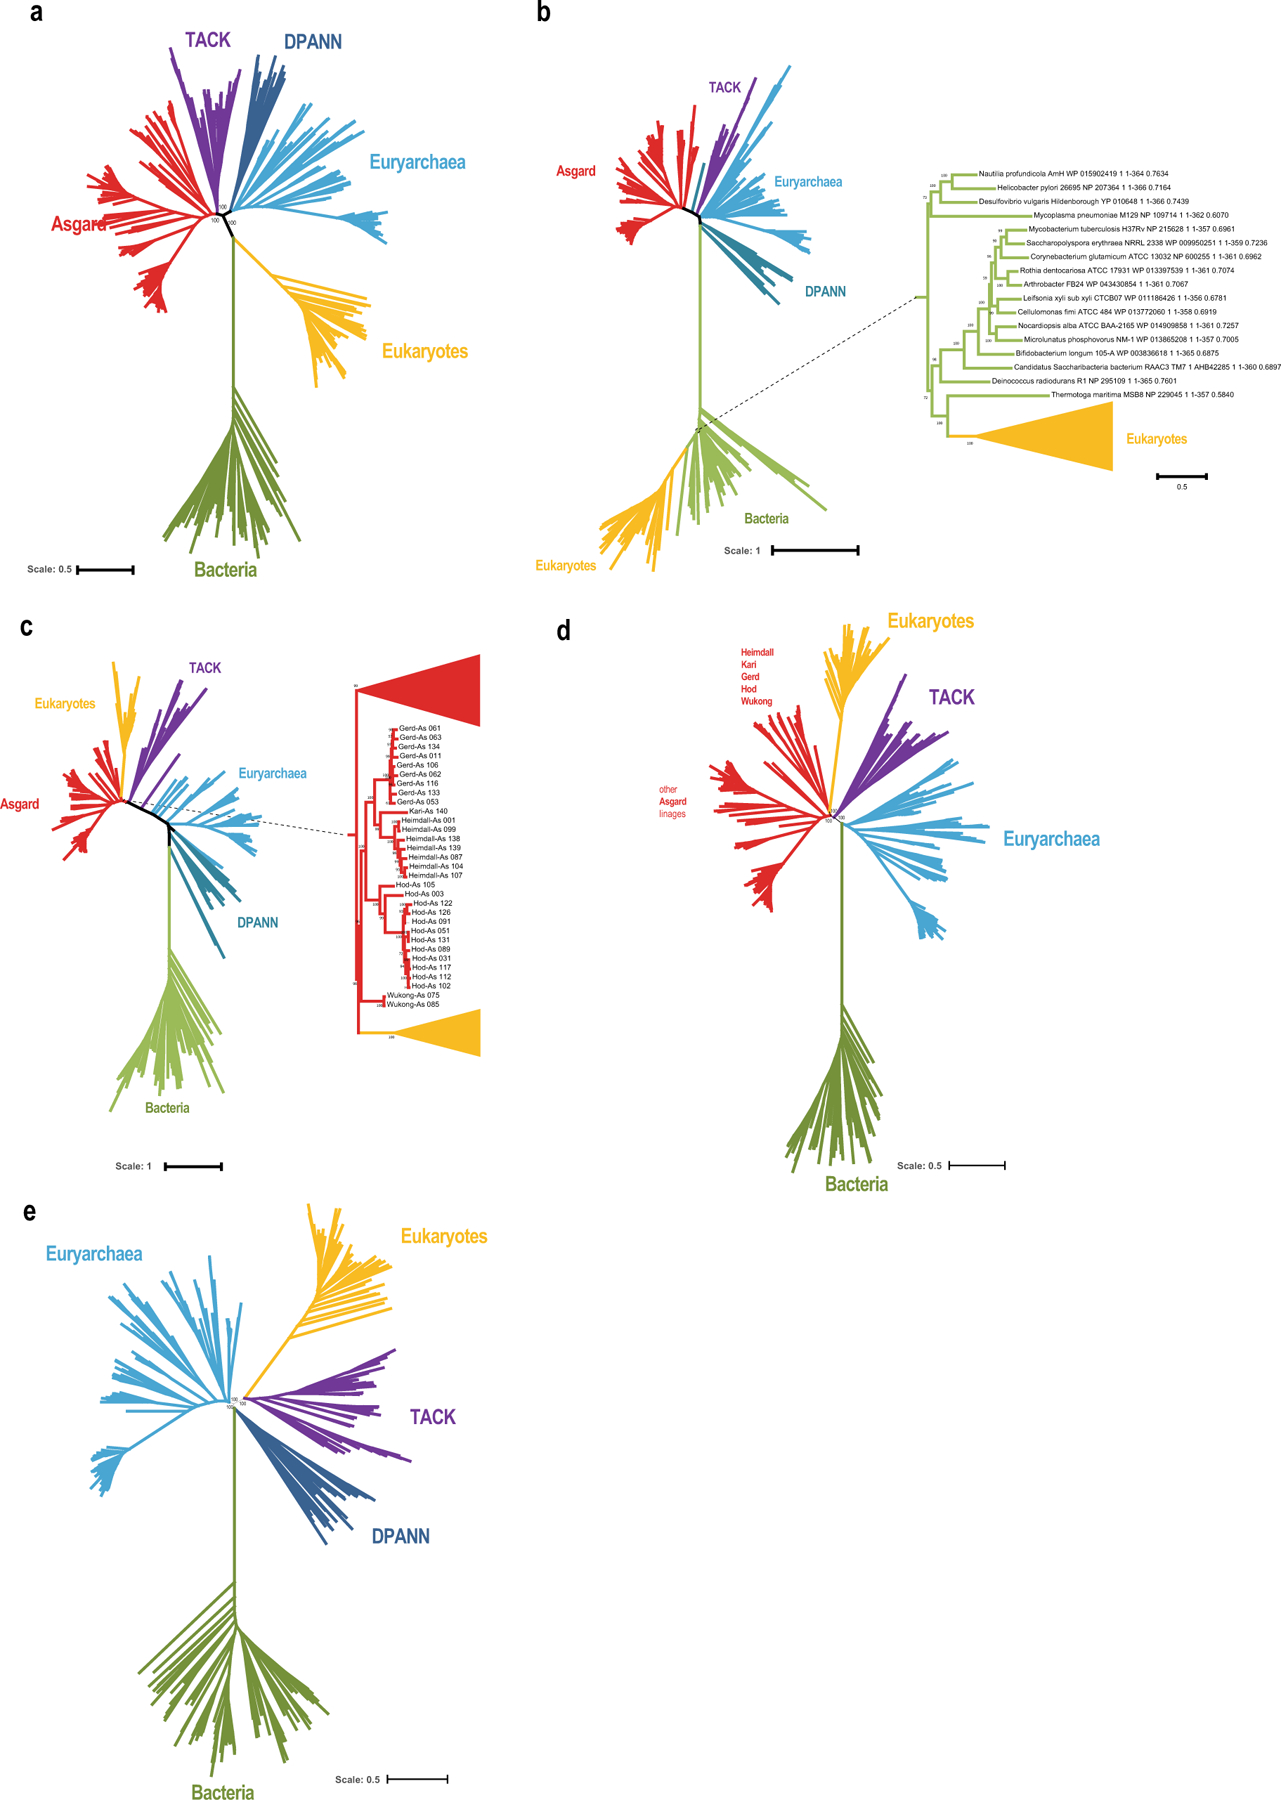
Our phylogenetic analysis of the Asgard MAGs on the basis of a concatenated alignment of 209 core Asgard COGs that are conserved in most of the Asgard archaea (supplementary data file 2; links to supplementary data files are provided in the ‘Data availability’ section of the Methods) placed many of the genomes reported here into previously delineated phylum-level Asgard lineages (Fig. 1a, Supplementary Table 1, supplementary data file 2). Additionally, we identified 6 previously unknown major Asgard lineages that appear to be strong candidates for phyla (Fig. 1a, b, Supplementary Table 1, ‘Taxonomic description of new taxa’ in Supplementary Information, supplementary data file 1). A clade formed by the lineages represented by the MAGs As_085 and As_075 is a deeply branching sister group to Heimdallarchaeota2. Our phylogenetic analysis supported further splitting ‘Heimdallarchaeota’ into four phylum-level lineages according to the branch length in the concatenated phylogeny (Methods). The putative phyla within the current Heimdallarchaeota include the previously defined Gerdarchaeota4, and three additional phyla (represented by the MAGs As_002 (LC2), As_003 (LC3) and As_001 (AB_125)). We identified another three putative phylum-level lineages, which were related to Helarchaeota, Lokiarchaeota and Thorarchaeota, respectively (Fig. 1a). All Asgard phyla appeared as well-supported clades along with most of the inter-phyla relationships, and were buttressed by comparisons of the mean amino acid identity and 16S rRNA sequence identity (Fig. 1b, Extended Data Figs. 4, 5, Supplementary Tables 2, 3).
Fig. 1 |. Phylogenetic analysis of Asgard archaea and their relationships with eukaryotes.
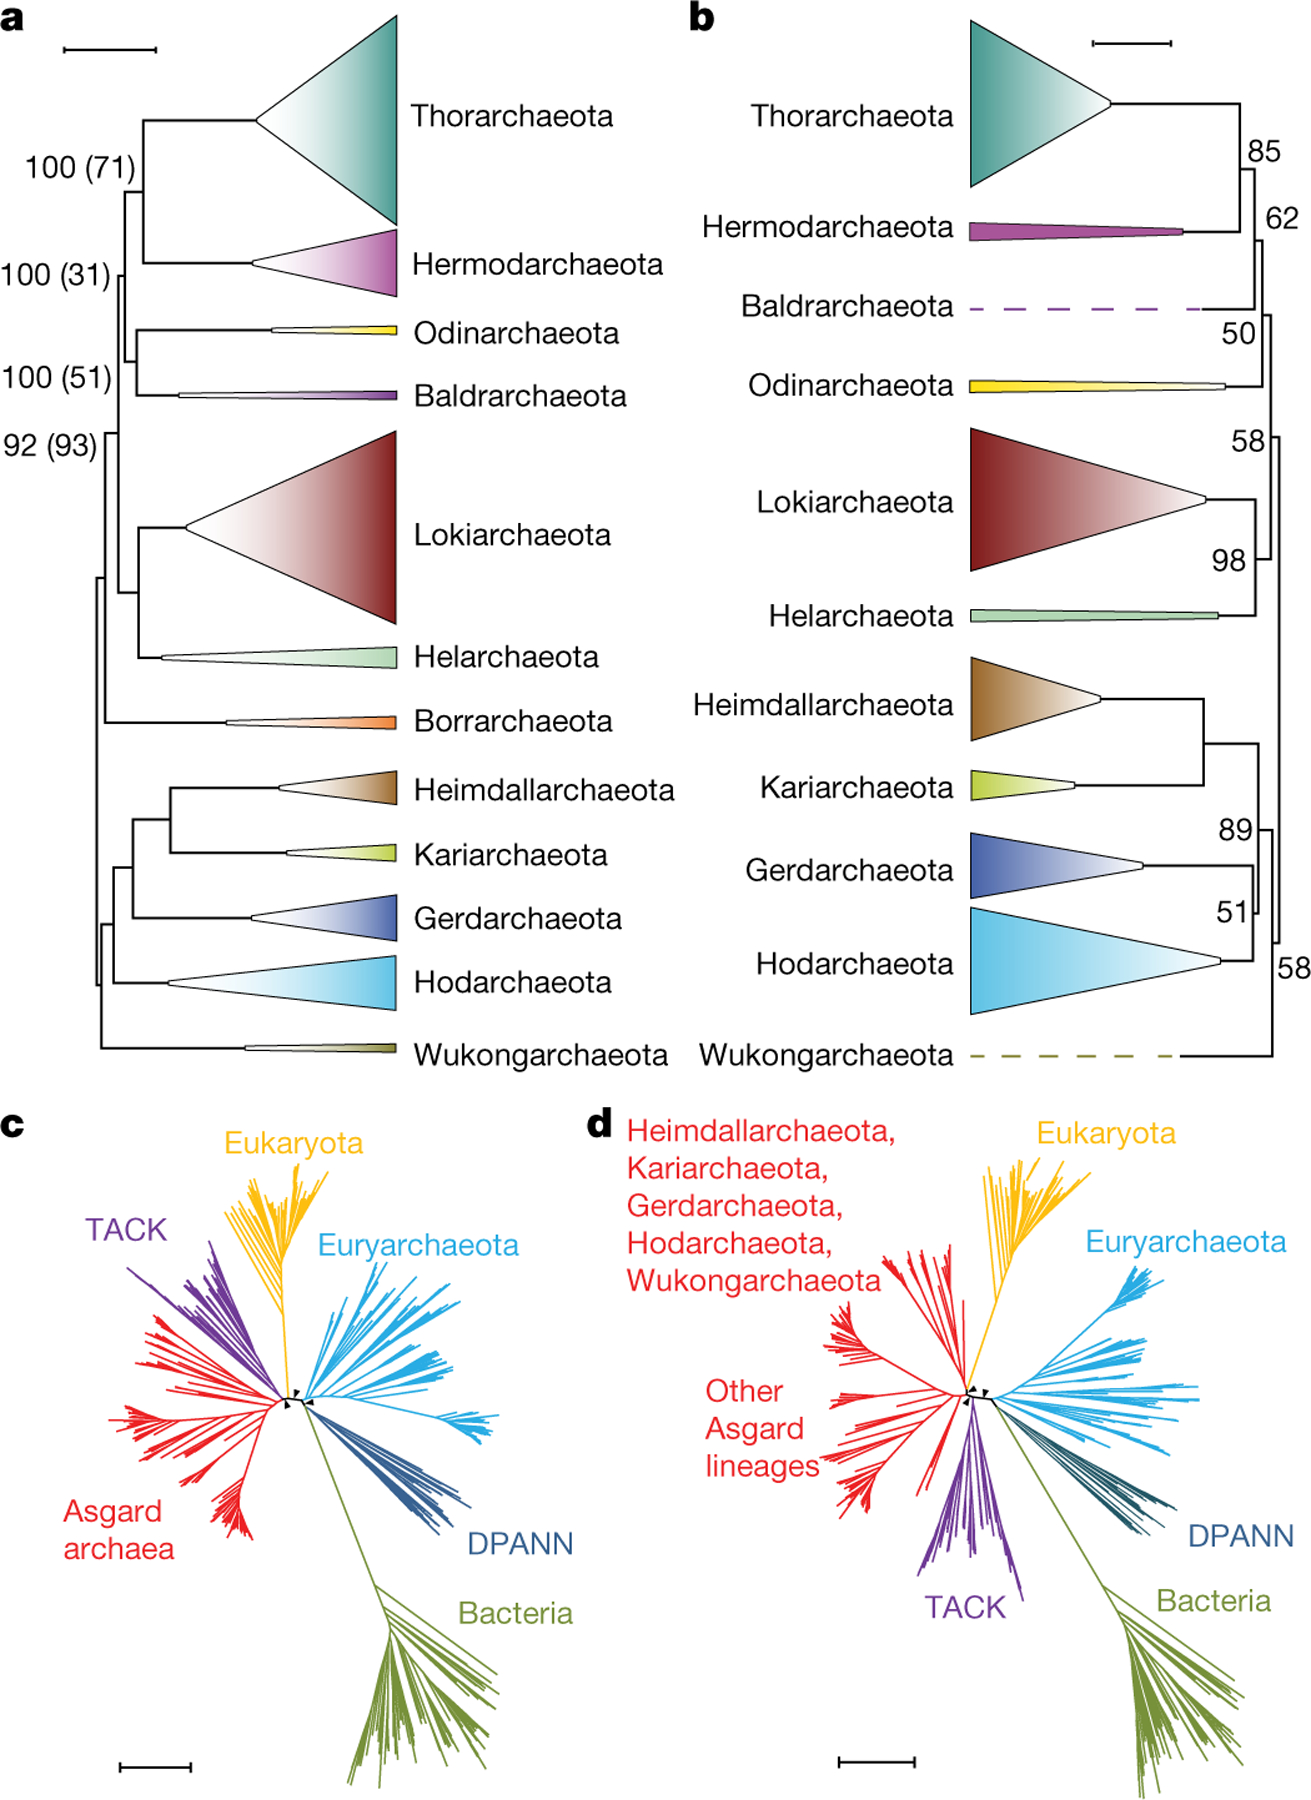
a, Maximum likelihood tree (inferred with IQ-tree and the LG + F + R10 model) constructed from the concatenated alignments of the protein sequences from 209 core Asgard COGs. Only the 12 phylum-level clades are shown (species within each clade are collapsed) (Methods, Supplementary Table 5). Support values in parentheses indicate the frequency of the corresponding bipartition among 100 bootstrap-like samples of the 209 core Asgard COGs; where these are not indicated, both support values were 100. The root position was inferred from the global tree (c). Scale bar, 0.5 average amino acid substitutions per site. b, Maximum-likelihood tree (inferred with IQ-tree and the GTR + F + G model) on the basis of 16S rRNA gene sequences. Support values (percentage points) are indicated for 1,000 ultrafast bootstrap samples only for values that are less than 100. The root position was inferred from the global tree (c). Scale bar, 0.2 average nucleotide substitutions per site. c, Phylogenetic tree of bacteria, archaea and eukaryotes (inferred with IQ-tree under the LG + R10 model) constructed from the concatenated alignments of the protein sequences the correspond to 29 universally conserved genes, excluding COG0012 (Methods). The tree shows the relationships among the major clades. The tree is unrooted and is shown in a pseudorooted form for visualization purposes only. The arrowheads indicate 100 bootstrap support. DPANN, Diapherotrites, Parvarchaeota, Aenigmarchaeota, Nanoarchaeota and Nanohaloarchaeota. d, The consensus topology of 129 trees of bacteria, archaea and eukaryotes, constructed from the concatenated protein sequence alignments of bootstrap-like samples and leave-one-out sets of the of 29 universally conserved markers, excluding COG0012 (Methods). The tree shows the relationships between the major clades; tree branch lengths and support values are derived from the full 29-marker alignment; the arrowheads indicate 100 bootstrap support. The tree is unrooted and is shown in a pseudorooted form for visualization purposes only. The complete trees and alignments are in supplementary data file 2; lists of the trees are provided in Supplementary Tables 4, 5. Scale bars, 0.5 average amino acid substitutions per site (c, d).
We propose the name Wukongarchaeota (derived from Sun Wukong (The Monkey King), a figure in Chinese mythology) for the putative phylum that was represented by the MAGsAs_085 and As_075(‘Candidatus Wukongarchaeumyapensis’),and names of Norse deities for the other five proposed phyla: (1) Hodarchaeota for MAG As_027 (‘Candidatus Hodarchaeum mangrovi’); (2) Kariarchaeota for MAG As_030 (‘Candidatus Kariarchaeum pelagius’); (3) Borrarchaeota for MAG As_133 (‘Candidatus Borrarchaeum yapensis’); (4) Baldrarchaeota, for MAG As_130 (‘Candidatus Baldrarchaeum yapensis’); and (5) Hermodarchaeota18 for MAG As_086 (‘Candidatus Hermodarchaeum yapensis’) (Fig. 1a, ‘Taxonomic description’ in Supplementary Information).
The gene content of Asgard MAGs agrees well with the phylogenetic structure of the superphylum. The phyletic patterns of the Asgard COGs form clusters that generally correspond to the clades that we identified by phylogenetic analysis (Extended Data Fig. 6a), which suggests that gene gain and loss within Asgard largely proceeded in a clock-like manner and/or that horizontal gene exchange preferentially occurred between genomes within the same clade.
The core set of conserved Asgard genes includes 378 Asgard COGs (Extended Data Fig. 6b, Supplementary Table 6, Supplementary Information). Most of these protein families (293 (77%)) are universal (present in bacteria, other archaea and eukaryotes), 62 (16%) are represented in other archaea and eukaryotes but not in bacteria, 15 (4%) are found in other archaea and bacteria but not in eukaryotes, 7 (2%) are archaea-specific and only 1 (0.003%) is shared exclusively with eukaryotes (Extended Data Fig. 6c).
Asgard–eukaryote evolutionary relationship
We constructed a universal phylogeny that included representative sets of species from all three domains of life. The tree was built from alignments of 30 families of universally conserved orthologous proteins19–21 of 162 Asgard archaea, 286 other archaea, 98 bacteria and 72 eukaryotes. A concatenated alignment of 7,411 positions was generated for these protein families (Methods, Supplementary Table 4), and a phylogenetic tree was built using IQ-tree (Methods, Supplementary Table 5). The resulting tree had the three-domain topology, with high support values for all key bifurcations (Extended Data Fig. 7a, supplementary data file 2).
We assessed the effect of the choice of phylogenetic marker on the tree topology by (1) generating 30 sets of 29 markers by removing each of the 30 markers from the original set and (2) generating 100 bootstrap-like random, independent samples of markers. The concatenated alignment of each subsampled set of markers was then analysed using IQ-tree and the automatically chosen evolutionary model. The three-domain topology hinged on the presence of a single marker, COG0012 (ribosome-binding ATPase YchF)22. All of the samples that included COG0012 strongly supported the three-domain topology. By contrast, the set of 29 markers without COG0012 (Fig. 1c) and all 32 bootstrap-like samples that did not contain COG0012 equally strongly supported the two-domain topology with varying placement of eukaryotes within archaea (Supplementary Table 5, supplementary data file 2). In the COG0012 tree (unlike the rest of the individual trees), the eukaryotic clade came from within bacteria—apparently reflecting horizontal gene transfer from bacteria to eukaryotes—and was associated with a signal that was strong enough to pull the eukaryote branch towards bacteria and bias the 30-marker tree topology towards three domains (Extended Data Fig. 7b, supplementary data file 2).
We then performed a bootstrap-like subsampling on the set of the 29 markers excluding COG0012. Of the 100 trees that were constructed from concatenated alignments of 14 to 23 sampled markers, 99 had the two-domain topology and only one had the three-domain topology (Supplementary Table 5, supplementary data file 2). Among these, in 62 trees the eukaryote branch occupied different positions within the Asgard archaea—most commonly, as a sister group to the Heimdallarchaeota–Gerdarchaeota–Kariarchaeota–Hodarchaeota–Wukongarchaeota clade (53 trees). In 23 trees, eukaryotes were a sister group to the Asgard and Thaumarchaeota–Aigarchaeota–Crenarchaeota–Korarchaeota (TACK) superphyla combined clade (supplementary data file 2). A leave-one-out analysis of all possible 29 sets of 28 genes each also fully supported the two-domain topology and confirmed the lack of substantial effect of any of the individual genes (Supplementary Table 5). A consensus tree of the 100 bootstrap-like marker samples and 29 leave-one-out marker samples shows eukaryotes branching from within Asgard archaea, as a sister to the Heimdallarchaeota–Gerdarchaeota–Kariarchaeota–Hodarchaeota–Wukongarchaeota clade (Fig. 1d). Additional tests that support the robustness of the obtained phylogenies are described in Supplementary Information.
The results of our phylogenetic analysis strongly support the two-domain topology. The topology of our 29-marker phylogenetic tree (Fig. 1c) within the archaeal clade was mostly consistent with the tree obtained in a preliminary analysis of a larger set of archaeal genomes and a larger marker gene set23. The affinity of the eukaryotes with the expanded Heimdallarchaeota–Wukongarchaeota branch within Asgard (Fig. 1d) appears to be the most likely topology. However, there is also some support for a deeper branching of eukaryotes within archaea (Fig. 1c).
Eukaryotic features of Asgard archaea
The enrichment of Asgard proteomes with homologues of ESPs (such as ESCRTs, components of protein sorting complexes including coat proteins, complete ubiquitin machinery, actins and actin-binding proteins, gelsolins and profilins) may be the strongest argument for a direct evolutionary relationship between Asgard archaea and eukaryotes2,24. The sequences of some ESPs are highly diverged and are hardly detectable with standard computational methods. Our computational strategy for delineating an extensive yet robust ESP set is described in the Methods. The ESP set that we identified contained 505 Asgard COGs, including 238 that were not closely similar to those that have previously been described2 (Supplementary Table 7). In general agreement with previous observations, the majority of these ESPs (329 out of 505) belonged to the ‘intracellular trafficking, secretion and vesicular transport’ functional class (U), followed by ‘posttranslational modification, protein turnover and chaperones’(O class), with 101 Asgard COGs (Supplementary Table 7). Among the Asgard COGs in the U class, 130 included proteins of the roadblock superfamily, including longins, sybindin and profilins; 94 included small GTPases of several families (such as RagA-like, Arf-like and Rab-like), in agreement with previous observations25.
The phyletic patterns of Asgard COGs that correspond to ESPs in Asgard archaea were extremely patchy and largely lineage-specific (Extended Data Fig. 8), which indicates that most of these proteins have not uniformly been conserved throughout Asgard evolution but instead are prone to frequent horizontal gene transfer, gene losses and duplications (to exclude effects of genome incompleteness, this analysis was performed for 76 Asgard genomes that were estimated to be at least 90% complete). Capture of genes via horizontal gene transfer, gene loss and duplication are correlated in prokaryotes, which produces an overall picture of dynamic evolution (especially in U class of COGs)26. Even the Asgard COGs for the most highly conserved ESPs are missing in some Asgard lineages, but proliferate in others (Extended Data Fig. 8, Supplementary Table 7). We detected many gaps in the distribution of ESPs in the expanded Heimdallarchaeota–Wukongarchaeota clade, the likely sister group of eukaryotes (Fig. 1d).
Characteristically, many ESPs are multidomain proteins: 37% assigned to more than one Asgard COG (compared to 17% among non-ESPs) (Supplementary Table 7). Some multidomain ESPs in Asgard archaea have the same domain organization as their homologues in eukaryotes, but these are a minority and typically contain only two domains (for example, the fusion of two EAP30 domains27, and Vps23 and E2 domains27 in ESCRT complexes, and several Rag-family GTPases in which the longin domain is fused to the GTPase domain, among others). However, most of the domain architectures of the multidomain ESPs from Asgard were not detected in eukaryotes and often are found only in narrow subsets of Asgard archaea, which suggests there has been extensive domain shuffling during Asgard evolution (Fig. 2a). Notable findings included the presence of many ESPs that contain a ‘differentially expressed in normal and neoplastic cells’ (DENN) domain (previously identified only in eukaryotes), which is a component of the conserved, essential folliculin and Ragulator complexes28,29 (Fig. 2b), and a longin domain, which is a component of the GATOR1 complex (a key amino acid starvation sensor)30 (Fig. 2c, Supplementary Information).
Fig. 2 |. Domain architectures of selected ESPs in Asgard archaea.
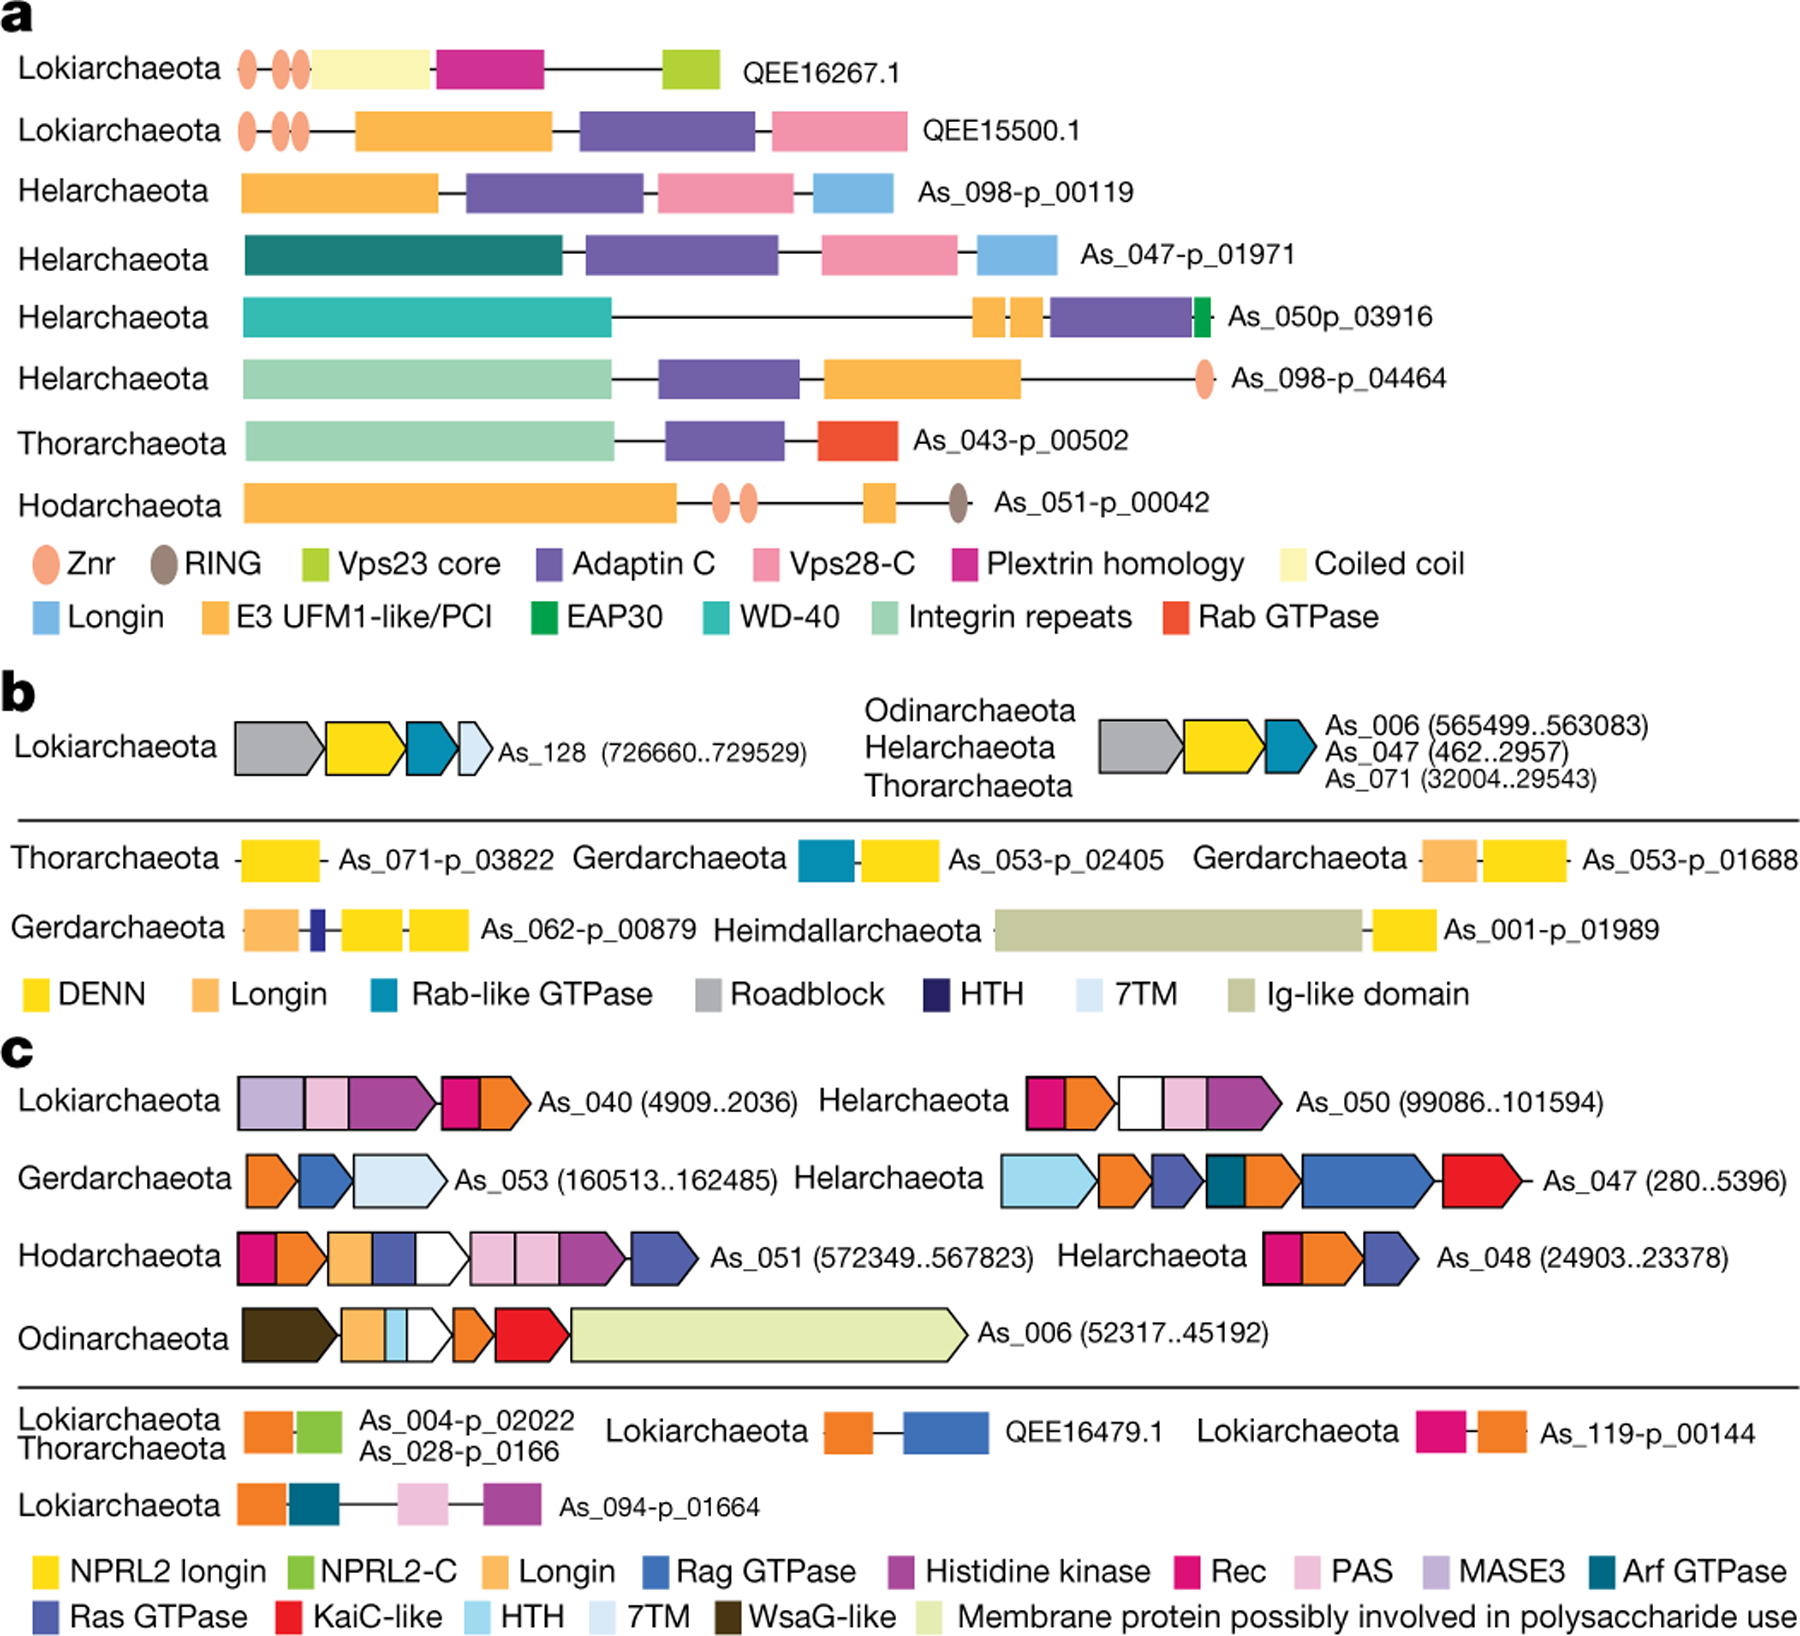
a, ESPs with unique domain architecture. The schematics of multidomain proteins are roughly proportional to the respective protein lengths. The identified domains are shown as rectangles inside the arrows approximately according to their location. Homologous domains are shown by the same colour or pattern. For each schematic, protein identifier and lineage are indicated. b, DENN domain proteins in Asgard archaea. Above the line: putative operons encoding DENN domain proteins; below the line: domain architectures of diverse proteins containing DENN domain. Genes are shown by block arrows, roughly to scale. For each operon, the nucleotide contig identifier and coordinates are indicated. Homologous domains are colour-coded. Other designations are as in a. c, NPRL2-like proteins in Asgard archaea. Designations are as in b. Znr, zinc ribbon; HTH, helix-turn-helix domain; 7TM, seven transmembrane domain; Ig, immunoglobulin domain; Rec, receiver domain; PAS, Per-Arnt-Sim domain; MASE, membrane-associated sensor domain; -C, C-terminal domain.
Metabolism in Asgard and syntrophic evolution
Examination of the distribution of the Asgard COGs among the 12 Asgard phyla showed that the metabolic pathways were conserved among the MAGs of each phylum but differed between the phyla (Extended Data Fig. 9). Three distinct lifestyles were predicted by the Asgard COG analysis for different major branches of Asgard archaea: anaerobic heterotrophy, facultative aerobic heterotrophy and chemolithotrophy (Fig. 3, Extended Data Figs. 9, 10). For the last Asgard archaeal common ancestor, we inferred a mixotrophic lifestyle (including both the production and consumption of H2) from parsimony considerations (Fig. 3, Methods, Supplementary Table 8, Supplementary Information).
Fig. 3 |. Reconstruction and evolution of key metabolic processes in Asgard archaea.
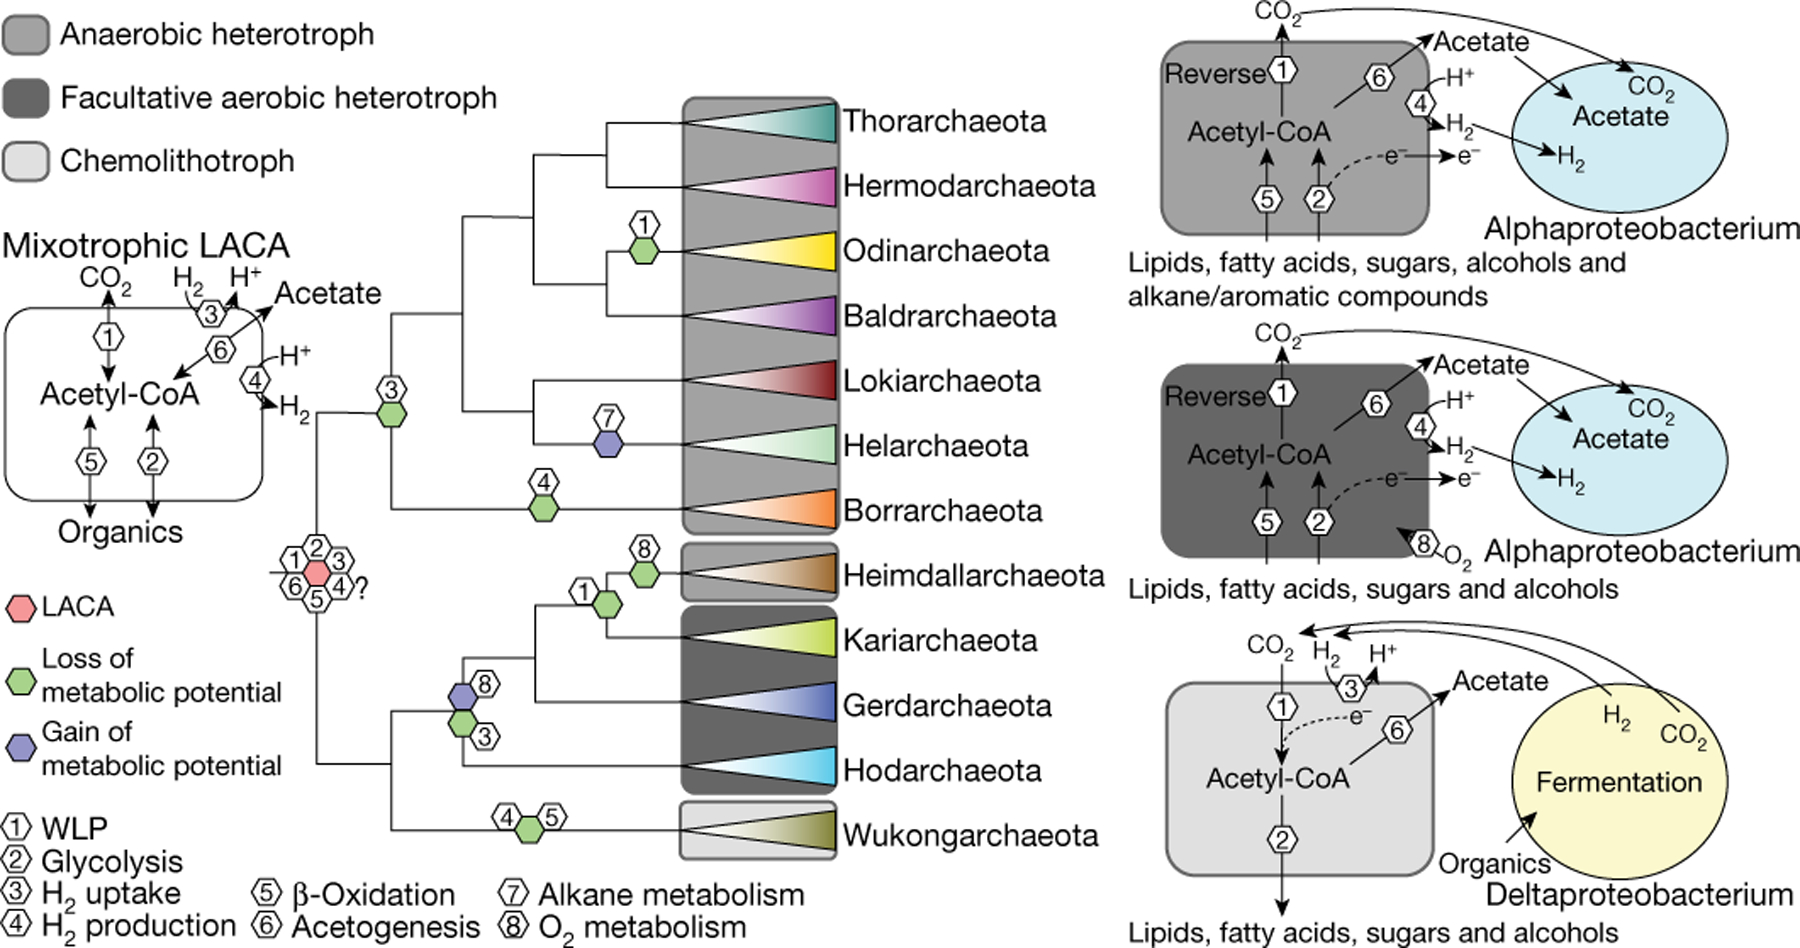
The schematic phylogeny of Asgard archaea is from Fig. 1a. LACA, last Asgard common ancestor; WLP, Wood–Ljungdahl pathway.
Eukaryogenesis has previously been proposed to involve metabolic symbiosis (syntrophy) between an archaeon and one or two bacterial partners, which—in the original hydrogen-syntrophy hypothesis—were postulated to donate H2 for methane or hydrogen sulfide production by the consortium31–33. Syntrophic scenarios were boosted by the discovery of apparent syntrophy between ‘Candidatus P. syntrophicum’ and deltaproteobacteria, which prompted the entangle–engulf–endogenize model of eukaryogenesis17,34. Reconstruction of the metabolism of ‘Candidatus P. syntrophicum’ has suggested that this organism was hydrogen-dependent, in accordance with hydrogen-syntrophic scenarios33. By contrast, subsequent analysis of the metabolic potentials of four Asgard phyla led to the ‘reverse flow model’ of protoeukaryote energy metabolism, which involves electron or hydrogen flow from an Asgard archaeon to the alphaproteobacterial ancestor of mitochondria (in the opposite direction from that in the original hydrogen-syntrophy hypotheses)35. Here we discovered the deeply branching Asgard group Wukongarchaeota, which appears to include obligate hydrogenotrophic acetogens; this suggests that the last Asgard archaeal common ancestor was a hydrogen-dependent autotroph (Fig. 3, Supplementary Information). Depending on the exact relationship between Asgard archaea and eukaryotes, our findings could be compatible with different syntrophic scenarios that postulate H2 transfer from bacteria to the archaeal symbiont or in the opposite direction.
Conclusions
The recently discovered Asgard archaea have grown into a highly diverse archaeal superphylum. The most notable feature of the Asgard archaea is their apparent evolutionary affinity with eukaryotes, which is buttressed by two independent lines of evidence: phylogenetic analysis of highly conserved genes and the detection of several ESPs that are absent or far less common in other archaea. The 75 MAGs added here substantially extend the phylogenetic and functional diversity of the Asgard superphylum. Phylogenetic analyses of universally conserved genes from an expanded set of archaea, bacteria and eukaryotes support the two-domain tree topology, with the Heimdallarchaeota–Wukongarchaeota group being the most likely sister group of eukaryotes— although a deeper eukaryotic branch within archaea could not be ruled out. Further phylogenomic study with an even broader representation of diverse archaeal lineages, extended sets of phylogenetic markers and—possibly—more sophisticated evolutionary models are required to clarify the relationships between archaea and eukaryotes.
Our analysis of Asgard genomes expanded the set of ESPs encoded by this group of archaea and revealed numerous and complex domain architectures, further emphasizing the excess of ESPs in Asgard archaea compared to other archaea as well as the preponderance of ESPs involved in membrane remodelling and intracellular trafficking. Most of the multidomain Asgard ESPs possess domain architectures that are distinct from those of typical eukaryotic counterparts, and some include prokaryotic signature domains, which suggests that there are substantial functional differences between Asgard systems and the respective eukaryotic systems. Almost all ESPs show patchy distributions in Asgard and other archaea, which is indicative of a complex history of extensive horizontal gene transfer, gene losses and gene family expansion. All of these findings seem to be best compatible with a model of a dispersed, dynamic archaeal eukaryome36 that widely spread among archaea via horizontal gene transfer, and which has reached its highest ESP density in the Asgard archaea. The ancestors of eukaryotes might have accumulated even more components of the eukaryome than the known Asgard archaea, which eventually gave rise to eukaryote-like cells (probably through syntrophy with one or more bacterial partners).
Methods
No statistical analysis dependent on predetermined sample size, randomization or blinding was involved.
Sampling collections and DNA sequencing
The YT samples were obtained from the Rongcheng Swan Lake Nature Reserve (Rongcheng) on 15 November 2018. The sediment cores were collected using columnar samplers at depth intervals of 0–2, 21–26 and 36–41 cm in a seagrass meadow and a non-seagrass-covered site nearby. After collection, bulk sediments were immediately sealed in plastic bags, placed in a precooled icebox and transported to the laboratory within 4 h. For each sample, DNA was extracted from 10 g sediment using PowerSoil DNA Isolation kit (Qiagen), according to the manufacturer’s protocol. Following extraction, nucleic acids were sequenced using Illumina HiSeq2500 (Illumina) PE150 by Novogene. The MP5 samples were obtained from Mai Po Nature Reserve (Hong Kong) on 12 September 201437. Three subsurface sediment samples were collected from a site covered with mangrove forest at depth intervals of 0–2, 10–15 and 20–25 cm. Two subsurface sediment samples were taken at an intertidal mudflat with depths of 0–5 and 13–16 cm. Samples were transported back to the laboratory as described for the YT metagenomes. DNA was extracted from 5 g wet sediment per sample using the PowerSoil DNA Isolation Kit (MO BIO) following the manufacturer’s protocol. Metagenomic sequencing data were generated using Illumina HiSeq2500 (Illumina) PE150 by Novogene.
The FT samples were taken from Futian Nature Reserve (Shenzhen) on 17 April 2017. Sediment samples were collected as described for YT samples at depth intervals of 0–2, 6–8, 12–14, 20–22 and 28–30 cm. DNA was extracted from 5 g wet sediment per sample using DNeasy PowerSoil kit (Qiagen) as per the manufacturer’s instructions. Nucleic acids were sequenced using Illumina HiSeq2000 (Illumina) PE150 by Novogene.
The surface sediment sample of the CJE metagenome was collected from Changjiang estuary during a cruise on 16 August 2016. The sample was taken from the water bed, sealed immediately in a 50-ml tube and stored in liquid nitrogen on board. After transportation to the laboratory, 10 g wet sediments were used for DNA extraction as per the manufacturer’s protocol. Nucleic acids were sequenced using Illumina HiSeq2000 (Illumina) PE150 by Novogene.
The oil-sand sample was collected from Shengli oilfield (Shandong) on 18 October 2018 into bottles, which were transported to the laboratory where they were stored at 4 °C. The sample was used as inoculum to perform enrichment with anaerobic medium in vials, as previously described38. After 253 days of enrichment, the genomic DNA was extracted as previously described39. Nucleic acids were sequenced Illumina HiSeq2000 (Illumina) PE150 by Novogene
For the sediment and sand samples, there is no specific forbiddance in local and national law to access and collect samples only for science and study.
The seawater samples of Yap metagenomes were collected at Yap trench region by CTD SBE911plus (Sea-Bird Electronics) during the 37th Dayang cruise (4 June 2016 to 12 July 2016) with a permit from the Federated States of Micronesia. Seawater (8 l per sample) was filtered through a 0.22-μm-mesh membrane filter immediately after recovery, on board. The membrane was then cut into approximately 0.2-cm2 pieces with flame-sterilized scissors and added to a PowerBead Tube (MO BIO) and the subsequent steps were implemented according to the manufacturer’s protocol to extract DNA. The DNA per sample was amplified in five separate reactions using REPLI-g Single Cell Kits (Qiagen) following the manufacturer’s protocol, given the challenging nature of sample retrieval and DNA recovery. The products were pooled and purified using QIAamp DNA Mini Kit (Qiagen) according to the manufacturer’s recommendations. Parallel blank controls were set for sampling, DNA extraction and amplification with 0.22-μm-mesh membrane filtering Milli-Q water (18.2 MΩ; Millipore). Nucleic acids were sequenced using HiSeq X Ten (Illumina) PE150.
Metagenomic assembly, binning and gene calling
FT, MP5 and YT metagenomes.
The FT, MP5 and YT sets of metagenomes were assembled and binned using the same method. Raw shotgun metagenomic sequencing reads were trimmed with the read_qc module from metaWRAP (v.1.1)40. All clean reads from the same set were pooled together before de novo assemble to one coassembly. Clean reads were sent out to MEGAHIT (v.1.1.2) with flag ‘--presets meta-large’ for coassembling job41. Sequencing coverage was determined for each assembled scaffold by mapping reads from each sample to the coassembly using Bowtie242. The binning analysis was carried out 8 times with 8 different combinations of specificity and sensitivity parameters using MetaBAT2 (‘--maxP 60 or 95’ AND ‘--minS 60 or 95’ AND ‘--maxEdges 200 or 500’) on the assembly with a minimum length of 2,000 bp43. DAS Tool (v.1.0) was used as a dereplication and aggregation strategy on these eight binning results to construct accurate bins44. Manual curation was used for reducing genome contamination on the basis of differential coverages, GC content and the presence of duplicate genes.
The depth coverage and N50 statistics of 38 Asgard MAGs recovered from YT metagenomes range from 7.72 to 298.86 (median of 21.77) and from 6,658 to 381,755 bp (median of 26,337.5 bp), respectively; for 13 Asgard MAGs recovered from FT metagenomes, the values range from 6.98 to 33.22 (median of 16.89) and from 3,889 to 8,957 bp (median of 5,000 bp), respectively; and for 11 Asgard MAGs recovered from MP5 metagenomes, the values range from 7.06 to 54.42 (median of 10) and from 3,898 to 1,9362 bp (median of 7,581 bp), respectively (Extended Data Fig. 2).
CJE metagenome.
Raw metagenomic shotgun sequencing reads were trimmed using Sickle (https://github.com/najoshi/sickle) with default settings. The trimmed reads were de novo assembled using IDBA-UD (v.1.1.1) with the parameters: ‘-mink 65, -maxk 145, -step 10’45. Sequencing coverage was determined as described in ‘FT, MP5 and YT metagenomes’. The binning analysis were performed with MetaBAT2 12 times, with 12 combinations of specificity and sensitivity parameters (‘--m 1500, 2000, or 2500’ AND ‘--maxP 85 or 90’ AND ‘--minS 80, 85 and 90’) for further refinement43. All binning results were merged and refined using DAS Tool (v.1.0)44.
Two Asgard MAGs recovered from CJE metagenome have a depth coverage of 19.16 and 20.56, and N50 statistics of 8,740 and 5,246 bp (Extended Data Fig. 2b, c).
J65 metagenome.
Raw metagenomic shotgun sequencing reads were trimmed with Trimmomatic (v.0.38)46. The clean reads were then fed to SPAdes (v.3.12.0) for de novo assembly with the parameters: ‘—meta -k 21, 33, 55, 77’47. Sequencing coverage was determined using BBMap (v.38.24) toolkit with the parameters: ‘bbmap.sh minid=0.99’ (https://github.com/BioInfoTools/BBMap). MetaBAT2 (v.2.12.1) was used to perform binning analysis with the parameter: ‘-m 2000’43.
One Asgard MAG recovered from the J65 metagenome had a depth coverage of 14.52 and N50 statistics of 10,460 bp (Extended Data Fig. 2b, c).
Yap metagenome.
For each Yap metagenome, raw metagenomic shotgun sequencing reads were trimmed with Trimmomatic (v.0.38)46. Assembly and binning analysis were performed as described for CJE metagenome for each Yap metagenome.
The depth coverage and N50 statistics of 24 Asgard MAGs recovered from Yap metagenomes range from 7.78 to 82.33 (median of 13.91) and from 5,097 to 889,102 bp (median of 18155.5 bp), respectively. (Extended Data Fig. 2b, c).
A total of 89 Asgard MAGs were reconstructed in this Article. An additional 95 Asgard MAGs were downloaded from public databases (such as the NCBI FTP site). For all 184 genomes, a uniform gene calling protocol was applied. Specifically, the completeness, contamination, and strain heterogeneity of the genomes were estimated by using CheckM (v.1.0.12)48 and DAS Tool under the taxonomic scope of domain (that is, Bacteria and Archaea). Protein-coding genes were predicted using Prodigal (v.2.6.3)49 embedded in Prokka (v.1.13)50. Transfer RNAs were identified with tRNAscan-s.e. (v.1.23) using the archaeal transfer RNA model51. After quality screening, further analysis focused on 162 high quality Asgard MAGs.
Genome set
The Asgard archaea genome set analysed in this Article comprised 161 Asgard MAGs and one complete Asgard genome (Supplementary Table 1). For comparison, selected representative genomes of archaea (296), bacteria (100) and eukaryotes (76) were downloaded from Refseq and GenBank using the NCBI FTP site (ftp://ftp.ncbi.nlm.nih.gov/genomes/all/).
Average amino acid identity
The average amino acid identity across TACK archaeal reference genomes and the 184 Asgard genomes was calculated using compareM (v.0.0.23) with the ‘aai_wf’ at default settings (https://github.com/dparks1134/CompareM).
Construction of Asgard COGs
Initial clustering of 250,634 proteins in 76 Asgard MAGs was performed using two approaches: first, footprints of archaeal COG profiles were obtained by running PSI-BLAST52, initiated with archaeal COG alignments, against the set of predicted Asgard proteins. The footprint sequences were extracted and clustered according to the archaeal-COG best hit. The remaining protein sequences (both full-length proteins and the sequence fragments outside of the footprints, if longer than 60 amino acids) were clustered using MMseqs253, with a similarity threshold of 0.5. Sequences within clusters were aligned using MUSCLE54; the resulting alignments were passed through several rounds of merging and splitting. The merging phase involved comparing alignments to each other using HHSEARCH55, finding full-length cluster-to-cluster matches, merging the sequence sets and re-aligning the new clusters. The splitting phase comprised the construction of an approximate phylogenetic tree of the sequences using FastTree56 (gamma-distributed site rates and WAG evolutionary model) with balanced mid-point tree rooting, identification of subtrees maximizing the fraction of species (MAGs) representation and minimizing the number of paralogues, and pruning these subtrees as separate clusters of putative orthologues. Clusters, derived from archaeal COGs, were prohibited from merging across distinct archaeal COGs to prevent distant paralogues forming mixed clusters.
Phylogenetic analysis
16S rRNA gene phylogenetic analysis.
16S rRNA gene sequences were identified in 78 genomes of Asgard archaea (30 generated in this Article and 48 from public databases) using Barrnap (v.0.9) with the ‘--kingdom arc’ option (https://github.com/tseemann/barrnap). These sequences were combined with 46 published 16S rRNA gene sequences of Asgard archaea, to assess the novelty of the sequences obtained in this Article. The novelty of 16S rRNA gene sequences was measured in terms of their sequence identity to previously identified Asgard archaeal 16S rRNA gene and phylogenetic relationships. Specifically, the pairwise sequence identity of two Asgard archaeal 16S rRNA gene sequences (>1,300 bp) was obtained by first globally aligning the sequences with Stretcher in the EMBOSS package and then calculating the per cent identity, excluding gaps57. The 16S rRNA gene sequences belonging to Thorarchaeota (n = 28), Odinarchaeota (n = 2), Lokiarchaeota (n = 24), Helarchaeota (n = 2), Hodarchaeota (n = 18), Gerdarchaeota (n = 11), Heimdallarchaeota (n = 14), Kariarchaeota (n = 5), Wukongarchaeota (n = 1), Hermodarchaeota (n = 3) and Baldrarchaeota (n = 1) were aligned with mafft-LINSI (v.7.471)58. A maximum-likelihood tree was then estimated with IQ-Tree (v.2.0.7)59 using the GTR + F + G4 model under the constraint topology shown in Fig. 1a. This tree was used as a guide tree for PRANK (v.170427, -once -termgap) to generate a multiple sequence alignment profile. The alignment was manually inspected and trimmed columns of >90% gaps in Aliview (v.1.26)60. The trimmed sequences were then used for phylogenetic inference with IQ-Tree (v.2.0.7) using the GTR + F + G4 model to generate a maximum likelihood tree with 1,000× ultrafast bootstrap samples.
Asgard phylogeny.
A set of Asgard COGs that were considered most suitable as phylogenetic markers for Asgard archaea was selected using the preliminary classification of the 76 genomes in Asgard COGs into previously described lineages: Lokiarchaeota, Thorarchaeota, Odinarchaeota, Helarchaeota and Heimdallarchaeota. The following criteria were adopted: the Asgard COG had to be (1) present in at least half of the genomes in all lineages, (2) present in at least 75% of the 76 genomes; and (3) the mean number of paralogues per genome had not to exceed 1.25. For the 209 Asgard COGs that matched these criteria, the corresponding protein sequences were obtained from the extended set of 162 MAGs and aligned using MUSCLE54; the ‘index’ paralogue to include in the phylogeny was selected for each MAG on the basis of its similarity to the alignment consensus. Alignments were trimmed to exclude columns containing more than 0.667 gap characters and with homogeneity below 0.05 (homogeneity is calculated from the score of the consensus amino acid against the alignment column, compared to the score of the perfect match61) and concatenated, resulting in an alignment of 50,706 characters from 162 sequences (one sequence per MAG). The phylogeny was reconstructed using FastTree (gamma-distributed site rates and WAG evolutionary model)56 and IQ-Tree (LG + F + R10 model, selected by ModelFinder)59, which produced very similar tree topologies.
Tree of life.
To elucidate the relationships between the Asgard archaea and other major clades of archaea, bacteria and eukaryotes, we selected 30 families of conserved proteins that appear to have evolved mostly vertically19,62. The set of 162 MAGs of Asgard archaea was supplemented with sequences from non-Asgard archaea, bacteria and eukaryotes (Supplementary Table 4). Specifically, all proteins in 12,792 completely sequenced bacterial genomes (available in March 2019) were clustered at 75% identity level, distances between genomes were estimated from the number of shared proteins within these clusters, and unweighted-pair group method with arithmetic mean trees were reconstructed from the estimated distances. Then, a set of 98 representative bacterial genomes was selected so as to maximize the total branch length in the bacterial subtree. The same procedure was used to select 66 of the 92 TACK archaea and 220 of the 424 non-TACK archaea; as the TACK archaea have previously been reported to be the closest archaeal relatives of the Asgard1, we sampled them more densely. The set of eukaryotic genomes was manually selected to represent the maximum possible variety of eukaryotic taxa (as available in June 2020); all protein sequences associated with the corresponding NCBI TaxIDs were downloaded from the NCBI RefSeq database (supplementary data file 2). Genomes from which more than four markers were missing were excluded from the bacterial and eukaryotic sets. When several paralogues of a marker were present in a genome, preliminary phylogenetic trees were constructed from protein sequence alignments, and paralogues with the shortest branches were selected to represent the corresponding genomes in the set. Sequences were aligned using MUSCLE54, and alignment columns that contained more than 0.667 gap characters or with alignment column homogeneity below 0.05 were removed61. The resulting concatenated alignments of the 30 markers consisted of 7,411 sites. The phylogeny was reconstructed using FastTree (gamma-distributed site rates and WAG evolutionary model)56 and IQ-Tree59 with three models: LG + R10, selected by IQ-tree ModelFinder as the best fit, GTR20 + F + R10 (following a previously published suggestion5 to use GTR, we let IQ-tree to select the best version of the GTR model), and LG + C20 + G4 + F (a mixture model was used following a previously published suggestion5; we were unable to use the higher-specified C60 model owing to memory limitations of our hardware and used the C20 model instead). Random subsampling of the markers was performed by making a bootstrap sample of marker identifiers and using the list of unique names; under this scheme each marker is selected randomly and independently with the probability of 1 − e−1.
Ordination of Asgard COG phyletic patterns using classical multidimensional scaling
Binary presence–absence patterns of Asgard COGs were compared between pairs of Asgard MAGs using the following procedure. First, we calculated the similarity between the sets of Asgard COGs and using (that is, the number of shared Asgard COGs, normalized by the geometric mean of the number of Asgard COGs in the two MAGs). Then, we calculated the distance between the patterns using . We embedded the 162 × 162 distance matrix into a 2D space using classical multidimensional scaling analysis, implemented as the cmdscale function in R63. The projection retained 89% of the original datapoint inertia.
Identification and analysis of ESPs
We used several strategies to identify ESPs. First, we mapped previously reported ESPs2 to Asgard COGs using PSI-BLAST52. We also examined these Asgard COGs case-by-case using HHpred64, with a representative of the respective Asgard COG or the respective Asgard COG alignment used as the query. Second, all Asgard COGs were mapped to CDD profiles65 using PSI-BLAST, and hits to eukaryote-specific domains were selected. Most of the Asgard COGs corresponding to putative ESPs identified in this search (and all of the Asgard COGs with E-value > 1 × 10⁻¹⁰) were additionally examined using HHpred, with a representative of the respective Asgard COG or the respective Asgard COG alignment as the query. Third, we analysed frequently occurring Asgard COGs (present in at least 50% of Asgard genomes and in at least 30% of Heimdallarchaeota genomes) that were not annotated automatically with the above two approaches using HHpred, using a representative of the respective Asgard COG or the respective Asgard COG alignment as the query. Fourth, most of the Asgard COGs for putative ESPs detected with these approaches were used as queries for a PSI-BLAST search that was run for three iterations (with an E-value = 0.0001 as a threshold for inclusion) against an Asgard-only protein sequence database. Additional unannotated Asgard COGs with similarity to the (putative) ESPs identified in this search were further examined using HHpred. Fifth, the genomic neighbourhoods or all ESPs were examined, and proteins encoded by unannotated neighbour genes were analysed using HHpred server.
Metabolic pathway reconstruction
We used the Asgard COGs to reconstruct the metabolic pathways of Asgard archaea (Supplementary Table 8). The Asgard COG numbers were referred to the Kyoto Encyclopedia of Genes and Genomes database and a previously published list of identified metabolic enzymes35, with the respective associated Asgard COG and archaeal COG numbers (Supplementary Table 8). The classification of [NiFe] hydrogenases was first done by sending the orthologous genes of cog.001539, cog.002254, cog.010021, cog.011939 and cog.012499 of Asgard archaea to HydDB66. For phylogenetic analysis, the reference sequences of group-1, −3 and −4 [NiFe] hydrogenases were retrieved from HydDB. The sequences were filtered using cd-hit with a sequence identity cut off of 90% before adding orthologous genes of cog.001539, cog.002254, cog.010021, cog.011939 and cog.012499 of Asgard archaea. All sequences for group -, group-3 and group-4 [NiFe] hydrogenases were aligned using mafft-LINSI58 and trimmed with BMGE (-m BLOSUM 30 -h 0.6)67. Maximum-likelihood phylogenetic analyses were performed using IQ-tree59 with the best-fit model (group 1, LG + C60 + R + F; group-3, LG + C60 + R + F; and group 4, LG + C50 + R + F) according to a Bayesian information criterion. Support values were estimated using the Shimodaira–Hasegawa-like approximate-likelihood ratio test and ultrafast bootstraps. We adapted a relaxed common denominator approach to determine the presence of a particular pathway in one Asgard phylum35, and combined with maximum parsimony principle68 to infer the metabolisms of major ancestral forms.
Reporting summary
Further information on research design is available in the Nature Research Reporting Summary linked to this paper.
Extended Data
Extended Data Fig. 1 |. Global distribution of the Asgard genomes analysed in this Article.

The world map was generated using R package rnaturalearth v.0.1.0., in R v.3.6.363. The pie chart shows the proportion of Asgard genomes that were found in a given biotope. The numbers of these genomes per biotope are as follows: coastal sediment, 94; freshwater sediment, 15; hot spring, 1; hydrothermal vent, 13; hypersaline lake sediment, 1; marine sediment 26; marine water, 26; petroleum seep (marine), 6; and petroleum field, 1. Boldface in the map indicates the sampling locations.
Extended Data Fig. 2 |. Completeness and contamination for 75 Asgard MAGs.
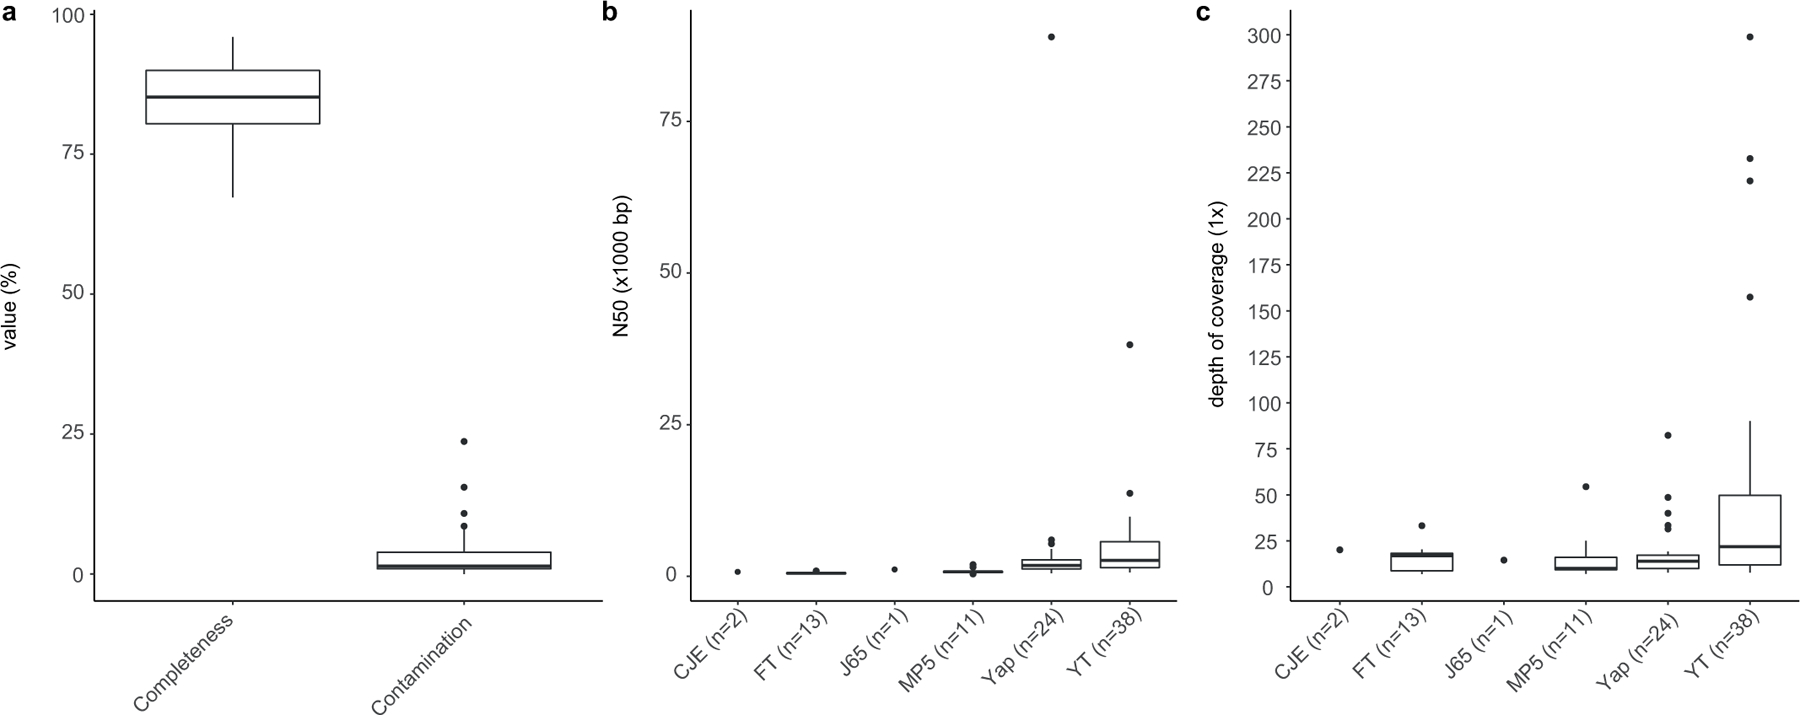
These MAGs were assessed using CheckM v.1.0.12. a, Distribution of completeness and contamination for 75 Asgard MAGs assessed by CheckM v.1.0.12. b, c, Distribution of depth coverage (b) and N50 statistics (c) for Asgard MAGs reconstructed in this Article. The numbers in parentheses indicate the number of Asgard genomes recovered from a given sampling location. In cases in which fewer than three samples were recovered, these are presented as individual points. Thick black bar, median; upper and lower bounds of the box plot, first and third quartile, respectively; upper and lower whiskers, largest and smallest values less than 1.5× interquartile range, respectively; black points, values greater than 1.5× interquartile range. Data for this plot are given in Supplementary Table 1.
Extended Data Fig. 3 |. Gene commonality plot for Asgard archaea and the TACK superphylum.
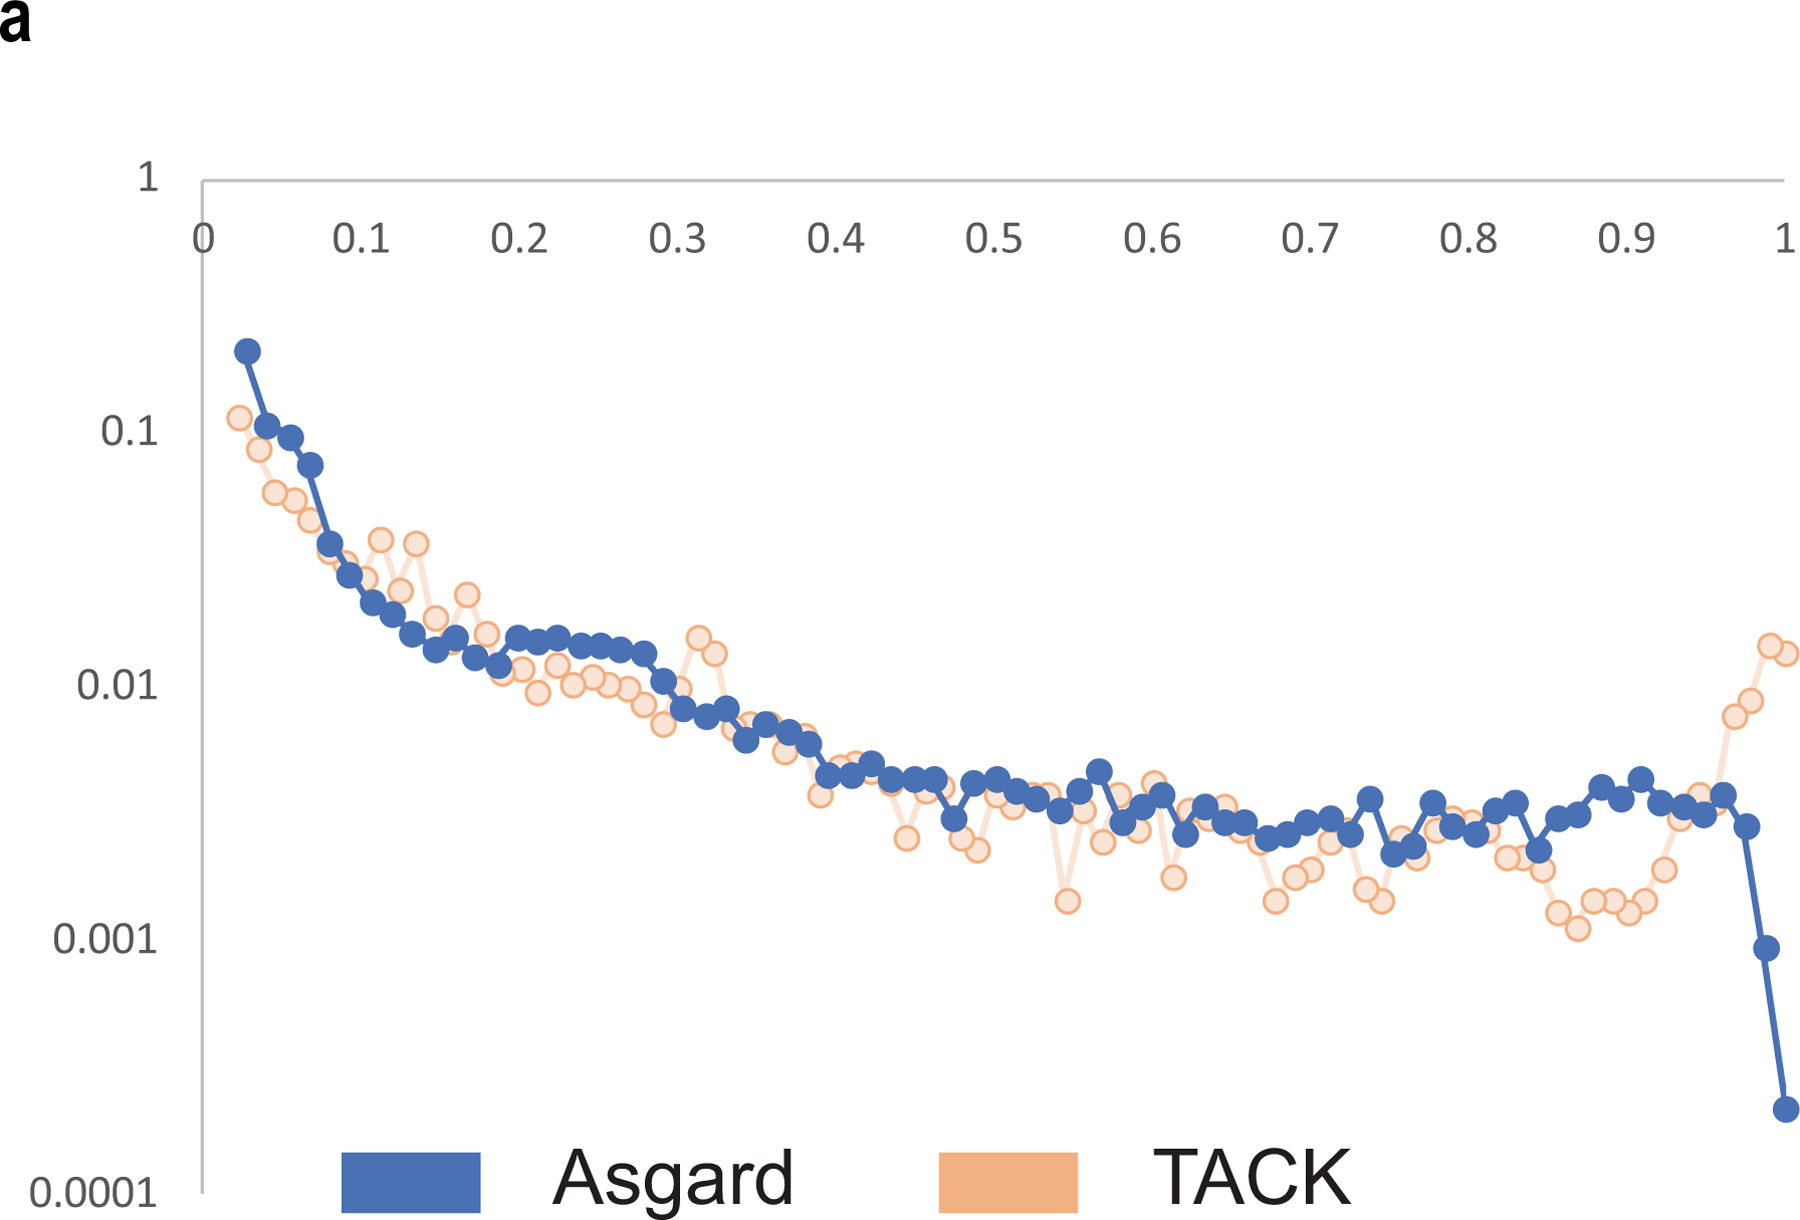
Gene commonality plot showing the number of Asgard COGs (log scale) (y axis) that include the given fraction of analysed genomes (x axis). The Asgard plot is compared with the TACK superphylum plot on the basis of the assignment of TACK geznomes to archaeal COGs.
Extended Data Fig. 4 |. Comparison of the mean amino acid identity of Asgard and TACK superphyla.
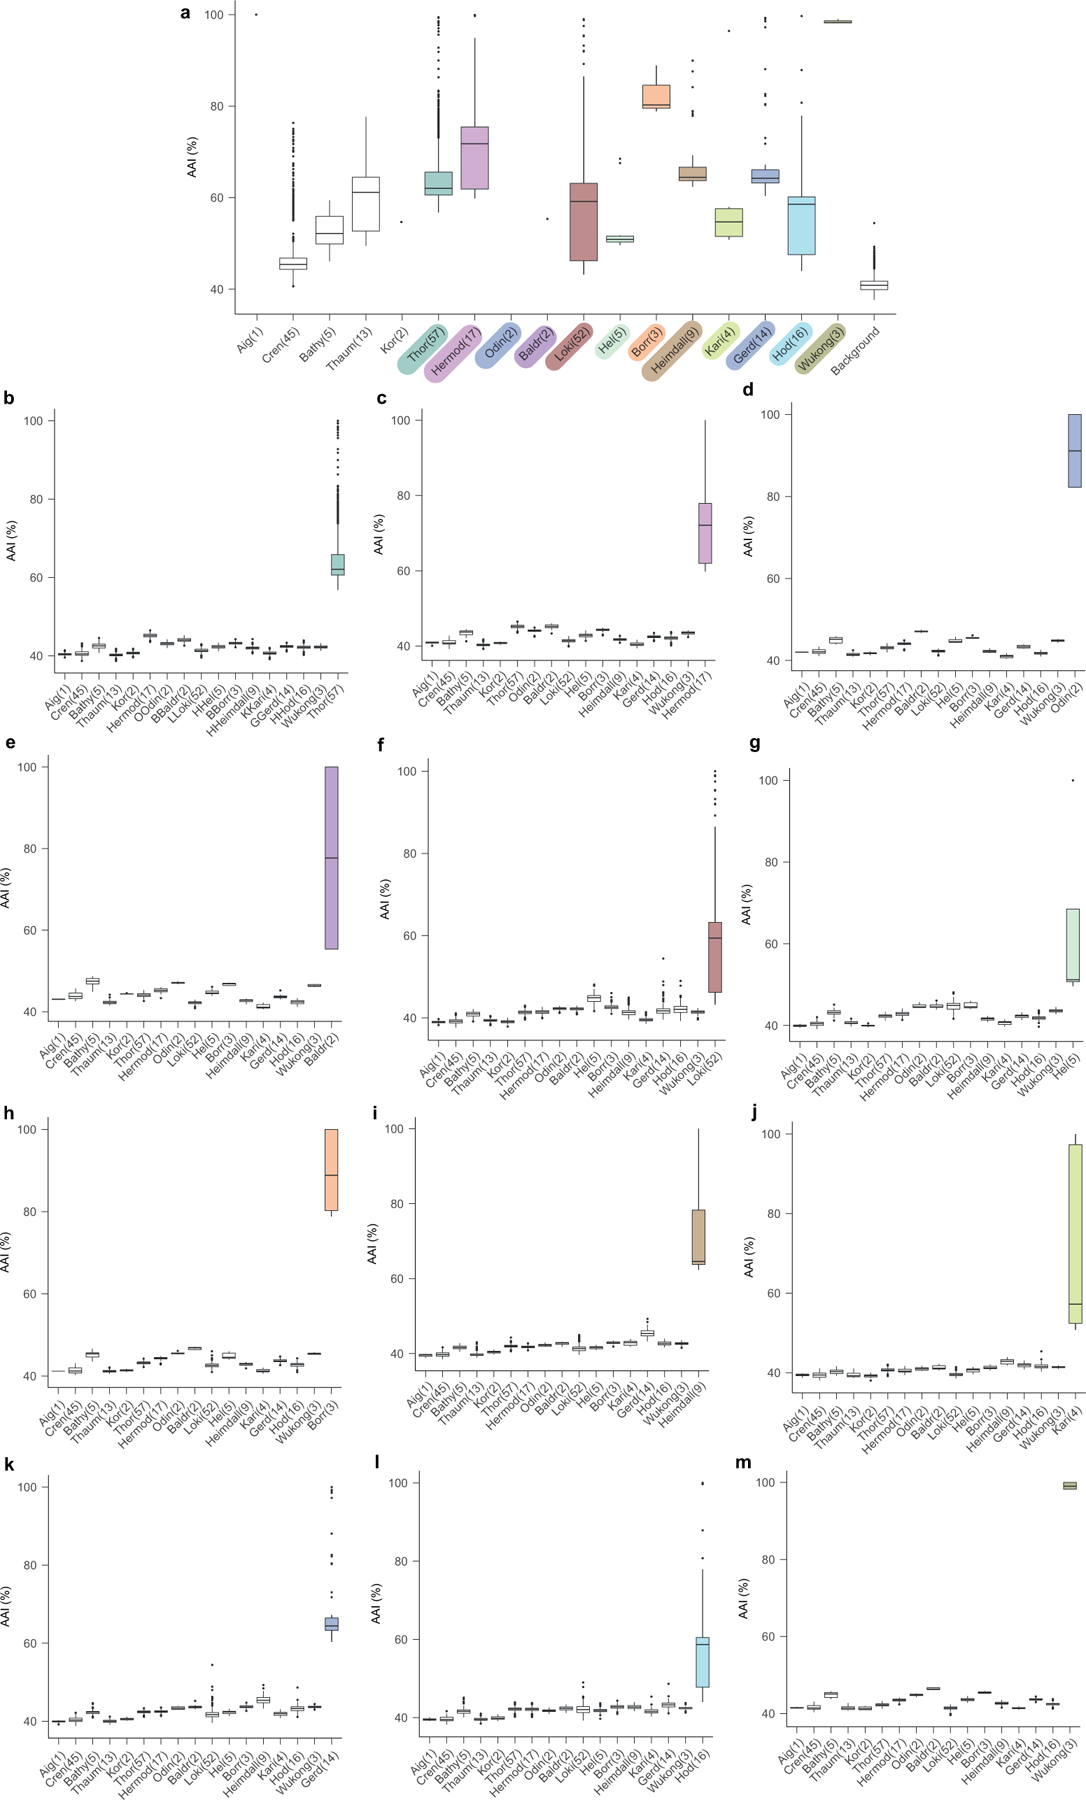
In this figure, -archaeota is omitted from the phylum names. Sample sizes of less than three are presented as individual points. a, Shared amino acid identity across Asgard and TACK lineages. Comparison of representative genomes from all Asgard and TACK lineages analysed in this Article (excluding the six putative phyla proposed in this Article), which characterizes the distribution of amino acid identities that is typical of a phylum. b–m, Amino acid identity comparisons between Thorarchaeota (b), Hermodarchaeota (c), Odinarchaeota (d), Baldrarchaeota (e), Lokiarchaeota (f), Helarchaeota (g), Borrarchaeota (h), Heimdallarchaeota (i), Kariarchaeota ( j), Gerdarchaeota (k), Hodarchaeota (l) and Wukongarchaeota (m) and other Asgard and TACK lineages. Thick black bar, median; upper and lower bounds of the box plot, first and third quartile respectively; upper and lower whiskers, largest and smallest values less than 1.5× interquartile range, respectively; black points, values greater than 1.5× interquartile range; number in the parentheses, number of genomes in the lineage. Data for this plot are given in Supplementary Table 2.
Extended Data Fig. 5 |. Comparison of the 16S rRNA gene sequence identity of Asgard and TACK lineages.
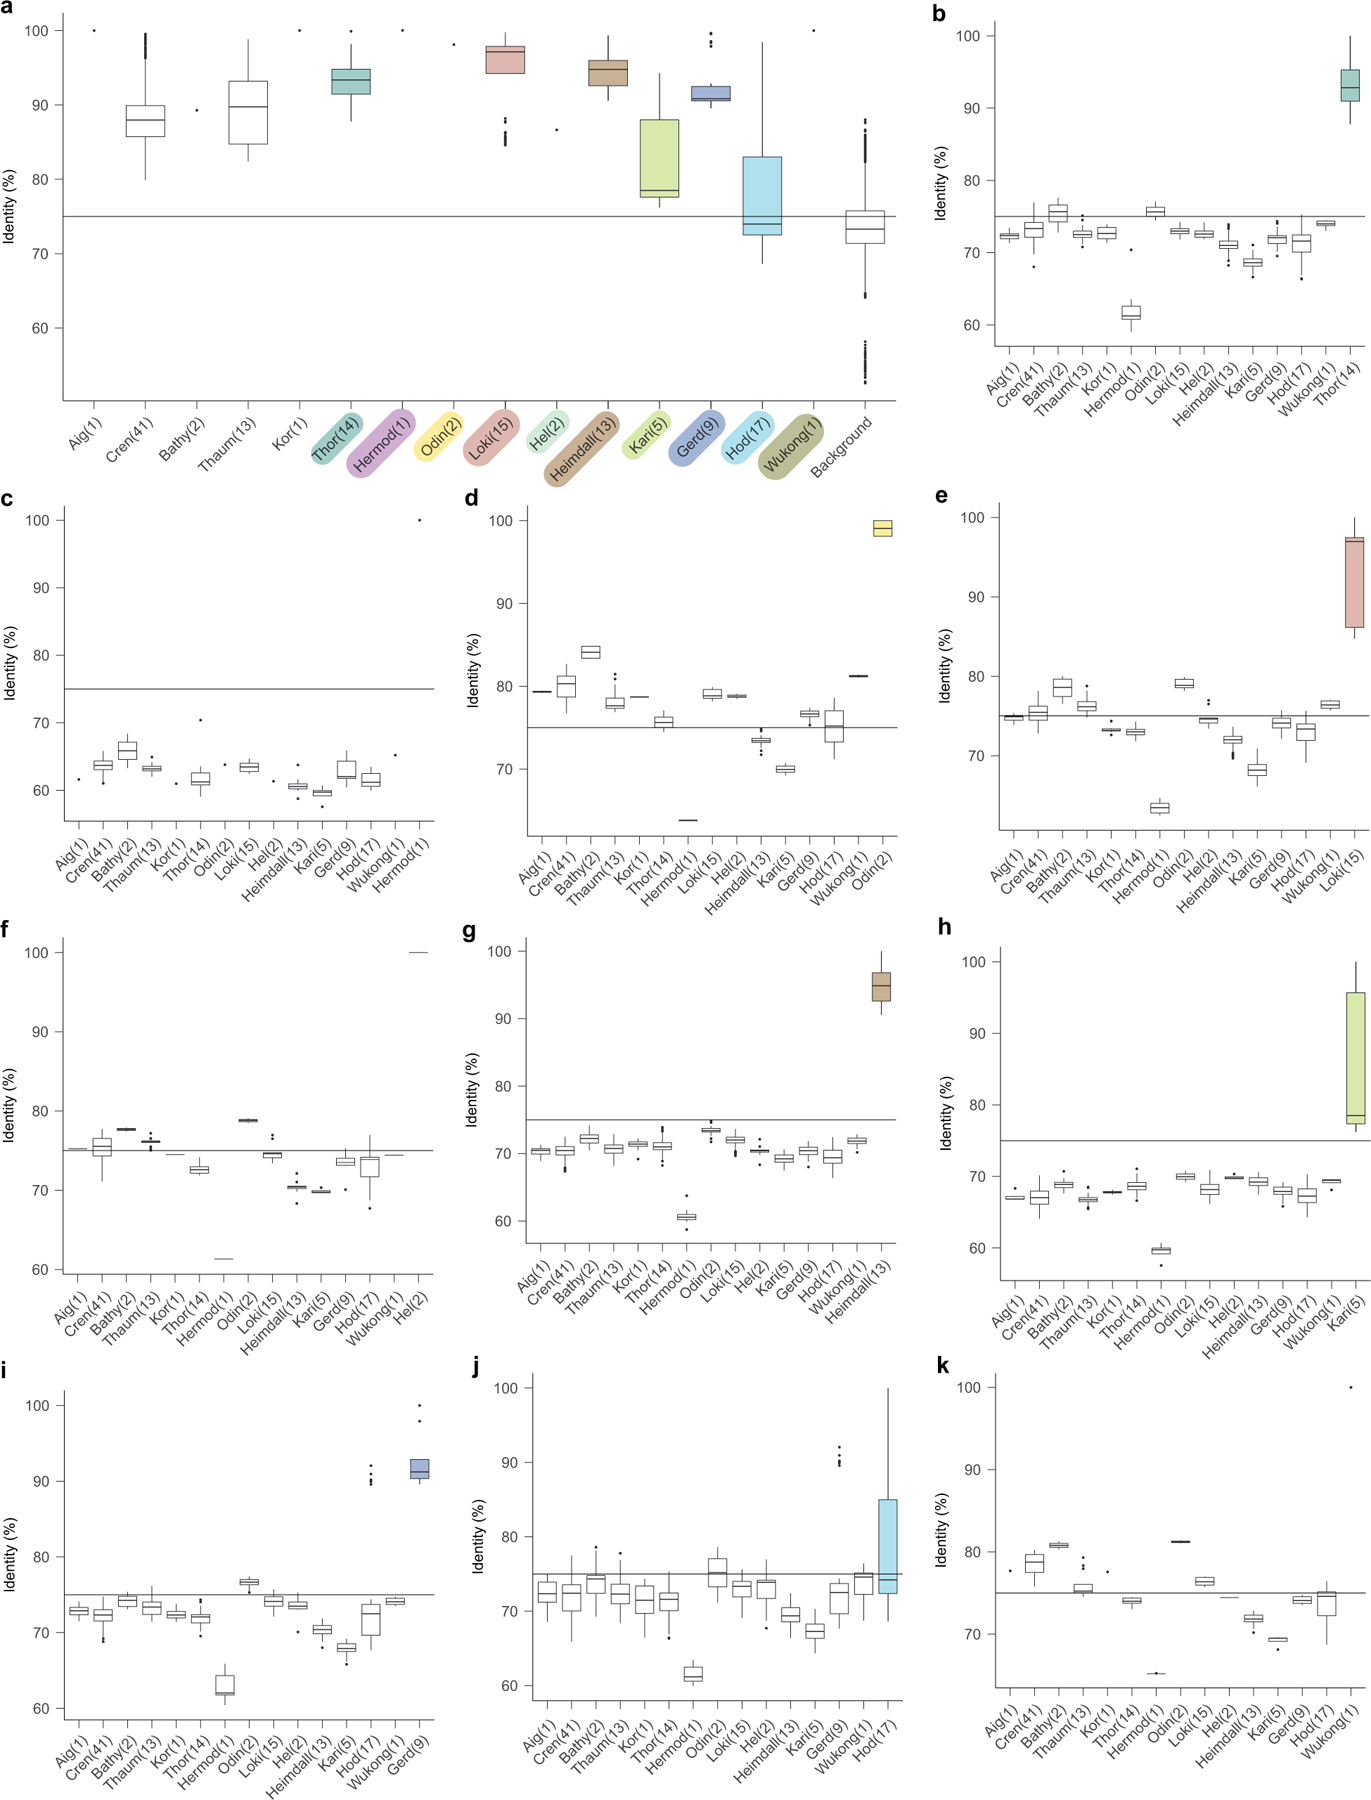
In this figure, -archaeota is omitted from the phylum names. Sample sizes of less than three are presented as individual points. a, 16S rRNA gene sequence identity across Asgard and TACK lineages. Comparison of 16S RNA gene sequences from representative genomes of all Asgard and TACK lineages analysed in this Article (excluding the six putative phyla proposed in this Article), which characterizes the distribution of 16S rRNA sequence that is typical of a phylum. b–k, Comparison of 16S rRNA gene sequence identity between Thorarchaeota (b), Hermodarchaeota (c), Odinarchaeota (d), Lokiarchaeota (e), Helarchaeota (f), Heimdallarchaeota (g), Kariarchaeota (h), Gerdarchaeota (i), Hodarchaeota (j) and Wukongarchaeota (k) and other Asgard and TACK lineages. Thick black bar, median; upper and lower bounds of the box plot, first and third quartile respectively; upper and lower whiskers, largest and smallest values less than 1.5× interquartile range, respectively; black points, values greater than 1.5× interquartile range; number in the parentheses, number of genomes in the lineage. Data for this plot are given in Supplementary Table 3.
Extended Data Fig. 6 |. Classification of Asgard archaea by the phyletic patterns and the core gene set of Asgard archaea.
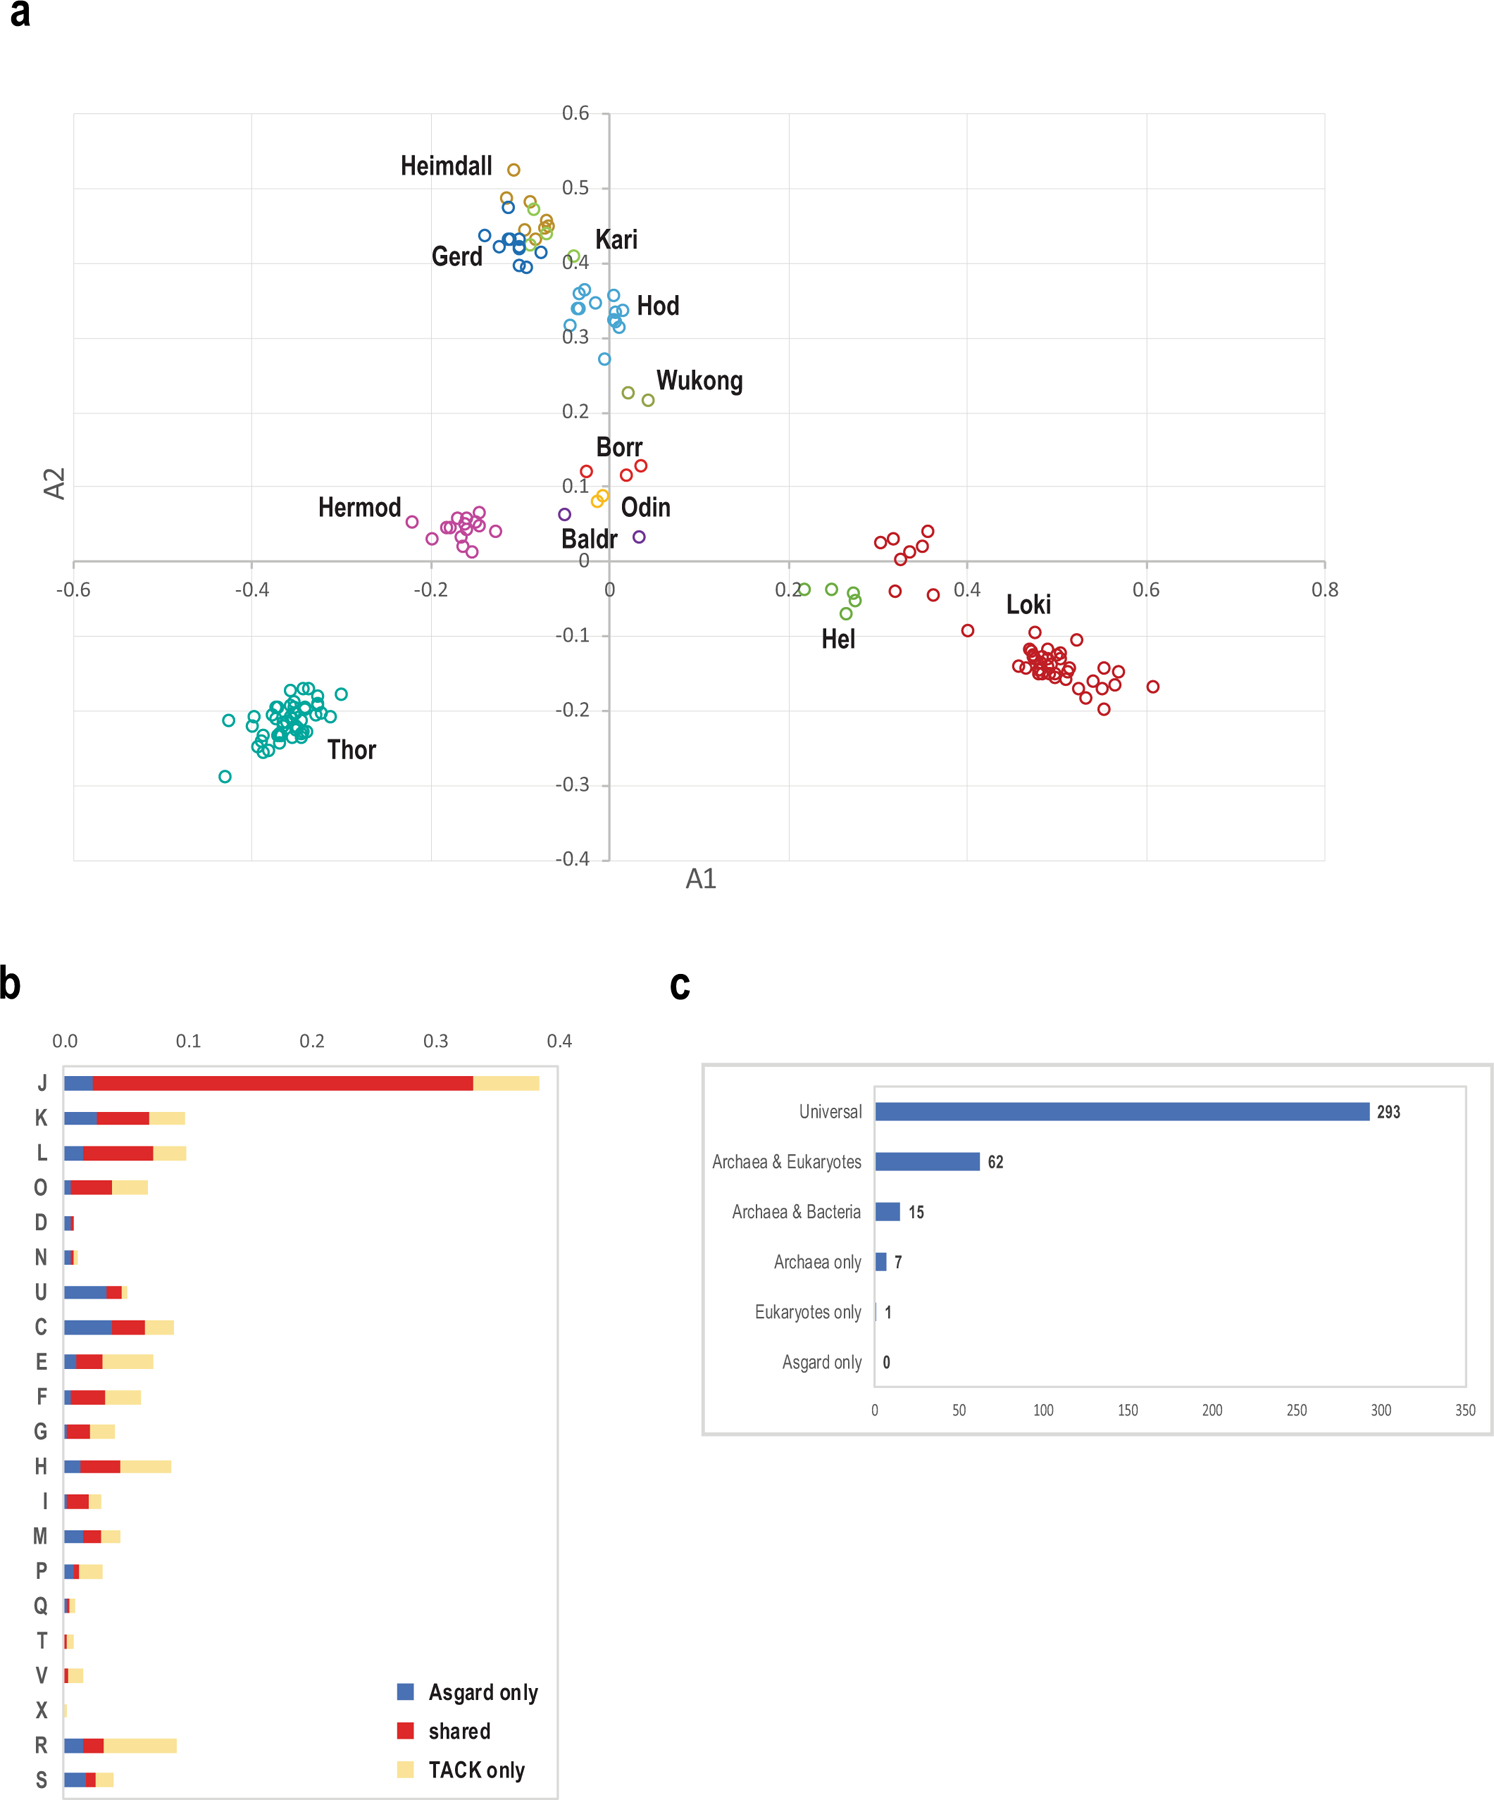
a, Classical multidimensional scaling analysis of binary presence–absence phyletic patterns for 13,939 Asgard COGs that are represented in at least two genomes (Methods). b, Functional breakdown of Asgard core genes (378 Asgard COGs) compared with TACK-superphylum core genes (489 archaeal COGs). Values were normalized as described in the Methods. Functional classes of genes: J, translation, ribosomal structure and biogenesis; K, transcription; L, replication, recombination and repair; D, cell cycle control, cell division and chromosome partitioning; V, defence mechanisms; T, signal transduction mechanisms; M, biogenesis of the cell wall, membrane or envelope; N, cell motility; U, intracellular trafficking, secretion and vesicular transport; O, posttranslational modification, protein turnover and chaperones; X, mobilome (prophages, plasmids and transposons); C, energy production and conversion; G, carbohydrate transport and metabolism; E, amino acid transport and metabolism; F, nucleotide transport and metabolism; H, coenzyme transport and metabolism; I, lipid transport and metabolism; P, inorganic ion transport and metabolism; Q, secondary metabolites biosynthesis, transport and catabolism; R, general function prediction only; S, function unknown. c, Presence–absence of orthologues of Asgard core genes in other archaea, bacteria and eukaryotes.
Extended Data Fig. 7 |. Phylogenetic trees.
a, Phylogenetic tree of bacteria, archaea and eukaryotes (inferred with IQ-tree using the LG + R10 model) that was constructed from the concatenated alignments of the protein sequences of 30 universally conserved genes (Methods). The tree shows the relationships between the major clades. b, Phylogenetic tree of COG0012 (ribosome-binding ATPase YchF) the tree was reconstructed using IQ-tree with LG + R10 evolutionary model (selected by IQ-tree ModelFinder as the best fit). zc, Phylogenetic tree of COG0201 (preprotein translocase subunit SecY). The tree was reconstructed using IQ-tree with LG + F + R10 evolutionary model (selected by IQ-tree ModelFinder as the best fit). d, Phylogenetic tree of the reduced set of bacteria, archaea and eukaryotes (excluding the genomes of derived parasites), constructed from concatenated alignments of the protein sequences of 29 universal markers (excluding COG0012) using IQ-tree with LG + R10 evolutionary model (selected by IQ-tree ModelFinder as the best fit). The tree shows the relationships between the major clades. e, Phylogenetic analysis of the evolutionary relationship between archaea and eukaryotes, excluding the Asgard superphylum. The tree was reconstructed from a concatenated alignment of the 29 universal markers (excluding COG0012) using IQ-tree with LG + R10 evolutionary model (selected by IQ-tree ModelFinder as the best fit).
Extended Data Fig. 8 |. Phyletic patterns of ESPs in Asgard genomes.
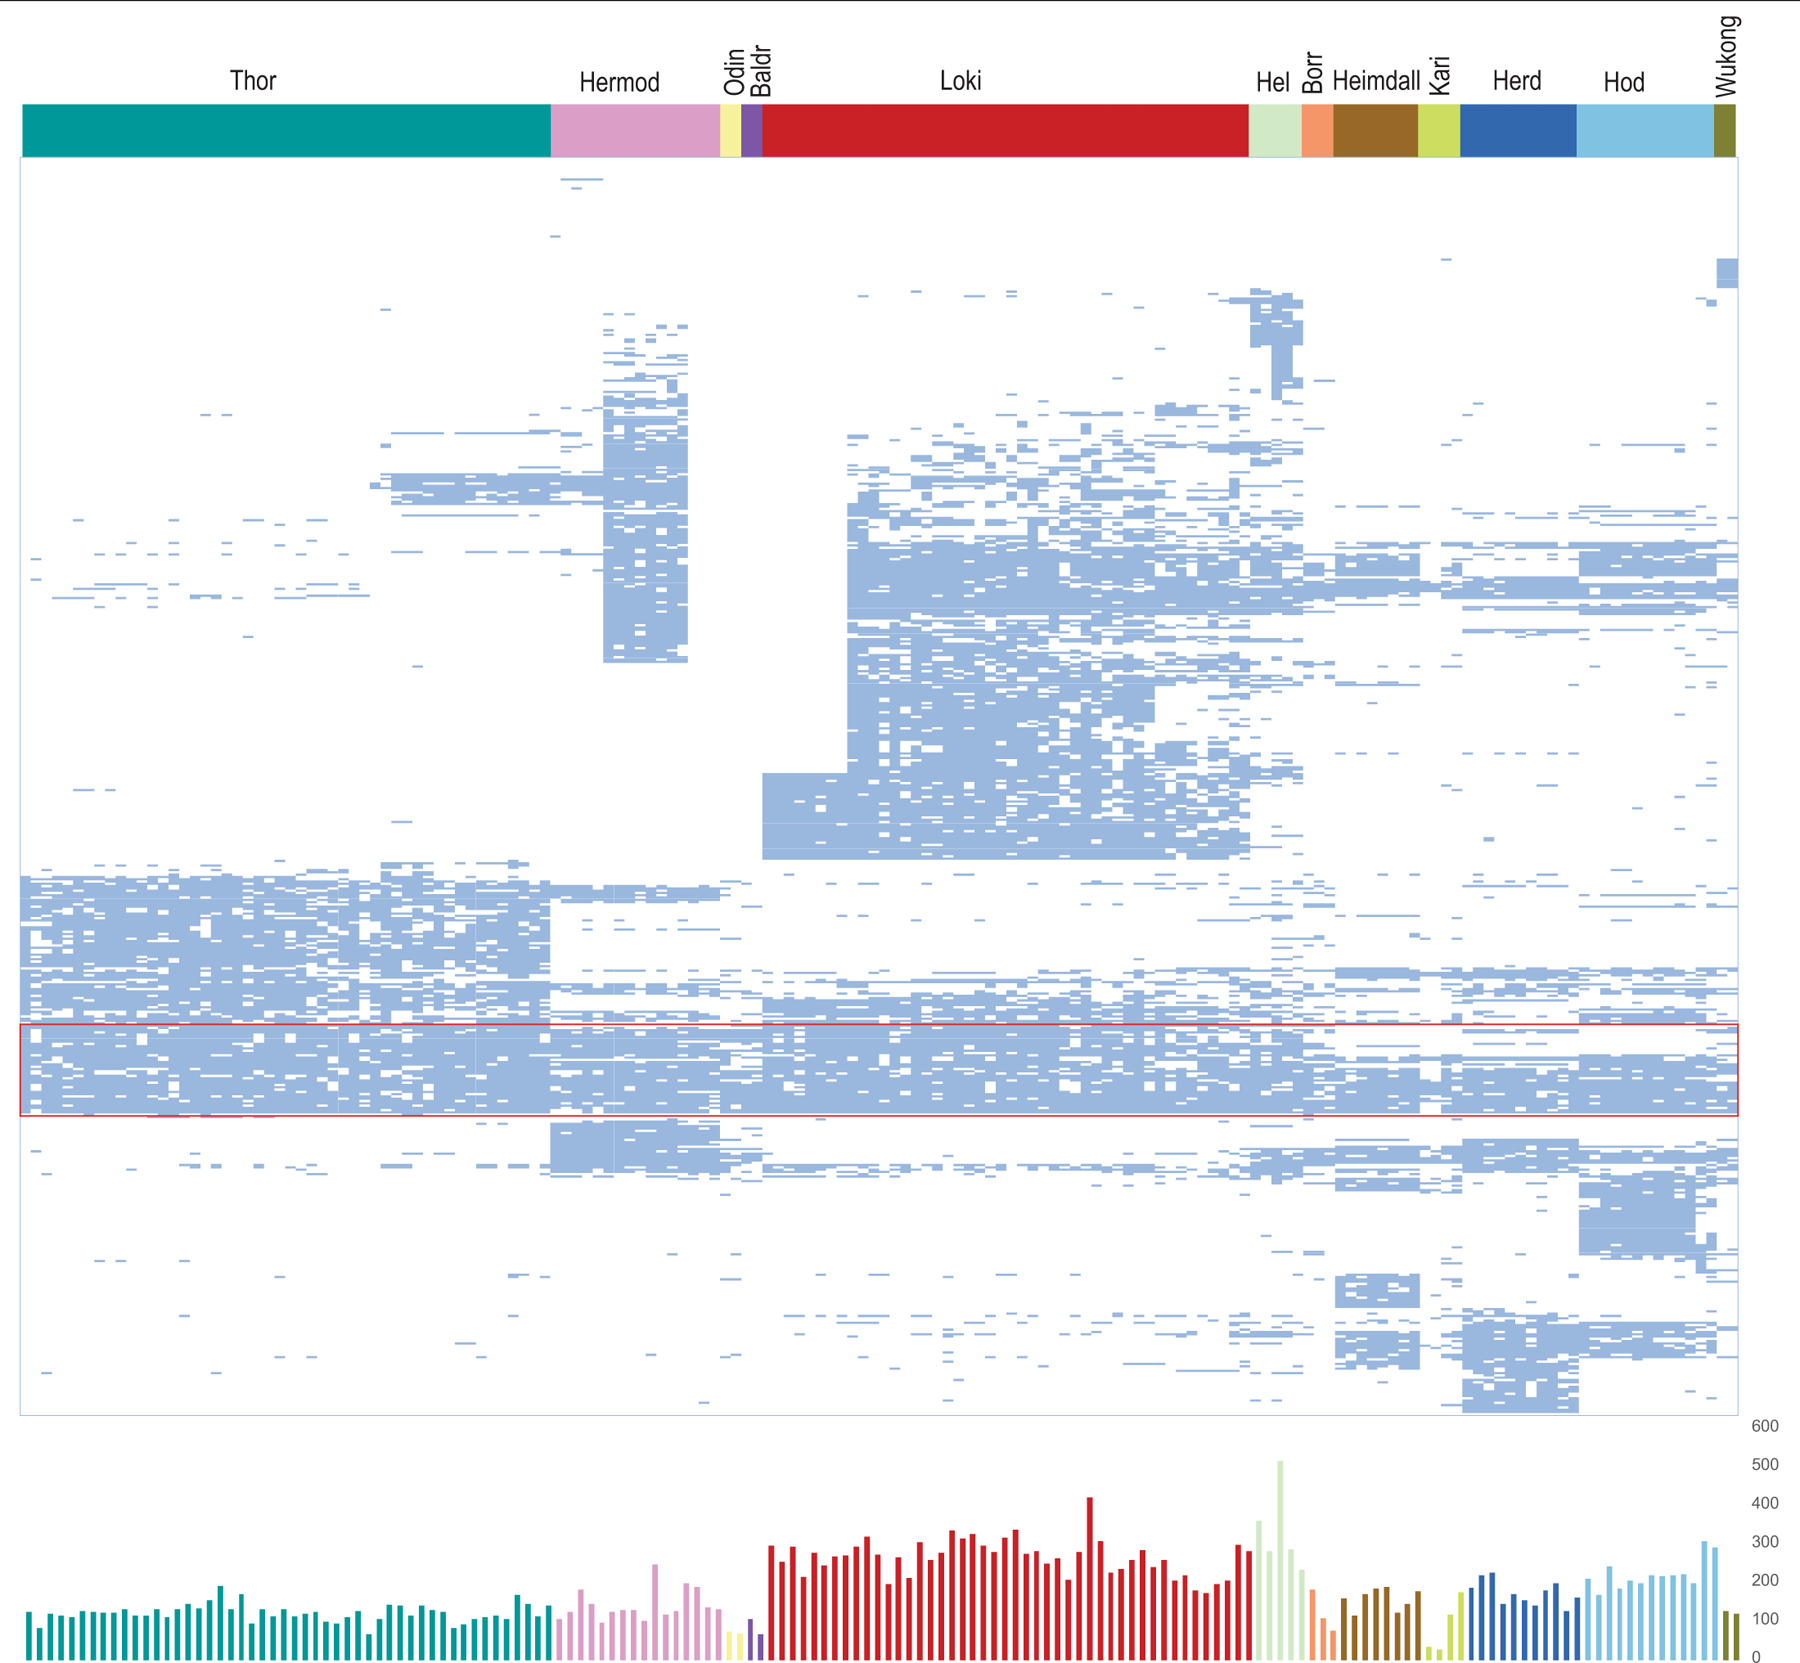
All 505 Asgard COGs that correspond to ESP are grouped by distance between binary presence–absence phyletic patterns. For a given pair of Asgard COGs A and B that are present in the set of genomes {GA} and {GB}, respectively, we calculate the similarity between the patterns as SA,B = |{GA} × {GB}|/|{GA}+{GB}|, and the distance between the patterns as DA,B = −ln(SA,B). A dendrogram was reconstructed using the unweighted-pair group method with arithmetic mean, from the distance matrix D; the order of leaves in the tree determines the order of Asgard COGs in the figure. Top, patterns are shown schematically by pale blue lines, in which the respective Asgard COG is present and mapped to the 12 major Asgard lineages (as shown by the coloured bar above). The Asgard COGs that correspond to the most highly conserved ESP protein families are shown within the red rectangle. Bottom, plot of the number of Asgard COGs that correspond to ESPs in each of 76 genomes is shown. Complete data are provided in Supplementary Table 7. The colour code for the plot is the same as for the bar graph.
Extended Data Fig. 9 |. Metabolic features of Asgard archaea.
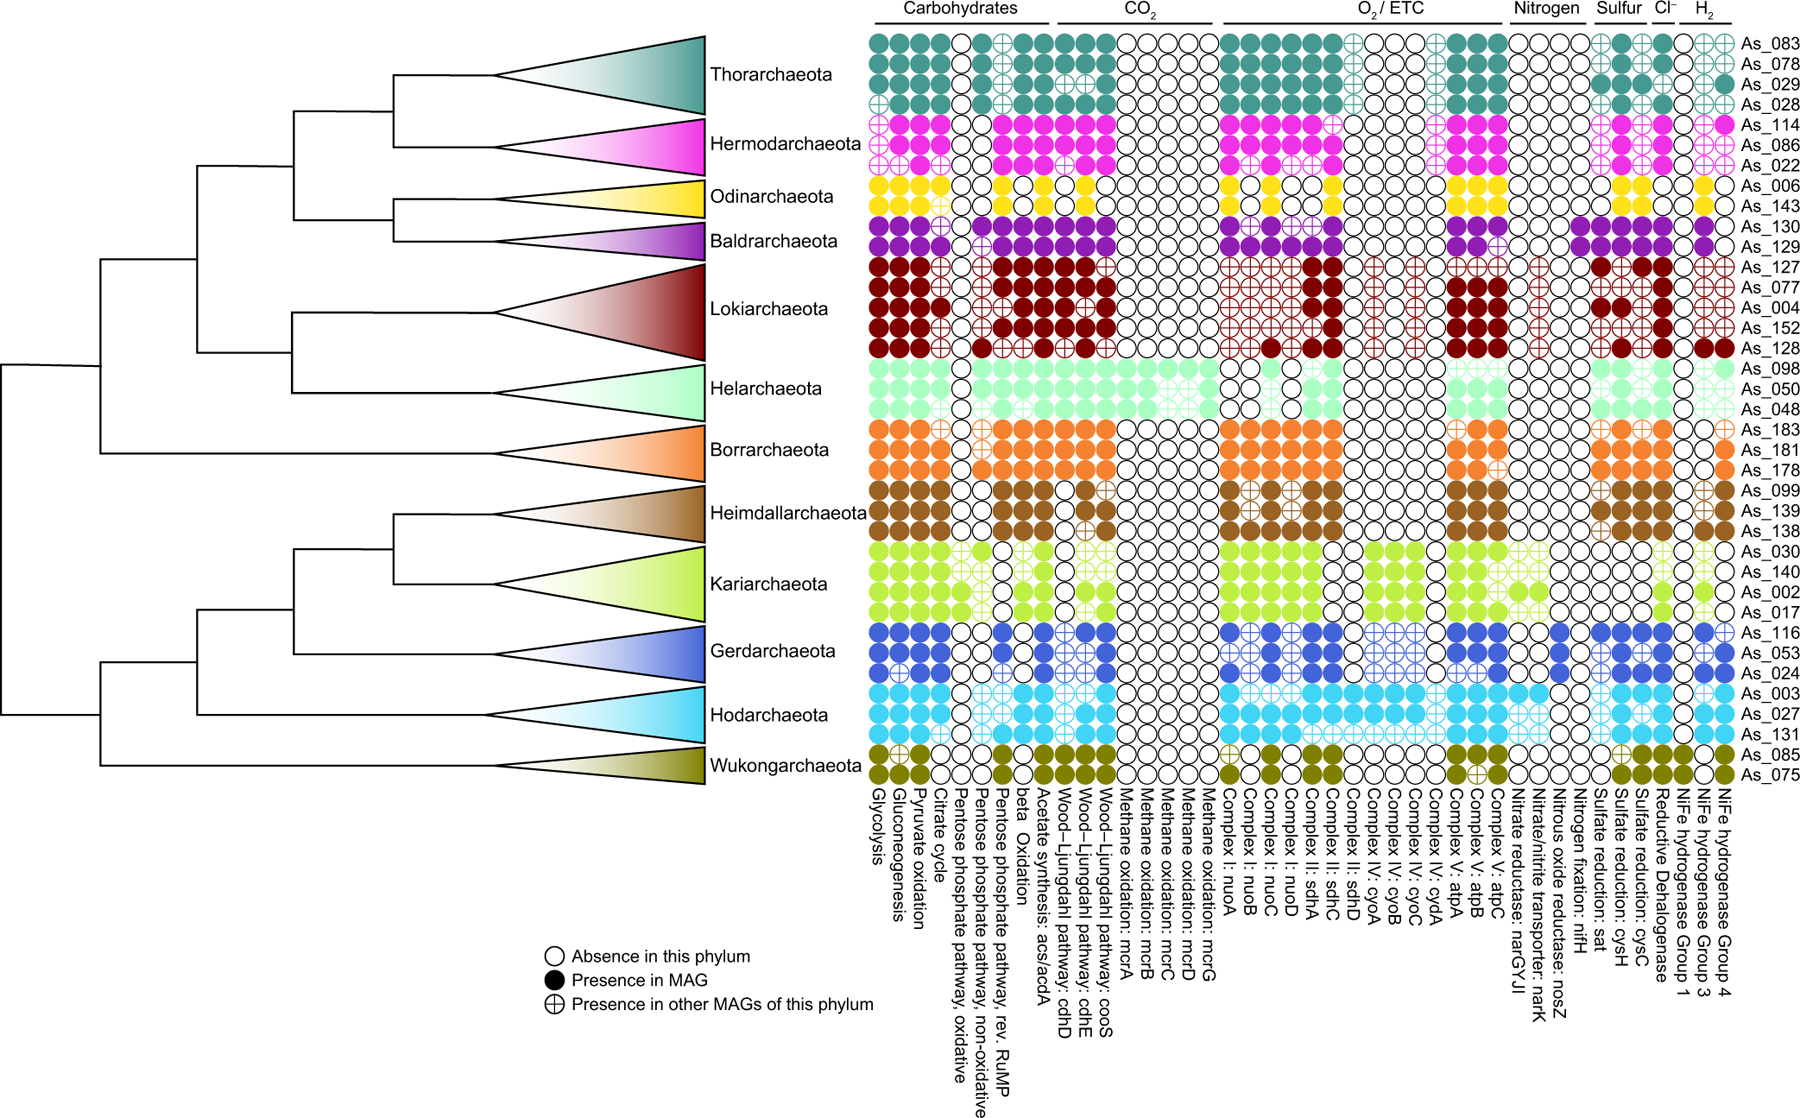
Schematic of the presence and absence of selected metabolic features in all phyla and putative phyla of Asgard archaea.
Extended Data Fig. 10 |. Phylogenetic analysis of [NiFe] hydrogenases in Asgard archaea.
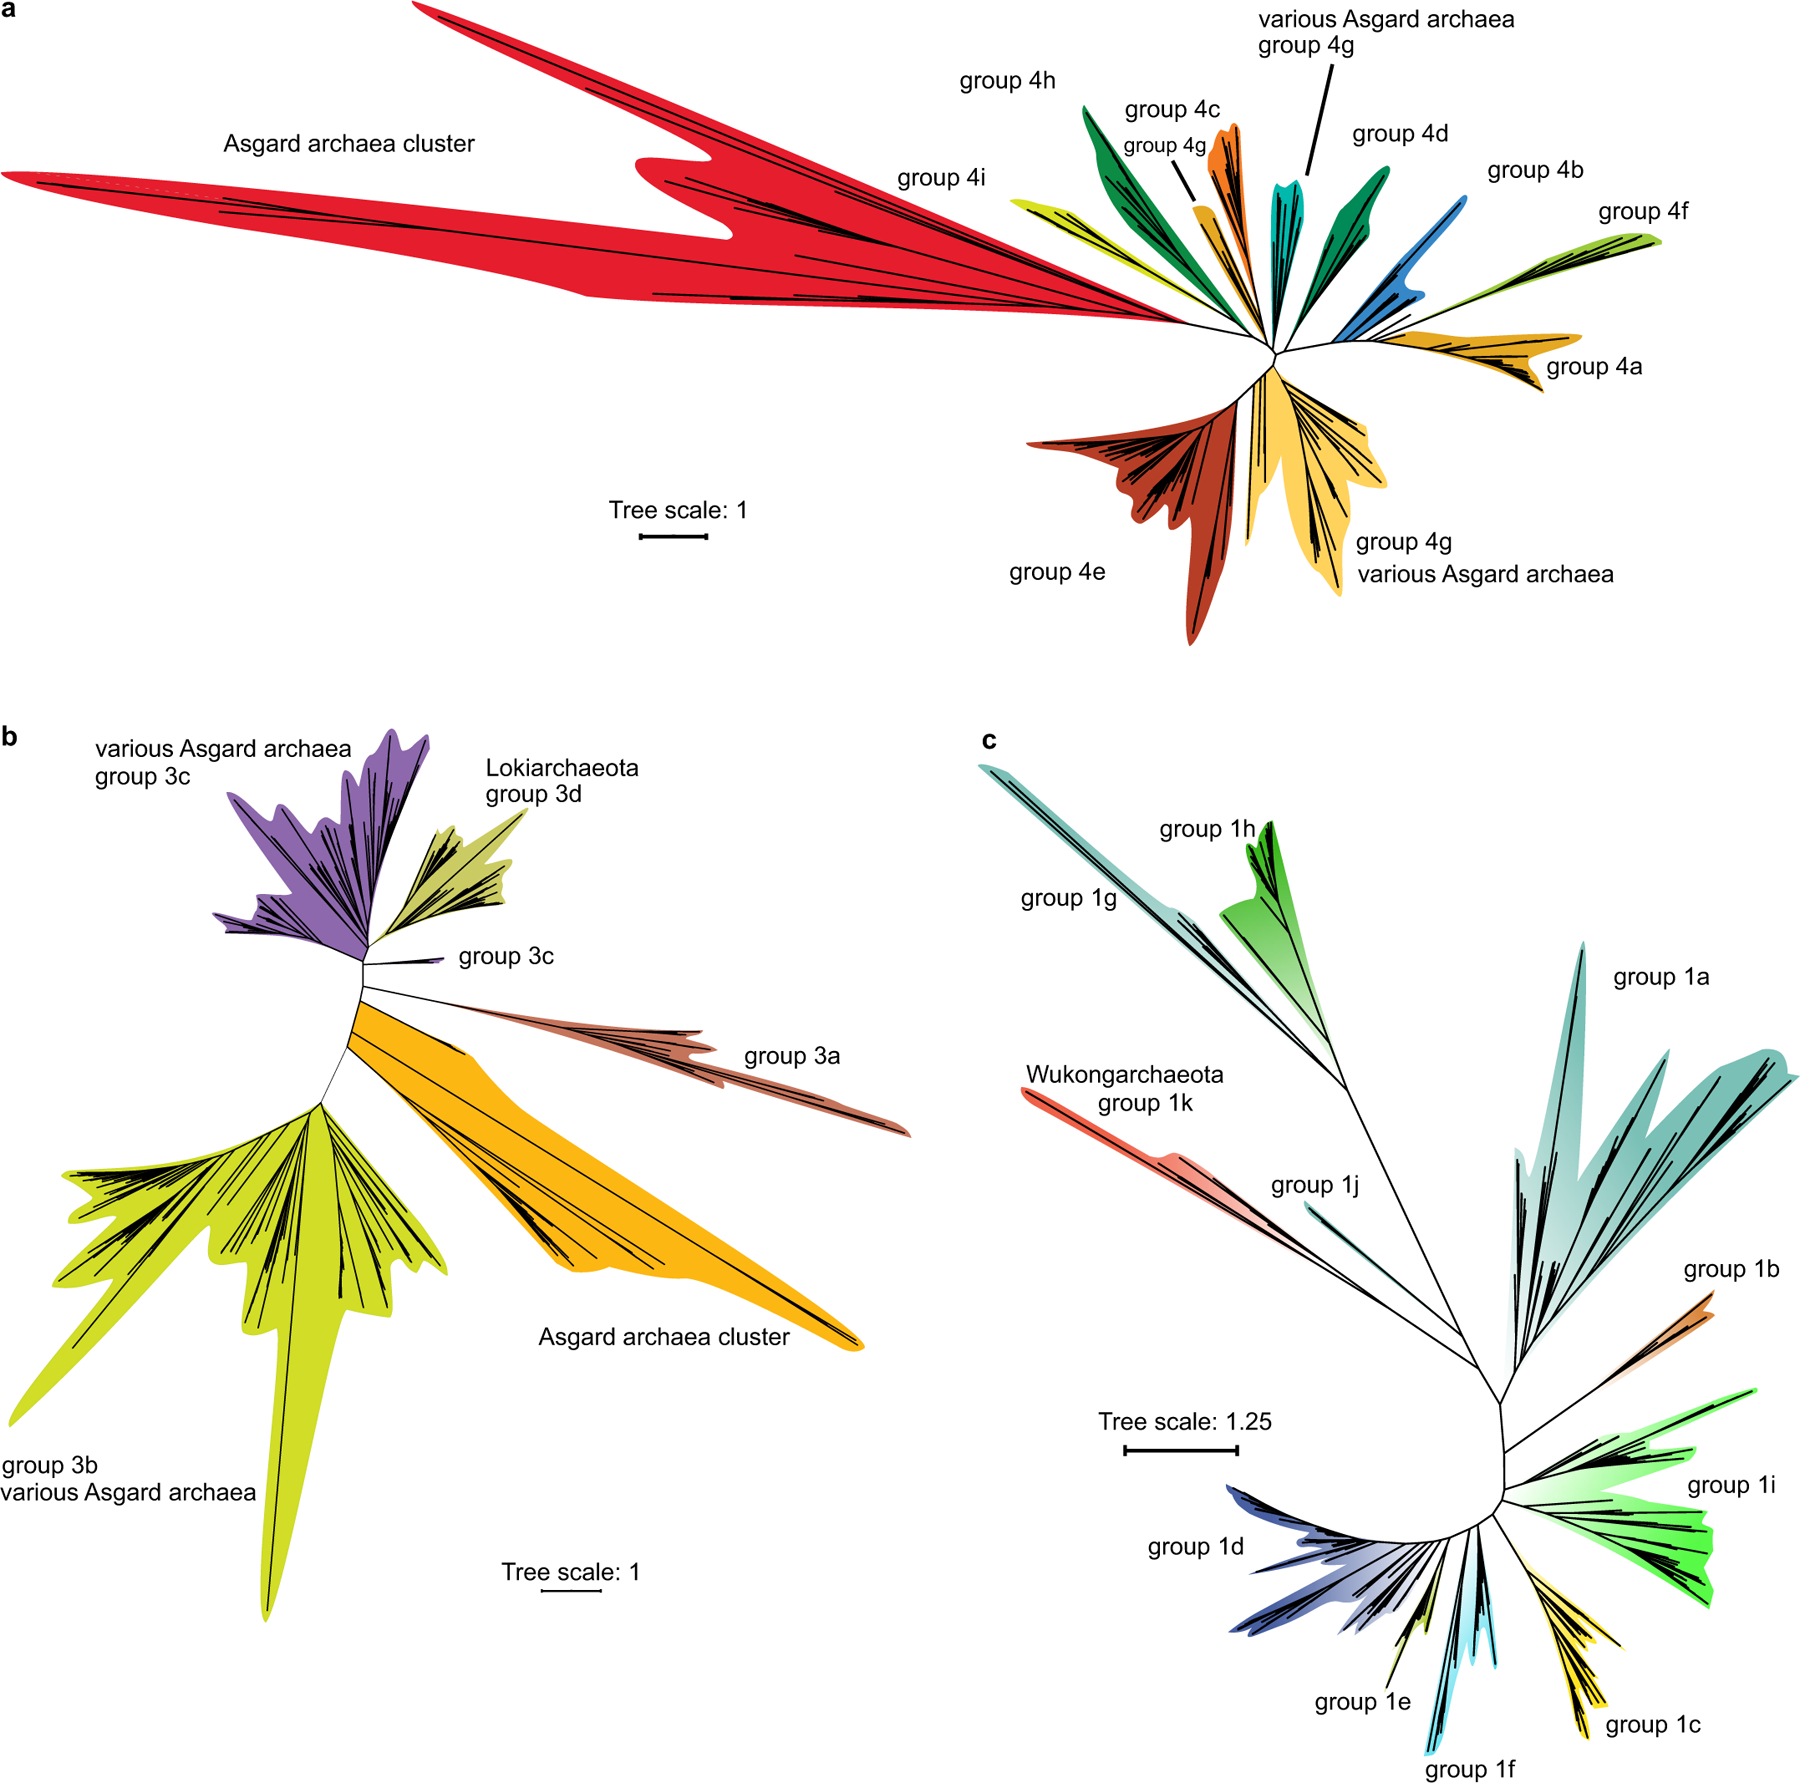
a, Phylogenetic analysis of group-4 [NiFe] hydrogenases in Asgard archaea. The unrooted maximum-likelihood phylogenetic tree was built from an alignment of 425 sequences that included 110 sequences of Asgard archaea, with 308 amino acid positions. b, Phylogenetic analysis of group-3 [NiFe] hydrogenases in Asgard archaea. The unrooted maximum-likelihood phylogenetic tree was built from an alignment of 813 sequences that included 335 sequences of Asgard archaea, with 331 amino acid positions. c, Phylogenetic analysis of group-1 [NiFe] hydrogenases in the Asgard archaea. The unrooted maximum-likelihood phylogenetic tree was built from an alignment of 541 sequences that included 2 sequences of Wukongarchaeota, with 376 amino acid positions.
Supplementary Material
Acknowledgements
We thank P. Forterre and T. Williams for critical reading of the manuscript and helpful suggestions; J. Chen, H. Li, P. Du and D. Zou for support with sampling and preliminary analysis of Changjiang estuary sediments; Z. Zhou and J.-D. Gu for support with sampling and preliminary analysis of Mai Po Nature Reserve sediments; S. Zheng and F. Liu for support with sampling and preliminary analysis of Rongcheng Swan Lake Nature Reserve sediments; and the crew and scientific team of RV Xiangyanghong 09, the pilots and the supporting team of Jiaolong manned submersible in the 37th Dayang Cruise for the sampling. M.L., Y.L., X.Z., W.X., Z.L. and L.C. are supported by National Natural Science Foundation of China (grant no. 91851105, 31970105, 92051102, 31700430, 91951102, 41776170 and 92051108), the Innovation Team Project of Universities in Guangdong Province (no. 2020KCXTD023), the Shenzhen Science and Technology Program (grant no. JCYJ20200109105010363 and JCYJ20190808152403587), the Scientific Research Foundation of Third Institute of Oceanography, MNR (2019022), the China Ocean Mineral Resources R&D Association (COMRA) Program (DY135-B2-09) and the National Key Basic Research Program of China (‘973’-Program, 2015CB755903). K.S.M., Y.I.W., A.N. and E.V.K. are supported by the Intramural Research Program of the National Institutes of Health of the USA (National Library of Medicine).
Footnotes
Online content
Any methods, additional references, Nature Research reporting summaries, source data, extended data, supplementary information, acknowledgements, peer review information; details of author contributions and competing interests; and statements of data and code availability are available at https://doi.org/10.1038/s41586-021-03494-3.
Competing interests The authors declare no competing interests.
Additional information
Supplementary information The online version contains supplementary material available at https://doi.org/10.1038/s41586-021-03494-3.
Peer review information Nature thanks the anonymous reviewer(s) for their contribution to the peer review of this work.
Data availability
Asgard archaea genomes generated in this study have been deposited in the eLibrary of Microbial Systematics and Genomics (https://www.biosino.org/elmsg/index) and are also available from the NCBI under BioProject identifier PRJNA680430. Publicly available genomes were retrieved from NCBI GenBank, MG-RAST and the figshare repository. The accession numbers of the newly generated and the public genomes are available in Supplementary Table 1. Supplementary data file 1 comprises the complete Asgard COG data archive (supplementary_data_file_1.tgz), and supplementary data file 2 contains the phylogenetic trees and alignments archive (supplementary_data_ file_2.tgz); these files are available without restriction from https://doi.org/10.5281/zenodo.4624280 or https://ftp.ncbi.nih.gov/pub/wolf/_suppl/asgard20/. Any other relevant data are available from the corresponding authors upon reasonable request.
References
- 1.Spang A et al. Complex archaea that bridge the gap between prokaryotes and eukaryotes. Nature 521, 173–179 (2015). [DOI] [PMC free article] [PubMed] [Google Scholar]
- 2.Zaremba-Niedzwiedzka K et al. Asgard archaea illuminate the origin of eukaryotic cellular complexity. Nature 541, 353–358 (2017). [DOI] [PubMed] [Google Scholar]
- 3.MacLeod F, Kindler GS, Wong HL, Chen R & Burns BP Asgard archaea: diversity, function, and evolutionary implications in a range of microbiomes. AIMS Microbiol 5, 48–61 (2019). [DOI] [PMC free article] [PubMed] [Google Scholar]
- 4.Cai M et al. Diverse Asgard archaea including the novel phylum Gerdarchaeota participate in organic matter degradation. Sci. China Life Sci 63, 886–897 (2020). [DOI] [PubMed] [Google Scholar]
- 5.Williams TA, Cox CJ, Foster PG, Szöllősi GJ & Embley TM Phylogenomics provides robust support for a two-domains tree of life. Nat. Ecol. Evol 4, 138–147 (2020). [DOI] [PMC free article] [PubMed] [Google Scholar]
- 6.Williams TA, Foster PG, Cox CJ & Embley TM An archaeal origin of eukaryotes supports only two primary domains of life. Nature 504, 231–236 (2013). [DOI] [PubMed] [Google Scholar]
- 7.Cox CJ, Foster PG, Hirt RP, Harris SR & Embley TM The archaebacterial origin of eukaryotes. Proc. Natl Acad. Sci. USA 105, 20356–20361 (2008). [DOI] [PMC free article] [PubMed] [Google Scholar]
- 8.Yutin N, Makarova KS, Mekhedov SL, Wolf YI & Koonin EV The deep archaeal roots of eukaryotes. Mol. Biol. Evol 25, 1619–1630 (2008). [DOI] [PMC free article] [PubMed] [Google Scholar]
- 9.Da Cunha V, Gaia M, Gadelle D, Nasir A & Forterre P Lokiarchaea are close relatives of Euryarchaeota, not bridging the gap between prokaryotes and eukaryotes. PLoS Genet 13, e1006810 (2017). [DOI] [PMC free article] [PubMed] [Google Scholar]
- 10.Da Cunha V, Gaia M, Nasir A & Forterre P Asgard archaea do not close the debate about the universal tree of life topology. PLoS Genet 14, e1007215 (2018). [DOI] [PMC free article] [PubMed] [Google Scholar]
- 11.Spang A et al. Asgard archaea are the closest prokaryotic relatives of eukaryotes. PLoS Genet 14, e1007080 (2018). [DOI] [PMC free article] [PubMed] [Google Scholar]
- 12.Forterre P The universal tree of life: an update. Front. Microbiol 6, 717 (2015). [DOI] [PMC free article] [PubMed] [Google Scholar]
- 13.Lombard J, López-García P & Moreira D The early evolution of lipid membranes and the three domains of life. Nat. Rev. Microbiol 10, 507–515 (2012). [DOI] [PubMed] [Google Scholar]
- 14.Akıl C & Robinson RC Genomes of Asgard archaea encode profilins that regulate actin. Nature 562, 439–443 (2018). [DOI] [PubMed] [Google Scholar]
- 15.Akıl C et al. Insights into the evolution of regulated actin dynamics via characterization of primitive gelsolin/cofilin proteins from Asgard archaea. Proc. Natl Acad. Sci. USA 117, 19904–19913 (2020). [DOI] [PMC free article] [PubMed] [Google Scholar]
- 16.Lu Z et al. Coevolution of eukaryote-like Vps4 and ESCRT-III subunits in the Asgard archaea. mBio 11, e00417–20 (2020). [DOI] [PMC free article] [PubMed] [Google Scholar]
- 17.Imachi H et al. Isolation of an archaeon at the prokaryote–eukaryote interface. Nature 577, 519–525 (2020). [DOI] [PMC free article] [PubMed] [Google Scholar]
- 18.Zhang J-W et al. Newly discovered Asgard archaea Hermodarchaeota potentially degrade alkanes and aromatics via alkyl/benzyl-succinate synthase and benzoyl-CoA pathway. ISME J 10.1038/s41396-020-00890-x (2021). [DOI] [PMC free article] [PubMed] [Google Scholar]
- 19.Ciccarelli FD et al. Toward automatic reconstruction of a highly resolved tree of life. Science 311, 1283–1287 (2006). [DOI] [PubMed] [Google Scholar]
- 20.Rinke C et al. Insights into the phylogeny and coding potential of microbial dark matter. Nature 499, 431–437 (2013). [DOI] [PubMed] [Google Scholar]
- 21.Nayfach S et al. A genomic catalog of Earth’s microbiomes. Nat. Biotechnol 39, 499–509 (2021). [DOI] [PMC free article] [PubMed] [Google Scholar]
- 22.Balasingam N, Brandon HE, Ross JA, Wieden H-J & Thakor N Cellular roles of the human Obg-like ATPase 1 (hOLA1) and its YchF homologs. Biochem. Cell Biol 98, 1–11 (2020). [DOI] [PubMed] [Google Scholar]
- 23.Rinke C et al. Resolving widespread incomplete and uneven archaeal classifications based on a rank-normalized genome-based taxonomy. Preprint at 10.1101/2020.03.01.972265 (2020). [DOI] [Google Scholar]
- 24.Eme L, Spang A, Lombard J, Stairs CW & Ettema TJG Archaea and the origin of eukaryotes. Nat. Rev. Microbiol 15, 711–723 (2017). [DOI] [PubMed] [Google Scholar]
- 25.Klinger CM, Spang A, Dacks JB & Ettema TJG Tracing the archaeal origins of eukaryotic membrane-trafficking system building blocks. Mol. Biol. Evol 33, 1528–1541 (2016). [DOI] [PubMed] [Google Scholar]
- 26.Puigbò P, Lobkovsky AE, Kristensen DM, Wolf YI & Koonin EV Genomes in turmoil: quantification of genome dynamics in prokaryote supergenomes. BMC Biol 12, 66 (2014). [DOI] [PMC free article] [PubMed] [Google Scholar]
- 27.Christ L, Raiborg C, Wenzel EM, Campsteijn C & Stenmark H Cellular functions and molecular mechanisms of the ESCRT membrane-scission machinery. Trends Biochem. Sci 42, 42–56 (2017). [DOI] [PubMed] [Google Scholar]
- 28.Su M-Y, Fromm SA, Zoncu R & Hurley JH Structure of the C9orf72 ARF GAP complex that is haploinsufficient in ALS and FTD. Nature 585, 251–255 (2020). [DOI] [PMC free article] [PubMed] [Google Scholar]
- 29.de Martín Garrido N & Aylett CHS Nutrient signaling and lysosome positioning crosstalk through a multifunctional protein, folliculin. Front. Cell Dev. Biol 8, 108 (2020). [DOI] [PMC free article] [PubMed] [Google Scholar]
- 30.Shen K et al. Architecture of the human GATOR1 and GATOR1–Rag GTPases complexes. Nature 556, 64–69 (2018). [DOI] [PMC free article] [PubMed] [Google Scholar]
- 31.López-García P & Moreira D The syntrophy hypothesis for the origin of eukaryotes revisited. Nat. Microbiol 5, 655–667 (2020). [DOI] [PubMed] [Google Scholar]
- 32.Martin W & Müller M The hydrogen hypothesis for the first eukaryote. Nature 392, 37–41 (1998). [DOI] [PubMed] [Google Scholar]
- 33.Moreira D & López-García P Symbiosis between methanogenic archaea and δ-proteobacteria as the origin of eukaryotes: the syntrophic hypothesis. J. Mol. Evol 47, 517–530 (1998). [DOI] [PubMed] [Google Scholar]
- 34.López-García P & Moreira D Cultured Asgard archaea shed light on eukaryogenesis. Cell 181, 232–235 (2020). [DOI] [PubMed] [Google Scholar]
- 35.Spang A et al. Proposal of the reverse flow model for the origin of the eukaryotic cell based on comparative analyses of Asgard archaeal metabolism. Nat. Microbiol 4, 1138–1148 (2019). [DOI] [PubMed] [Google Scholar]
- 36.Koonin EV & Yutin N The dispersed archaeal eukaryome and the complex archaeal ancestor of eukaryotes. Cold Spring Harb. Perspect. Biol 6, a016188 (2014). [DOI] [PMC free article] [PubMed] [Google Scholar]
- 37.Liu Y et al. Comparative genomic inference suggests mixotrophic lifestyle for Thorarchaeota. ISME J 12, 1021–1031 (2018). [DOI] [PMC free article] [PubMed] [Google Scholar]
- 38.Cheng L et al. Isolation and characterization of Methanoculleus receptaculi sp. nov. from Shengli oil field, China. FEMS Microbiol. Lett 285, 65–71 (2008). [DOI] [PubMed] [Google Scholar]
- 39.Peng J, Lü Z, Rui J & Lu Y Dynamics of the methanogenic archaeal community during plant residue decomposition in an anoxic rice field soil. Appl. Environ. Microbiol 74, 2894–2901 (2008). [DOI] [PMC free article] [PubMed] [Google Scholar]
- 40.Uritskiy GV, DiRuggiero J & Taylor J MetaWRAP–a flexible pipeline for genome-resolved metagenomic data analysis. Microbiome 6, 158 (2018). [DOI] [PMC free article] [PubMed] [Google Scholar]
- 41.Li D, Liu CM, Luo R, Sadakane K & Lam TW MEGAHIT: an ultra-fast single-node solution for large and complex metagenomics assembly via succinct de Bruijn graph. Bioinformatics 31, 1674–1676 (2015). [DOI] [PubMed] [Google Scholar]
- 42.Langmead B & Salzberg SL Fast gapped-read alignment with Bowtie 2. Nat. Methods 9, 357–359 (2012). [DOI] [PMC free article] [PubMed] [Google Scholar]
- 43.Kang DD et al. MetaBAT 2: an adaptive binning algorithm for robust and efficient genome reconstruction from metagenome assemblies. PeerJ 7, e7359 (2019). [DOI] [PMC free article] [PubMed] [Google Scholar]
- 44.Sieber CMK et al. Recovery of genomes from metagenomes via a dereplication, aggregation and scoring strategy. Nat. Microbiol 3, 836–843 (2018). [DOI] [PMC free article] [PubMed] [Google Scholar]
- 45.Peng Y, Leung HCM, Yiu SM & Chin FYL IDBA-UD: a de novo assembler for single-cell and metagenomic sequencing data with highly uneven depth. Bioinformatics 28, 1420–1428 (2012). [DOI] [PubMed] [Google Scholar]
- 46.Bolger AM, Lohse M & Usadel B Trimmomatic: a flexible trimmer for Illumina sequence data. Bioinformatics 30, 2114–2120 (2014). [DOI] [PMC free article] [PubMed] [Google Scholar]
- 47.Nurk S, Meleshko D, Korobeynikov A & Pevzner PA metaSPAdes: a new versatile metagenomic assembler. Genome Res 27, 824–834 (2017). [DOI] [PMC free article] [PubMed] [Google Scholar]
- 48.Parks DH, Imelfort M, Skennerton CT, Hugenholtz P & Tyson GW CheckM: assessing the quality of microbial genomes recovered from isolates, single cells, and metagenomes. Genome Res 25, 1043–1055 (2015). [DOI] [PMC free article] [PubMed] [Google Scholar]
- 49.Hyatt D et al. Prodigal: prokaryotic gene recognition and translation initiation site identification. BMC Bioinformatics 11, 119 (2010). [DOI] [PMC free article] [PubMed] [Google Scholar]
- 50.Seemann T Prokka: rapid prokaryotic genome annotation. Bioinformatics 30, 2068–2069 (2014). [DOI] [PubMed] [Google Scholar]
- 51.Chan PP & Lowe TM tRNAscan-SE: searching for tRNA genes in genomic sequences. Methods Mol. Biol 1962, 1–14 (2019). [DOI] [PMC free article] [PubMed] [Google Scholar]
- 52.Schäffer AA et al. Improving the accuracy of PSI-BLAST protein database searches with composition-based statistics and other refinements. Nucleic Acids Res 29, 2994–3005 (2001). [DOI] [PMC free article] [PubMed] [Google Scholar]
- 53.Steinegger M & Söding J MMseqs2 enables sensitive protein sequence searching for the analysis of massive data sets. Nat. Biotechnol 35, 1026–1028 (2017). [DOI] [PubMed] [Google Scholar]
- 54.Edgar RC MUSCLE: a multiple sequence alignment method with reduced time and space complexity. BMC Bioinformatics 5, 113 (2004). [DOI] [PMC free article] [PubMed] [Google Scholar]
- 55.Söding J Protein homology detection by HMM–HMM comparison. Bioinformatics 21, 951–960 (2005). [DOI] [PubMed] [Google Scholar]
- 56.Price MN, Dehal PS & Arkin AP FastTree 2—approximately maximum-likelihood trees for large alignments. PLoS ONE 5, e9490 (2010). [DOI] [PMC free article] [PubMed] [Google Scholar]
- 57.Rice P, Longden I & Bleasby A EMBOSS: the European Molecular Biology Open Software Suite. Trends Genet 16, 276–277 (2000). [DOI] [PubMed] [Google Scholar]
- 58.Katoh K & Standley DM MAFFT multiple sequence alignment software version 7: improvements in performance and usability. Mol. Biol. Evol 30, 772–780 (2013). [DOI] [PMC free article] [PubMed] [Google Scholar]
- 59.Nguyen L-T, Schmidt HA, von Haeseler A & Minh BQ IQ-TREE: a fast and effective stochastic algorithm for estimating maximum-likelihood phylogenies. Mol. Biol. Evol 32, 268–274 (2015). [DOI] [PMC free article] [PubMed] [Google Scholar]
- 60.Larsson A AliView: a fast and lightweight alignment viewer and editor for large datasets. Bioinformatics 30, 3276–3278 (2014). [DOI] [PMC free article] [PubMed] [Google Scholar]
- 61.Esterman ES, Wolf YI, Kogay R, Koonin EV & Zhaxybayeva O Evolution of DNA packaging in gene transfer agents. Virus Evol 7, veab015 (2021). [DOI] [PMC free article] [PubMed] [Google Scholar]
- 62.Puigbò P, Wolf YI & Koonin EV Search for a ‘Tree of Life’ in the thicket of the phylogenetic forest. J. Biol 8, 59 (2009). [DOI] [PMC free article] [PubMed] [Google Scholar]
- 63.R Core Team. R: A Language and Environment for Statistical Computing (R Foundation for Statistical Computing, 2019). [Google Scholar]
- 64.Zimmermann L et al. A completely reimplemented MPI bioinformatics toolkit with a new HHpred server at its core. J. Mol. Biol 430, 2237–2243 (2018). [DOI] [PubMed] [Google Scholar]
- 65.Yang M, Derbyshire MK, Yamashita RA & Marchler-Bauer A NCBI’s conserved domain database and tools for protein domain analysis. Curr. Protoc. Bioinformatics 69, e90 (2020). [DOI] [PMC free article] [PubMed] [Google Scholar]
- 66.Søndergaard D, Pedersen CNS & Greening C HydDB: a web tool for hydrogenase classification and analysis. Sci. Rep 6, 34212 (2016). [DOI] [PMC free article] [PubMed] [Google Scholar]
- 67.Criscuolo A & Gribaldo S BMGE (block mapping and gathering with entropy): a new software for selection of phylogenetic informative regions from multiple sequence alignments. BMC Evol. Biol 10, 210 (2010). [DOI] [PMC free article] [PubMed] [Google Scholar]
- 68.Swofford DL & Maddison WP Reconstructing ancestral character states under Wagner parsimony. Math. Biosci 87, 199–229 (1987). [Google Scholar]
Associated Data
This section collects any data citations, data availability statements, or supplementary materials included in this article.
Supplementary Materials
Data Availability Statement
Asgard archaea genomes generated in this study have been deposited in the eLibrary of Microbial Systematics and Genomics (https://www.biosino.org/elmsg/index) and are also available from the NCBI under BioProject identifier PRJNA680430. Publicly available genomes were retrieved from NCBI GenBank, MG-RAST and the figshare repository. The accession numbers of the newly generated and the public genomes are available in Supplementary Table 1. Supplementary data file 1 comprises the complete Asgard COG data archive (supplementary_data_file_1.tgz), and supplementary data file 2 contains the phylogenetic trees and alignments archive (supplementary_data_ file_2.tgz); these files are available without restriction from https://doi.org/10.5281/zenodo.4624280 or https://ftp.ncbi.nih.gov/pub/wolf/_suppl/asgard20/. Any other relevant data are available from the corresponding authors upon reasonable request.