



Abstract
Following a request from the European Commission, the EFSA Panel on Nutrition, Novel Foods and Food Allergens (NDA) was asked to deliver a scientific opinion on the tolerable upper intake level (UL) for iron. Systematic reviews were conducted to identify evidence regarding high iron intakes and risk of chronic diseases, adverse gastrointestinal effects and adverse effects of iron supplementation in infancy, young childhood and pregnancy. It is established that systemic iron overload leads to organ toxicity, but no UL could be established. The only indicator for which a dose–response could be established was black stools, which reflect the presence of large amounts of unabsorbed iron in the gut. This is a conservative endpoint among the chain of events that may lead to systemic iron overload but is not adverse per se. Based on interventions in which black stools did not occur at supplemental iron intakes of 20–25 mg/day (added to a background intake of 15 mg/day), a safe level of intake for iron of 40 mg/day for adults (including pregnant and lactating women) was established. Using allometric scaling (body weight0.75), this value was scaled down to children and adolescents and safe levels of intakes between 10 mg/day (1–3 years) and 35 mg/day (15–17 years) were derived. For infants 7–11 months of age who have a higher iron requirement than young children, allometric scaling was applied to the supplemental iron intakes (i.e. 25 mg/day) and resulted in a safe level of supplemental iron intake of 5 mg/day. This value was extended to 4–6 month‐old infants and refers to iron intakes from fortified foods and food supplements, not from infant and follow‐on formulae. The application of the safe level of intake is more limited than a UL because the intake level at which the risk of adverse effects starts to increase is not defined.
Keywords: adverse effects, iron homeostasis, iron overload, safe level of intake
1. INTRODUCTION
1.1. Background as provided by the European Commission
Article 6 of Regulation (EC) No 1925/2006 on the addition of vitamins and minerals and of certain other substances to foods and Article 5 of Directive 2002/46/EC on the approximation of the laws of the Member States relating to food supplements provide that maximum amount of vitamins and minerals added to foods and to food supplements, respectively, shall be set.
The above‐mentioned provisions lay down the criteria to be taken into account when establishing these maximum amounts that include the upper safe levels (ULs) of vitamins and minerals established by scientific risk assessment based on “generally accepted scientific data, taking into account, as appropriate, the varying degrees of sensitivity of different groups of consumers”.
To set maximum amounts of vitamins and minerals in fortified foods and food supplements, the Commission would like to ask the European Food Safety Authority (EFSA) to review the previous opinions of the Scientific Committee on Food (SCF) or the NDA Panel on the ULs for vitamin A, 1 folic acid/folate,1 vitamin D,1 vitamin E,1 Vitamin B6,1 iron,1 manganese1 and β‐carotene1 to take into account recent scientific developments and evidence.
In this context, EFSA should first review the guidelines of the SCF1 for the development of tolerable upper intake levels for vitamins and minerals (adopted on 19 October 2000).
Tolerable Upper Intake Levels should be presented separately for the age group from 4/6 months onwards until 3 years of age and the general population group from 3 years onwards, taking into account, as appropriate, the varying degrees of sensitivity of different consumer groups. As foods intended for the general population are also consumed by young children, young children should be considered as a potentially sensitive consumer group.
1.2. Terms of reference as provided by the European Commission
In accordance with Article 29(1)(a) of Regulation (EC) No 178/2002, the European Commission requests the European Food Safety Authority to:
Update the guidelines of the SCF for the development of Tolerable Upper Intake Levels for vitamins and minerals in the light of available recent scientific and methodological developments.
- Review existing scientific evidence and provide advice on Tolerable Upper Intake Levels for the following vitamins and minerals including their currently authorised forms for the addition to fortified foods and food supplements for the general population and, as appropriate, for vulnerable subgroups of the population:
- vitamin A
- folic acid/folate
- vitamin D
- vitamin E
- iron
- manganese
- β‐carotene
- vitamin B6
For nutrients for which there are no, or insufficient, data on which to base the establishment of an UL, an indication should be given on the highest level of intake where there is reasonable confidence in data on the absence of adverse effects.
1.3. Interpretation of the Terms of Reference
According to the mandate, EFSA has first reviewed the guidelines of the SCF for the development of tolerable upper intake levels (ULs) for vitamins and minerals (SCF, 2000). A draft guidance has been endorsed by the Panel on Nutrition, Novel Foods and Food Allergens (NDA) and published for a 1‐year pilot phase (EFSA NDA Panel, 2022a) after which it will be revised and complemented as necessary, following a public consultation.
The Panel interprets that the previous assessment by the EFSA NDA Panel (2004) should be revised according to the principles laid down in the above‐mentioned guidance, following a protocol developed for that purpose (Annex A) and covering all sources of iron authorised for addition to foods and food supplements in the EU. Whenever relevant, the influence of haem and non‐haem iron on an observed relationship between high iron intakes and an adverse health outcome will also be considered.
1.4. Context of the assessment
The NDA Panel evaluated the UL for iron in 2004 (EFSA NDA Panel, 2004). The Panel concluded that the available data were insufficient to establish a UL for iron. Although there have been reports of adverse gastrointestinal (GI) effects with short‐term ingestion of non‐haem iron preparations at doses of 50–60 mg/day, the Panel noted that these adverse GI effects are not a suitable basis to establish a UL which refers to daily chronic intakes for iron from all sources. The Panel also considered that a UL cannot be established for iron based on systemic iron overload [based on serum ferritin (SF) concentrations], due to the inadequacy of data which did not allow the development of dose–response curves between intake, homeostatic adaptations, body burden and adverse health effects, including increased risk of chronic diseases (i.e. cardiovascular disease, diabetes and cancer).
The peer review of the pesticide risk assessment of the active substance iron sulfate by EFSA stated that adverse health effects can occur at iron intakes of > 20 mg/kg body weight (bw). It was stated that adverse health effects such as adverse GI effects, liver dysfunction and renal failure can occur at doses well above 50 mg/day which was noted to correspond to the acceptable daily intake (ADI) of 0.8 mg/kg bw per day (EFSA, 2012). The same reference point was taken for the risk assessments of ferric phosphate (EFSA, 2015a) and ferric pyrophosphate (EFSA, 2020).
A summary of evaluations by other risk assessments bodies is given in Section 3.5 and Table 1.
TABLE 1.
Overview of existing tolerable upper intake Levels, in mg/day.
| Population group | IOM (2001) | NHMRC (2006) | EFSA NDA Panel (2004) | NNR (2014) |
|---|---|---|---|---|
| 0–6 months | 40 | 20 | nd | nd |
| 7–12 months | 40 | 20 | nd | nd |
| 1–3 years | 40 | 20 | nd | nd |
| 4–8 years | 40 a | 40 | nd | nd |
| 7–10 years | 40 a | 40 | nd | nd |
| 9–13 years | 40 a | 40 | nd | nd |
| 14–18 years | 45 b | 45 | nd | nd |
| ≥ 18 years | 45 c | nd | 60 d | |
| ≥ 19 years | 45 c |
Abbreviations: EFSA, European Food Safety Authority; IOM, Institute of Medicine; nd, not defined; NHMRC, National Health and Medical Research Council Australia and New Zealand; NNR, Nordic Nutrition Recommendations.
Extrapolated from the UL for infants (IOM).
Extrapolated from the UL for adults (IOM).
Including pregnant and lactating women.
Excluding pregnant women.
The safety evaluation of several forms of iron when added for nutritional purposes to foods and/or for use as food supplements, or foods intended for particular nutritional uses, has been carried out by EFSA. EFSA concluded the following iron sources were of no safety concern under the proposed conditions of use: ferrous ammonium phosphate (EFSA ANS Panel, 2010a), ferrous phosphate (EFSA ANS Panel, 2009a), iron (II) taurate (EFSA ANS Panel, 2009b), iron l‐pidolate (EFSA AFC Panel, 2007), ferrous bisglycinate (EFSA AFC Panel, 2006) and ferric sodium ethylenediaminetetraacetic acid (EDTA) as long as it does not lead to an exposure to EDTA above 1.9 mg EDTA/kg bw per day (EFSA ANS Panel, 2010b).
Iron hydroxide adipate tartrate and iron milk proteinate/caseinate have recently been assessed by the NDA Panel as novel nutrient sources intended to be used in food supplements and were deemed safe under the proposed conditions of use (EFSA NDA Panel, 2021, 2022b).
1.5. Previous assessments by other bodies
The Institute of Medicine (IOM, 2001) in the USA considered GI effects as the critical adverse effect on which to base the UL for iron. The available evidence for the risk of other endpoints considered in their assessment, including impaired zinc absorption, increased risk for vascular disease and cancer and systemic iron overload, did not allow the determination of a UL. IOM noted that adverse GI effects manifested mainly in individuals consuming high doses of supplemental iron in a fasting state. A lowest observed adverse effect level (LOAEL) for supplemental iron of 60 mg/day (from iron salts) was identified from the controlled double‐blind crossover study by Frykman et al. (1994). Adverse GI effects were assessed in 97 Swedish men and women, who were given for periods of 30 days: (i) a non‐haem iron supplement (60 mg/day as iron fumarate) or (ii) a supplement with haem and non‐haem iron (2.4 mg/day iron from porcine blood and 16 mg/day as iron fumarate). The trial was divided in three phases and all participants randomly received placebo in one of the last two phases. The frequency of constipation and total incidence of all adverse effects were significantly higher among individuals receiving the non‐haem iron supplement, compared to those receiving the supplement with a combination of haem and non‐haem iron or the placebo. The IOM reported that the adverse GI effects were minor. However, five individuals had to stop taking the supplements due to adverse GI effects. The LOAEL for total iron intake was estimated using the supplemental intake of iron from iron salts (60 mg/day) in the study and adding 11 mg/day, which was the estimated mean iron intake from food in women from six European countries (van de Vijver et al., 1999) and in Danish men (Bro et al., 1990). A LOAEL for total iron intake of 70 mg/day was identified. Supportive evidence for a LOAEL of 50–120 mg/day supplemental iron salts was available from prospective studies (Brock & Curry, 1985; Coplin et al., 1991; Liguori, 1993; Lökken & Birkeland, 1979) which did not include a placebo control group, or in which the population studied was smaller than in the study by Frykman et al. (1994). For the extrapolation from a LOAEL to a no observed adverse effect level (NOAEL), an uncertainty factor (UF) of 1.5 was applied and IOM established a UL of 45 mg/day of iron for adults (≥ 19 years old). There was a lack of data with doses less than 100 mg/day to identify a NOAEL for pregnant women. Therefore, the same UL established for all adults was applied to pregnant and lactating women. No adverse GI effects were reported in studies where infants and young children were supplemented with 5–30 mg/day non‐haem iron for a duration of 3–21 months (Burman, 1972; Farquhar, 1963; Reeves & Yip, 1985). The median iron intake for infants aged 11–14 months was thought to be about 10 mg/day. The NOAEL was then estimated to be 40 mg/day and an UF of 1 was applied, given the uncertainty is very low regarding the doses inducing adverse GI effects in infants and young children. Therefore, the UL for infants and young children was set at 40 mg/day. Due to the lack of data in children of the ages 4–18 years, the UL for infants and young children (40 mg/day) was extended to children 4–13 years old and the UL for adults (45 mg/day) was extended to adolescents 14–18 years old.
The Expert Group on Vitamins and Minerals (EVM) of the UK Food Standards Agency established a guidance level for supplemental intake of iron, due to insufficient appropriate data to establish a UL (EVM, 2003). The studies thought of as most critical in their evaluation were mostly the same studies considered by the IOM with adverse GI effects as endpoint, i.e. Blot et al. (1981); Brock and Curry (1985); Coplin et al. (1991); Liguori (1993); Frykman et al. (1994); and Lökken and Birkeland (1979). Adverse GI effects in these studies were observed following supplemental doses of 50–220 mg iron/day and the frequency of the effects increased at higher doses. The lower end of this range of supplemental doses was divided by an UF of 3 to extrapolate from a LOAEL to a NOAEL. A guidance level of supplemental intake of approximately 17 mg/day (0.28 mg/kg bw per day for a 60 kg adult) was established; this level did not apply to individuals with predisposition to systemic iron overload, such as individuals homozygous for hereditary haemochromatosis who have unregulated, increased absorption of dietary iron. The EVM noted that the available studies did not investigate GI or any other adverse effects in detail, and data on the long‐term implications of supplemental iron on iron status or storage were not available.
The Joint FAO/WHO Expert Committee on Food Additives (JECFA, 1983) noted that ‘normal individuals have taken daily supplements of 50 mg of iron per day (ferrous iron) of long periods without any adverse effects.’ They also noted that the body has a considerable capacity to store iron and that chronic systemic iron overload may occur in individuals with disorders of iron absorption and metabolism. JEFCA set a provisional maximum tolerable daily Intake of 0.8 mg/kg bw per day for adults, applicable to iron from all sources except iron oxides and hydrated iron oxides used as colouring agents and iron supplements taken during pregnancy and lactation.
The Australia and New Zealand National Health and Medical Research Council (NHMRC, 2006) followed the same approach and considered the same studies as IOM (2001) in deriving a UL for adults and children 4–13 years old, while their approach for deriving the UL for infants and young children differed. Therefore, the UL for adults (including pregnant and lactating women), and adolescents 14–18 years old, was set at 45 mg/day; the UL for children 4–13 years old was set at 40 mg/day. For infants and young children, the UL was set at 20 mg/day considering an UF of 3 to extrapolate from the LOAEL to the NOAEL based on the randomised trial by Dewey et al. (2002).
The Nordic Nutrition Recommendations (NNR) (Nordic Council of Ministers, 2014) for Denmark, Finland, Iceland, Norway and Sweden derived a UL of 60 mg/day for adults (excluding pregnant women) based on the risk of biochemical iron overload, while a UL for infants was not established due to lack of data. The study by Fleming et al. (2002) observed a significantly higher risk of ‘high iron stores’ at an intake of ≥ 30 mg supplemental iron/day compared to no supplement use as the supplemental intake was associated with plasma‐ferritin > 300 mg/L or > 200 mg/L in elderly men and women, respectively. It had been previously suggested that supplemental intake of 10–15 mg iron/day allowed for the homeostatic regulation of iron absorption by adaptation of intestinal absorption (Bothwell et al., 1989; Hallberg et al., 1998; IOM, 2001; Beard, 2002). NNR also cited, as supportive evidence, theoretical calculations performed by Borch‐Iohnsen and Pettersson (1995). The authors suggested that, based on their calculations, supplemental intake of an extra 60 mg iron/day over 5 years could put a non‐pregnant non‐menopausal woman with a body weight of 63 kg at risk of storing excessive iron. NNR could not establish any dose‐dependent relationships between risk of cardiovascular disease, cancer or diabetes and dietary iron. Recently, the NNR published revised recommendations (Blomhoff et al., 2023). However, the UL of 60 mg/day was kept based on their assessment from 2012.
The Norwegian Scientific Committee for Food Safety (VKM, 2017) used the temporary guidance level for iron intake set by JECFA, as also suggested by Rasmussen et al. (2006), which was 50 mg/day for adults and 0.8 mg/kg bw per day for other age groups. VKM noted that this also takes the risk of developing chronic illnesses from systemic iron overload into account.
2. DATA AND METHODOLOGIES
2.1. Problem formulation
In accordance with the draft NDA Panel guidance on establishing and applying ULs for vitamins and essential minerals (EFSA NDA Panel, 2022a, 2022b), the assessment questions underlying the UL evaluation are formulated as follows:
What is the maximum level of total chronic daily intake of iron (from all sources) which is not expected to pose a risk of adverse health effects to humans? (Hazard identification and characterisation)
What is the daily intake of iron from all dietary sources in EU populations? (Intake assessment)
What is the risk of adverse effects related to the intake of iron in EU populations, including attendant uncertainties? (Risk characterisation)
Adverse (health) effects are defined as a change in the morphology, physiology, growth, development, reproduction or life span of an organism, system or (sub)population that results in an impairment of functional capacity to compensate for additional stress or an increase in susceptibility to other influences (EFSA Scientific Committee, 2017a; FAO/WHO, 2009). The observable effects of high nutrient intake within the causal pathway of an adverse health effect can range from biochemical changes without functional significance (e.g. certain changes in enzyme activity) to irreversible clinical outcomes. Notably, some changes that occur before clinical manifestations could be used as surrogate or predictive markers of subsequent adverse health effects, i.e. biomarkers of effect (EFSA NDA Panel, 2022a, 2022b).
Priority adverse health effects, i.e. those that are expected to play a critical role for establishing a UL, were identified in consultation with a panel of qualified experts on iron 2 and after discussion by the UL Working Group (WG) as follows:
GI effects
Zinc absorption and status
Type 2 diabetes mellitus (T2DM)
Gestational diabetes mellitus (GDM)
Adverse health effects in pregnant women [preterm birth or labour, intrauterine growth restriction (IUGR), birth weight/length/head circumference (HC), stillbirths, preeclampsia]
Adverse health effects in infants and young children (growth impairment, risk of diarrhoea, risk of infections, neurodevelopment, asthma and respiratory function)
As a result of the problem formulation, the overarching risk assessment questions were further specified into assessment subquestions (sQs) and the methods to address each sQ was selected, as outlined in Table 2.
TABLE 2.
Assessment subquestions and methods to address them (as laid down in the protocol).
| Subquestion | Method | |
|---|---|---|
| sQ1 |
Absorption, distribution, metabolism and excretion (ADME) of different forms of iron 1a. What is the ADME and relative bioavailability a of different forms of iron in humans? 1b. What are differences related to age, or other individual factors, such as genetic polymorphisms (e.g. C282Y heterozygotes) or iron status, that should be taken into consideration in the derivation of an UL which is protective for the general population? |
Narrative review Narrative review |
| sQ2 |
Biomarkers of exposure to iron 2a. What is the (quantitative) relationship between SF concentration and liver toxicity? 2b. What is the dose–response relationship between iron intake and SF concentration in adults free of conditions expected to affect circulating SF concentrations |
Narrative review Systematic review (focused on intervention trials) |
| sQ3 |
Gastrointestinal effects 3a. What is the dose–response relationship between the consumption of iron dietary supplements and acute adverse GI effects? 3b. What are the potential mechanisms/mode(s) of action underlying the relationships between iron intake and these endpoints? |
Systematic review Narrative review |
| sQ4 |
Zinc absorption 4a. Does ‘high iron’ intake (intake higher than expected from an average diet) affect zinc absorption and zinc status in humans? If so, can a dose–response be characterised? 4b. What are the potential mechanisms/mode(s) of action underlying the relationships between iron intake and these endpoints? |
Narrative review Narrative review |
| sQ5 |
Diabetes 5a. Does ‘high iron’ intake (intake higher than expected from an average diet) or changed levels of indicators thereof increase the risk of T2DM in adults? If so, what is the dose response, if extractable? 5b. Does ‘high iron’ intake (intake higher than expected from an average diet) or changed levels of indicators thereof increase the risk of GDM? If so, what is the dose–response, if extractable? 5c. What are the potential mechanisms/mode(s) of action underlying the relationships between iron intake and these endpoints? |
Systematic review Systematic review Narrative review |
| sQ6 |
Adverse effects of iron supplementation in infants, young children and pregnant women 6a. What is the evidence on adverse effects of ‘high iron’ intake (intake higher than expected from an average diet) in infants? 6b. What is the evidence on adverse effects of ‘high iron’ intake (intake higher than expected from an average diet) in pregnant women and/or for the unborn/newborn child? |
Systematic review Systematic review |
| sQ7 |
Iron intake 7a. What are the levels of iron in foods, beverages and food supplements in the EU? 7b. What is the distribution of daily iron intake from all dietary sources in EU populations and subgroups thereof? |
Food composition and food consumption data in the EU |
Limited to in vivo data.
2.2. Hazard identification and characterisation
Preparatory work regarding subquestions sQ1 to sQ6 was performed by a contractor. 3 The technical report of the contractor is published (Parlesak et al., 2024). The technical report served as the primary source of information for this assessment. However, the Panel conducted an independent evaluation of the evidence.
2.2.1. Data
A description of the processes applied for evidence retrieval, study selection and data extraction is provided below. These steps were conducted by a contractor and were undertaken by the University of Copenhagen in collaboration with the University of Oslo and the Karolinska Institutet. A detailed description of the steps is published in the final report of this outsourcing project (Parlesak et al., 2024).
2.2.1.1. Priority adverse health effects addressed through systematic reviews (sQ2b, sQ3a, sQ5a, sQ5b, sQ6a and sQ6b)
To address sQ2b, sQ3a, sQ5a, sQ5b, sQ6a and sQ6b, relevant human studies, published in English, on the selected adverse health effects were identified through systematic searches of the literature in MEDLINE (Ovid), Embase (Ovid) and Cochrane Central Register of Controlled Trials conducted until 19 April 2022 (for sQ2b, sQ3a, sQ6a and sQ6b) and until 22 April 2022 (for sQ5a (T2DM) and sQ5b (GDM)). No date limit was applied, except for sQ3a (adverse GI effects) for which the search was restricted to articles published after 2003 (i.e. after the last assessment of the UL for iron by EFSA, protocol amendment 1). The search strategy was created by information specialists of the University of Oslo and peer reviewed by information specialists at the Karolinska Institutet and EFSA. It is further detailed in the final report of the outsourcing project (Parlesak et al., 2024). Grey literature (i.e. literature not indexed in literature databases) was not searched.
Retrieved articles were screened in duplicate in Distiller SR® at title and abstract level, also with the use of the artificial intelligence tool of Distiller SR®, and at full‐text level for inclusion/exclusion according to the criteria defined in the protocol (Annex A). Conflicts were solved by a third reviewer, if necessary. Relevant systematic reviews, if available, were hand‐searched for additional pertinent studies. Reviews, expert opinions, editorials, letters to the editors, abstracts, posters and theses not reporting on original data were excluded.
Eligible designs: For sQ2b, sQ3a, sQ6a and sQ6b, eligible study designs were limited to randomised controlled trials (RCTs) (protocol amendment 2). For this purpose, the sensitivity and precision maximising filter for RCTs was used in PubMed. In Embase, the search strings were designed to specifically retrieve RCTs. For sQ5a (T2DM) and sQ5b (GDM), non‐randomised comparative studies of interventions and prospective observational (prospective cohort, case‐cohort and nested case–control) studies as well as follow‐up of intervention studies were eligible.
Eligible study populations: For sQ2b, sQ6a and sQ6b, the eligible study population was limited to apparently healthy individuals without iron deficiency or iron deficiency anaemia. Anaemia of unknown origin, malnutrition and infection with malaria were added as exclusion criteria for sQ6a (infant outcomes) and sQ6b (pregnant women) (protocol amendment 3). Contrary to sQ2b, sQ6a and sQ6b, for sQ3a (adverse GI effects), individuals with iron deficiency or iron deficiency anaemia were eligible.
For sQ5a (T2DM) and sQ5b (GDM), studies were eligible if they involved adults and pregnant women, respectively, either healthy individuals or diseased individuals if the disease was considered not to be related to the exposure‐outcome relationship.
Eligible exposure measurements: For sQ2b, sQ3a, sQ6a and sQ6b, studies were eligible if they investigated supplemental iron intake. For sQ5a (T2DM) and sQ5b (GDM), RCTs were eligible if they investigated supplemental iron intake and observational studies if they measured iron intake by dietary assessment methods or used accepted biomarkers of iron status, i.e. SF, transferrin saturation (TSAT), total iron binding capacity (TIBC) and soluble transferrin receptor (sTfR)‐to‐ferritin ratio. As sTfR is rather a marker of physiological iron requirement, it was not used in the assessment (protocol amendment 4).
For sQ5b (GDM), studies investigating oral iron intake from all sources and repeated administration for at least 4 weeks were eligible.
In relation to sQ2b, sQ3a, sQ6a and sQ6b, 11,918 unique references were identified after removing duplicates (flow chart in Appendix A ). The title and abstract screening left 353 relevant articles that underwent a full‐text review. A total of 138 publications were initially identified as relevant. After protocol amendment 3 and further exclusion at data extraction, 93 articles remained for assessment. A total number of 33 articles were used by the contractor (Parlesak et al., 2024) for answering sQ2b (relationship between SF concentrations and total iron intakes). As the Panel decided not to pursue this question (see Section 3.3), these articles were not used in the present opinion. For sQ3a (adverse GI effects), a total of 62 articles met the inclusion criteria. Of those, 58 are described in the contractor's report (Parlesak et al., 2024). As described in Section 3.5.4 , a further subselection of the articles was made by the Panel during the assessment and six articles out of the 62 articles retrieved were used by the Panel. To this, three articles which were included in previous assessments (IOM, 2001; EFSA NDA Panel, 2004) were added as well as one article (Friling et al., 2022) published after the deadline for the literature search which was, however, considered to bring relevant evidence to the assessment. This brought the total number of articles described for sQ3a in this opinion to 10 reporting on 13 intervention studies. For sQ6a (adverse effects of iron supplementation in infants and young children), five RCTs were included for the assessment of the effect of iron supplementation on growth, two for the effect on cognitive development and another two for the effect on infections. For sQ6b (adverse effects of iron supplementation in pregnant women), five RCTs were considered relevant.
In relation to sQ5a (T2DM) and sQ5b (GDM), 4679 unique references were identified after removing duplicates (flow chart in Appendix A ). The title and abstract screening left 98 relevant articles that underwent a full‐text review. A total of 60 publications were initially identified as relevant. After further exclusion at the data extraction level and the decision of not taking into account studies which reported on the relationship between diabetes and haem or non‐haem iron intake as well as on the relationship between diabetes and biomarkers of iron status (see Sections 3.5.2 and 3.5.3 ), 17 articles remained for assessment, i.e. 10 articles reporting on nine PC studies for sQ5a and three intervention studies as well as three PC studies for sQ5b.
Data were extracted by the contractor in Distiller SR® and then transferred to Microsoft Excel® for the purpose of data plotting and into Microsoft Word® for the preparation of evidence tables (Appendix B ).
2.2.1.2. Priority adverse health effects addressed through narrative reviews (sQ4a and parts of sQ6a)
For sQ4a and the sQ on cognitive development of sQ6a, narrative reviews were conducted (protocol amendment 5 for sQ6a). Relevant studies were retrieved from the search performed to inform sQ3a and by searching in the reference list of relevant systematic reviews.
2.2.1.3. Other background information (sQ1a, sQ1b, sQ3b, sQ4b and sQ5c)
For sQ1a, sQ1b, sQ3b, sQ4b and sQ5c, information from textbooks, existing evaluations, authoritative reviews and research papers retrieved through non‐systematic searches in bibliographic databases, and selected on the basis of their relevance, were used as sources of information. The information was summarised through a narrative review.
2.2.2. Methodologies
The methodology for this assessment follows the guidance for establishing ULs developed by the EFSA NDA Panel (2022a). Other guidance documents from EFSA were also considered, including those addressing the application of the systematic review methodology in food and feed safety assessments (EFSA, 2010), the principles and processes for dealing with data and evidence in scientific assessments (EFSA, 2015b), the statistical significance and biological relevance (EFSA Scientific Committee, 2011), the biological relevance of data (EFSA Scientific Committee, 2017a), the use of the weight of evidence approach (EFSA Scientific Committee, 2017b), the appraisal and integration of evidence from epidemiological studies (EFSA Scientific Committee, 2020) and the analysis of uncertainty in scientific assessments (EFSA Scientific Committee, 2018).
2.2.2.1. Evidence appraisal
A risk of bias (RoB) appraisal of individual studies, i.e. evaluation of their internal validity, by two independent reviewers, was done by the contractor (Parlesak et al., 2024) and was applied to eligible studies which addressed sQ2b (SF vs. intake) and sQ5a (T2DM) in order to investigate whether the RoB tier had an impact on the outcome of the assessment. As this was not the case, the outcome of the RoB appraisal is not further described in the present opinion. Owing to some unexplained inconsistencies in the BoE which emerged during the assessment of the data by the Panel, a RoB assessment for sQ6a (infant growth) and sQ3 (adverse GI effects) was performed by EFSA. Two EFSA staff members performed independently an initial RoB assessment which was then reviewed and discussed by experts of the WG. No appraisal was done for sQ5b and sQ6b as the evidence retrieved for these outcomes could not be used for setting a UL.
The appraisal was based on a customised version of the Office of Health Assessment and Translation (OHAT) RoB tool developed by the US National Toxicology Program (NTP) (OHAT/NTP, 2015). Generally, any discrepancies in the RoB assessment for each bias domain were discussed among the assessors. If there was disagreement, a third reviewer was consulted for resolution.
2.2.2.2. Evidence synthesis
The methods applied for the evidence synthesis to address sQ2b is detailed in the contractor's report (Parlesak et al., 2024).
For sQ3, sQ5a and sQ6a, descriptive forest plots were produced using R. Results are reported as mean differences to a reference group or as odds ratios (ORs).
2.2.2.3. Evidence integration and uncertainty analysis
Hazard identification
The hazard identification step consisted of assessing the evidence for a causal positive relationship between iron intake and the health effects identified.
Owing to the type of data retrieved, each outcome consisted of a single line of evidence (LoE) only.
For considering the uncertainties in the body of evidence (BoE), a stepwise approach was applied as illustrated in Figure 1 and described below:
FIGURE 1.
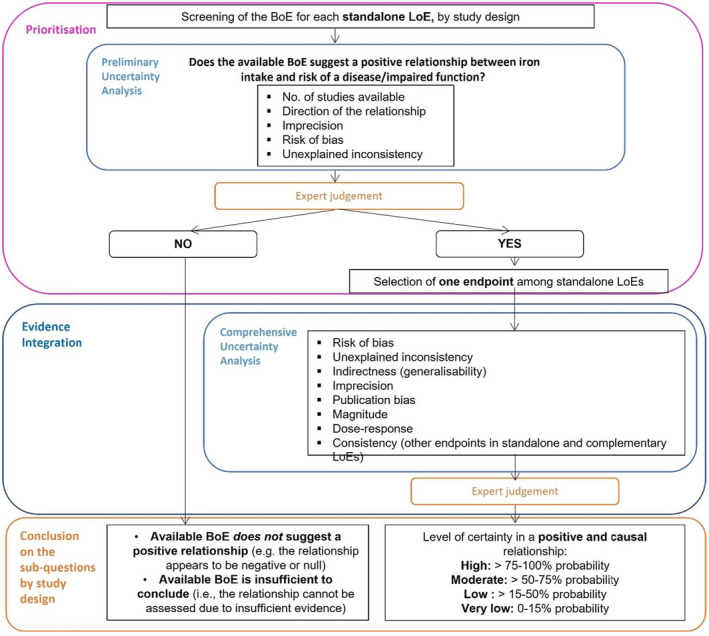
Stepwise approach for evidence integration and uncertainty analysis. BoE, body of evidence; LoE, line of evidence.
Prioritisation
A prioritisation step is applied to identify health effects for which the available BoE suggests a positive relationship between dietary intake of iron and risk of disease/impaired function based on a preliminary uncertainty analysis (UA) and expert judgement. The Panel considers that health effects for which the available BoE (i) does not suggest a positive relationship (i.e. the relationship appears to be negative or null) or (ii) is insufficient to conclude on a relationship, cannot be used to inform the setting of a UL for iron. Data gaps and research needs are identified, where appropriate.
When the available BoE suggests a positive association between iron intake and the risk of a disease/impaired function, a comprehensive UA is performed to inform the formulation of the hazard identification conclusions, i.e. judgement on the level of certainty for a causal relationship.
Evidence integration and conclusions on the prioritised subquestions, by study design
The OHAT‐NTP framework for the formulation of hazard identification conclusions is used and adapted (OHAT/NTP, 2019). The BoE on a particular sQ is given an initial level of certainty based on study design, which is assigned by considering four features of the design (i.e. exposure is experimentally controlled, exposure occurs prior to the endpoint, endpoint is assessed at individual level and an appropriate comparison group is included in the study). As a result, OHAT assigns a ‘high’ confidence rating to RCTs, a ‘moderate’ confidence rating to prospective observational studies and a ‘low’ confidence rating to case series/reports 4 (OHAT/NTP, 2019). In accordance with EFSA's Scientific Committee recommendation, probability has been used as the means for expressing uncertainty (EFSA Scientific Committee, 2018). Therefore, OHAT's ‘initial confidence ratings’ have been translated into ‘initial levels of certainty’ expressed as approximate probability ranges. Similarly, the final level of certainty for a positive/negative and causal relationship between the exposure and risk of disease/impaired function is expressed as probability ranges, corresponding to four levels of certainty, i.e. ‘high’ (> 75%–100% probability), ‘moderate’ (> 50%–75% probability), ‘low’ (> 15%–50% probability) and ‘very low’ (0%–15% probability). This standard four‐level probability scale facilitates the formulation of experts' judgement and is used for the formulation of hazard identification conclusions in nutrient risk assessments.
A schematic representation of the approach for assessing the final level of certainty in the hazard identification conclusions by study design is provided in Figure 2. This initial rating is downgraded on the basis of factors that decrease certainty in the results (RoB, unexplained inconsistency, indirectness or lack of applicability, imprecision and publication bias) and upgraded for factors that increase certainty in the results (large magnitude of effect, dose response, consistency across study designs/populations/animal models or species and consideration of residual confounding or other factors that increase the certainty in the causal nature of the relationship).
FIGURE 2.
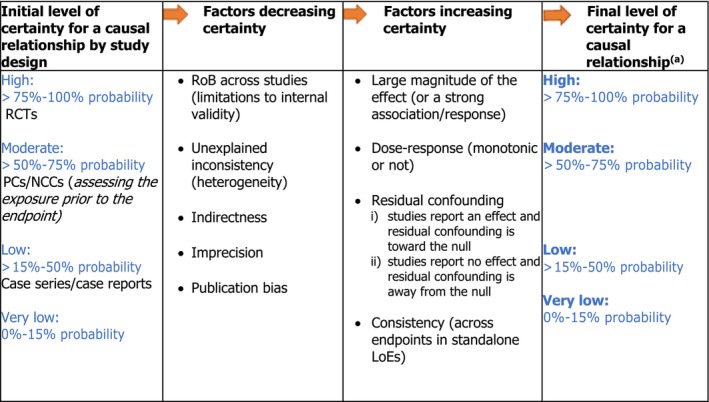
Approach applied to assign the final level of certainty in a causal relationship. Adapted from OHAT/NTP (2019). LoE, line of evidence; NCC, nested case‐control; PC, prospective cohort; RCT, randomised controlled trial; RoB, risk of bias. aAs an example, a 'high level of certainty' means that, based on the available evidence, experts are 75 to 100% certain that iron intake is positively and causally associated with the adverse health outcome of interest.
Reaching overall conclusions on the prioritised subquestions
Adapted from the OHAT‐NTP approach, the overall conclusion regarding the relationship is formulated as follows:
Hazard identification conclusions are primarily based on the BoE providing the highest level of certainty on the relationship;
Consistent results across study designs could result in higher level of certainty on the causality of a positive relationship;
Mechanistic or mode of action data are considered as other relevant supporting types of evidence; they could provide strong support or opposition for biological plausibility and could thus result in higher or lower certainty on the causality of the positive relationship.
It is noted that the formulation of hazard identification conclusions necessarily requires expert judgement. The value of this type of approach is that it involves using a reproducible and transparent framework for expressing uncertainty in the evidence and in the methods.
Formal uncertainty analyses are not conducted when the causal positive relationship between iron intake and the health effects is well established.
Hazard characterisation
At this step, evidence is integrated to select the critical effect(s) and identify a reference point (RP) for establishing the UL. As proposed in the draft guidance for establishing and applying ULs for vitamins and essential minerals (EFSA NDA Panel, 2022a), when available data are not suitable for dose–response modelling, a NOAEL or a LOAEL can be identified and used as the RP. To derive the UL, a UF is applied to the RP to account for the uncertainties associated with extrapolating from the observed data to the general population. ULs should be protective for all members of the general population, including sensitive individuals, throughout their lifetime.
2.3. Dietary intake assessment
The assessment follows the approach outlined in the protocol for the intake assessments performed in the context of the revision of ULs for selected nutrients (EFSA, 2022).
Briefly, the EFSA's food composition and food consumption databases were used to obtain harmonised iron intake estimates from the background diet in EU populations. Other data sources were used to gather non‐harmonised iron intake estimates from the background diet, fortified foods and food supplements, either alone or in combination, in European countries (i.e. intake estimates from nationally representative food consumption surveys), and data on the amounts of iron used for food fortification and in food supplements (i.e. Mintel GNPD).
2.3.1. Data
Intake data calculated by EFSA in 2015
Iron intakes for all population groups from foods, excluding food supplements, had previously been estimated in the context of the scientific opinion on dietary reference values (DRVs) for iron (Roe et al., 2013; EFSA NDA Panel, 2015). Food intake data from the EFSA Comprehensive European Food Consumption Database (hereinafter referred as Comprehensive Database) 5 and data on iron content in foods from the EFSA food composition database (FCDB) 6 were used. As the EFSA FCDB has not been updated since then and the number of national food consumption surveys that were newly integrated into the Comprehensive Database is limited, the intake estimates published in 2015 were not updated. They were used as published as the basis for the present assessment with the exception of data for infants aged < 1 year which were added, as these data were not published in 2015.
Regarding the use of iron‐containing supplements and of foods to which iron has been added for fortification purposes, data in the Comprehensive Database suffer from important limitations, in particular due to partial reporting in the database of the nutrient(s) contained in food supplements and fortified foods. In view of the uncertainties associated with these data, the Panel relied on information available at national level to inform its scientific assessment.
Other data sources
To complement EFSA's intake assessment from 2015, iron intake estimates from natural sources, from addition to foods and from food supplements based on nationally representative food consumption surveys and total diet studies (TDSs) conducted after 2015 were collected. Data on iron intakes from fortified foods and/or food supplements published before 2015 were also considered as the contribution of those sources was not addressed in EFSA's previous assessment. Data were collected between September and November 2021 by contacting 64 competent authorities in 37 European countries through EFSA Focal Points 7 and the EFSA Food Consumption Network. 8 An additional search in sources of bibliographic information (e.g. Google Scholar, PubMed) was performed to collect reports of national surveys reporting on nutrient consumption that had not been obtained through the competent authorities. Between August and October 2022, EFSA contacted all EU Member States and Norway through the European Commission WG on Food Supplements and Fortified Foods 9 and collected data specifically on the intake of iron from food supplements.
The Mintel Global New Products Database (GNPD) 10 was used as a data source to identify the type and content of iron‐containing food supplements and fortified foods available on the EU market. A search for food and drink products with iron in the ingredient list was performed, assuming that these were iron‐fortified products. To exclude food products in which iron is used as an additive (e.g. iron oxides as colour), the search was further refined to include only fortified foods in which iron was reported both in the ingredient list and in the nutrition declaration. Regarding the retrieval of food supplements, the search on the Mintel GNPD included products that reported ‘iron’ on their nutrition label under the ‘vitamins and dietary supplements’ Mintel category. The search was limited to the past five complete years, from September 2017 to September 2022. The Panel notes that this search allows to capture the products that were newly introduced on the market and the products for which the packaging was changed during that period. Therefore, the information collected is indicative and does not represent a comprehensive overview of the products available on the market.
2.3.2. Methodologies
EFSA's iron intake estimates were calculated by matching the food intake data from the Comprehensive Database and the data on iron content in foods from the EFSA FCDB as available in 2015 (EFSA NDA Panel, 2015) (Section 3.4.2 ). Data on intake estimates for infants (≥ 4 to < 12 months), which were not in the remit of the DRV Opinion from 2015, have been added to the present assessment. The methodology applied to estimated intakes in this population group is the same as for the other age groups.
Iron intake data from recent national food consumption surveys, including specific estimates of iron intake from food supplements and/or fortified foods, were extracted (Section 3.4.3 ).
Information on food products fortified with iron and iron‐containing supplements available on the EU market, and their iron content as reported on the label extracted from the Mintel GNPD (Section 3.4.1 ) were used qualitatively to describe the types of fortified foods and food supplements available and to gain insight into their potential contribution to total iron intake.
2.4. Public consultation
In line with EFSA's policy on openness and transparency, and for EFSA to receive comments from the scientific community and stakeholders, the draft Scientific Opinion was released for public consultation from 16 February to 1 April 2024. The outcome of the public consultation is described in a technical report published as Annex E to the final Scientific Opinion.
3. ASSESSMENT
3.1. Iron chemistry
Iron (atomic mass 55.85 Da, atomic number 26) is found in oxidation states from −2 to +6. In biological systems, it is mostly present in the ferrous (Fe2+) and ferric (Fe3+) states. Redox interconversions between the two states are central to its biological properties. Biologically, iron complexes with nitrogen, like in the porphyrin ring of haem, and with sulfur, forming iron–sulfur clusters. Iron is essential for oxygen transport (haemoglobin) and storage (myoglobin) and is involved in most pathways for energy and substrate metabolism. Haem enzymes are essential for redox reactions of numerous cytochromes, while iron–sulfur clusters are involved in mitochondrial energy metabolism and oxidoreductase activities. Iron is also a cofactor in various non‐haem‐containing enzymes (EFSA NDA Panel, 2004, 2015).
The present assessment is restricted to the forms that are naturally present in the diet and currently authorised for addition to foods 11 or food supplements 12 (Table 3). Dietary haem iron comes from natural sources only, in the form of haem proteins (mostly myoglobin and haemoglobin) in animal tissues. The most common sources of non‐haem iron naturally present in foods are low‐molecular‐weight compounds such as ferric citrate, phosphate, phytate, oxalate and hydroxide and some non‐haem iron proteins such as ferritin.
TABLE 3.
Forms of iron authorised as nutrient sources in the EU.
| Addition to foods Regulation (EC) No 1925/2006 | Food supplements Directive 2002/46/EC | |
|---|---|---|
| Ferrous bisglycinate | x | x |
| Ferrous carbonate | x | x |
| Ferrous citrate | x | x |
| Ferric ammonium citrate | x | x |
| Ferrous gluconate | x | x |
| Ferrous fumarate | x | x |
| Ferric sodium diphosphate | x | x |
| Ferrous lactate | x | x |
| Ferrous sulfate | x | x |
| Ferrous ammonium phosphate | x | x |
| Ferric sodium EDTA | x | x |
| Ferric diphosphate (ferric pyrophosphate) | x | x |
| Ferric saccharate | x | x |
| Elemental iron (carbonyl + electrolytic + hydrogen reduced) | x | x |
| Ferrous l‐pidolate | – | x |
| Ferrous phosphate | – | x |
| Iron (II) taurate | – | x |
Abbreviation: EDTA, ethylenediaminetetraacetic acid.
3.2. Absorption, distribution, metabolism and excretion (ADME)
Iron absorption occurs mainly in the duodenum and proximal small intestine. It involves the reduction of ferric iron (Fe3+) to ferrous iron (Fe2+), uptake of iron from the intestinal lumen into enterocytes, its transfer within enterocytes and its subsequent translocation across the basolateral membrane to carriers in the plasma of the portal circulation (EFSA NDA Panel, 2015). There are no pathways for active iron excretion. In humans, there are several processes which regulate iron supply to the body and distribution to tissues. The most important one in terms of preventing systemic iron overload is the tight control of iron absorption, which is mediated through the up‐ and down‐regulation of hepcidin from the liver. Iron recycling by macrophages and iron storage regulate the amount of iron that is available to tissues (Blanco‐Rojo & Vaquero, 2019; Ganz, 2013). Homeostatic regulation of iron absorption is absent in young infants and only starts developing between 6 and 9 months of age (Lönnerdal et al., 2015).
Galetti et al. (2021) pooled data from studies conducted between 1990 and 2020 on healthy young women free of inflammation who had consumed test meals with less than 16 mg total iron and in which a stable iron isotopic label was given as ferrous sulfate. A total of 1058 observations from 624 women from 24 studies conducted in five countries were included. It was observed that fractional iron absorption decreased from an average of 21.9–5.8% with increasing SF concentrations from an average of 1.0–51.1 mg/L. At SF concentrations > 51.1 mg/L, iron absorption remained stable at around 5.8%. These results were in line with the results when fractional iron absorption was related to hepcidin concentrations. Iron absorption decreased from an average of 33.2–7.2% with hepcidin concentrations increasing from 0 to 3.09 nmol/L. At higher hepcidin concentrations, fractional iron absorption remained stable.
The availability of iron for absorption depends on the iron oxidation state, solubility and strength of binding to constituents of the chyme in the duodenum and small intestine. Iron‐containing compounds used for fortification purposes have differing availabilities based on their solubility (Zimmermann & Hurrell, 2007) and the matrix to which they are added.
The main form of iron in the diet, ferric iron (Fe3+; oxidised iron), is insoluble at neutral or slightly basic pH and must be reduced to ferrous iron (Fe2+) (Ems et al., 2022; Piskin et al., 2022) by duodenal cytochrome b reductase (DcytB/ferric reductase), which is located on the luminal surface of the enterocytes (EFSA NDA Panel, 2015; McKie et al., 2001). In addition, non‐enzymatic reduction occurs. This process is facilitated by reducing agents such as ascorbate which are either supplied by the diet or secreted into the lumen (Lane et al., 2015).
After reduction by either DcytB or reducing agents, ferrous iron (Fe2+) is transported by transmembrane divalent metal transorter 1 (DMT1) across the apical membrane into the cytoplasm (EFSA NDA Panel, 2015; Gruenheid et al., 1995; Montalbetti et al., 2013).
The hypothesis that ferric iron (Fe3+) may also be absorbed from the lumen utilising β3‐integrin, mobilferrin and paraferritin after mobilisation from the food matrix in the stomach and subsequent chelation by mucins on the duodenal brush border surface (Umbreit et al., 1998) has not been confirmed using molecular techniques (Sharp & Srai, 2007).
Haem iron is absorbed more efficiently than non‐haem iron. Originally, a haem carrier protein (HCP1, synonym SLC46A1) was identified as mediating haem‐iron transport (Shayeghi et al., 2005), although it later emerged that it was primarily a folate transporter. The mechanism for haem iron uptake remains largely unclear and may occur by endocytosis (Gräsbeck et al., 1979). Experiments using labelled iron suggest that the absorption pathway of haem iron is saturable (Etcheverry et al., 2007; Pizarro et al., 2003). Haem iron taken up by enterocytes is catabolised by haem oxygenase to release ferrous iron (Rosenberg & Kappas, 1989). While absorption pathways differ between haem and non‐haem iron, they reach (or integrate in) the same intracellular pool (Sharp & Srai, 2007).
The third main form of dietary iron is ferritin, present in some animal products such as liver, but also present in certain plant foods, such as legumes. Investigations with enterocyte‐like cell lines suggest that iron bound to ferritin can be absorbed by receptor‐mediated endocytosis, but the pathways are poorly understood (Chang et al., 2023).
In the enterocytes, ferrous iron (Fe2+) can be (1) transferred to ferroportin 1, a transmembrane basal transporter, for translocation out of the enterocyte, (2) stored within the enterocyte in ferritin or (3) taken up into the mitochondria for haem synthesis (EFSA NDA Panel, 2015). If body iron stores are replete, iron will be increasingly retained in enterocytes. At the end of the lifecycle of the enterocytes (approximately 3–4 days), these will be shed into the lumen whereby intracellular ferritin iron is lost (Sharp & Srai, 2007).
Transport across the basolateral membrane by ferroportin requires the ferrous iron (Fe2+) to be oxidised to ferric iron (Fe3+). This is mediated by hephaestin, which is a copper‐dependent ferroxidase. Ferric iron (Fe3+) is then transferred to apotransferrin for transport to the liver and systemic circulation. The systemic turnover of iron is controlled by the liver with hepcidin playing a key role, being the sensor of systemic requirements for iron and regulating the intestinal absorption of iron and its distribution to peripheral organs and tissues (EFSA NDA Panel, 2015; Frazer & Anderson, 2003). When adequate iron stores are reached, a variety of mechanisms reduce absorption across the gut (Canavesi et al., 2012; Duck & Connor, 2016; Olynyk & Ramm, 2022; Sharp & Srai, 2007). Iron balance mechanisms also exist at the cellular level (Yiannikourides & Latunde‐Dada, 2019).
Transferrin is the carrier of iron in the extracellular space and systemic circulation and delivers iron to the target tissues (Ganz, 2013). Iron‐loaded transferrin binding to the transferrin receptor (TfR) on cell membranes is endocytosed. In the endosome, iron is released, reduced to the ferrous form (Fe2+) by a ferrireductase and transferred out of the endosome into the cytoplasm by DMT1. In the cytoplasm, it forms a chelatable iron pool, which supplies iron for metabolic needs, including iron uptake by the mitochondria for haem and iron–sulfur cluster synthesis. The apotransferrin and TfR proteins return to the cell surface and apotransferrin is recycled into the plasma (EFSA NDA Panel, 2015; Richardson et al., 2010; Zhang et al., 2014).
Systemic iron homeostasis is also controlled by sensory and regulatory systems which influence cellular processes which act on hepcidin and ferroportin (Galy et al., 2024).
The body of adult females and males contains around 2.3–2.8 g and 3.8–4.4 g of iron, respectively, corresponding to about 48–50 mg/kg body weight for males and 38–42 mg/kg body weight for females (EFSA NDA Panel, 2015).
Most of the iron in the body is present as haem iron and in erythroid bone marrow (60%–80%) (Cook et al., 1973; Tandara & Salamunic, 2012). Around 10%–15% is found in myoglobin in muscle fibres. Iron that is not actively involved in metabolism is deposited as ferritin and, to a lesser extent, as ferritin‐derived haemosiderin, mainly in the parenchymal cells and reticuloendothelial macrophages in the liver (Singh et al., 2014). The amount of ferritin found in the systemic circulation is small compared to the quantity stored in the liver (Tandara & Salamunic, 2012).
With increasing iron load in the body, relatively more iron is stored as haemosiderin, and both ferritin and haemosiderin can accumulate in the body (Yiannikourides & Latunde‐Dada, 2019).
The Panel notes that iron homeostasis is primarily controlled by the regulation of iron absorption in the intestine. Any iron that is not immediately used is stored as ferritin and haemosiderin in the liver and macrophages.
3.2.1. Factors influencing iron absorption
3.2.1.1. Age
As described in Section 3.2 , homeostatic regulation of iron absorption is absent in young infants. It develops between 6 and 9 months of age and is present at 9 months of age (Lönnerdal et al., 2015).
3.2.1.2. Other physiological factors
As reviewed in Section 3.2 , hepcidin downregulates iron absorption and the mobilisation of iron from stores (Blanco‐Rojo & Vaquero, 2019). Hepcidin is upregulated when iron stores become replete. Inflammatory cytokines also increase hepcidin expression and downregulate iron absorption through this mechanism. Hepcidin expression is downregulated (and iron absorption upregulated) by, among others, an increased erythropoiesis triggered by anaemia and/or hypoxia, and testosterone (Camaschella et al., 2020). Therefore, in individuals with low iron status, absorption is higher than in iron‐replete individuals.
3.2.1.3. Dietary factors
The composition of the diet is one of the main factors influencing non‐haem iron absorption. A number of dietary constituents act as either inhibitors [e.g. inositol hexa‐ and penta‐phosphates (phytate), polyphenols such as in tea, coffee, cocoa, red wine, vegetables, as well as calcium and zinc] or enhancers (e.g. ascorbic acid and animal muscle proteins). Inhibitors form complexes with iron in the digestive chyme in the gut lumen. The strength of binding dictates whether or not iron can be removed from the complex by DMT1. Ascorbic acid reduces ferric iron (Fe3+) to ferrous iron (Fe2+) and can enhance non‐haem iron absorption in a dose‐dependent manner (EFSA NDA Panel, 2015; Piskin et al., 2022). Animal muscle proteins can also increase non‐haem iron absorption, but the mechanisms are not fully elucidated. The absorption of haem iron is little influenced by the diet but can be inhibited by the presence of calcium (Piskin et al., 2022).
3.2.1.4. Form of iron compounds
As discussed above (Section 3.2 ), the availability of iron for absorption depends on its chemical form and solubility in the GI tract. Also, different pathways are involved in the absorption of ferrous iron vs. haem iron, resulting in a more efficient absorption of the latter. Among the forms which are authorised for addition to foods or food supplements in the EU (i.e. iron salts and elemental iron, see Table 3), iron from ferrous sulfate is generally better absorbed than from other forms. However, the bioavailability of iron from the different iron forms is influenced by the nutritional status of the individual consuming it (Section 3.2.1.2 ), as well as the food matrix or other components of the diet that are consumed together with iron (Section 3.2.1.3 ). Therefore, it is not possible to accurately and uniformly rank the different iron forms with respect to their bioavailability.
3.2.2. Factors influencing sensitivity to systemic iron overload
3.2.2.1. Polymorphisms
Mutations in the human homeostatic iron regulator (HFE) protein gene can cause hereditary haemochromatosis which mostly affects individuals of northern European descent. This disease is characterised by impaired sensing of iron storage and an insufficient production of hepcidin leading to an insufficient downregulation of iron absorption in iron‐replete states, resulting in excess systemic iron accumulation ultimately with the potential to result in iron‐induced organ toxicity. Liver disease (advanced liver fibrosis or cirrhosis and primary liver cancer) and arthritis are the most frequently observed manifestations of hereditary haemochromatosis (Olynyk & Ramm, 2022). Hereditary haemochromatosis is also associated with an increased risk of cardiomyopathy and diabetes mellitus, with loss of insulin secretory capacity being a key pathogenic feature (Creighton Mitchell & McClain, 2014; Harrison et al., 2023). The most common mutation is the 845G → A substitution (C282Y). Homozygosity for C282Y is typically associated with haemochromatosis while heterozygosity is usually only accompanied with a slight increase in iron concentrations in the blood and liver. Haemochromatosis in heterozygous individuals is rare (Adams et al., 2023; EASL, 2022). The prevalence of homozygosity for C282Y ranges from 1:83 (around 1.25%) in Ireland to < 1:2500 in southern Europe (0.04%) (EASL, 2010, 2022). Haemochromatosis occurs in an estimated 1:150 individuals (around 0.7%) of north‐western European descent (Grosse et al., 2018), with > 80% attributable to homozygosity for C282Y (EASL, 2022).
Hereditary haemochromatosis has to be distinguished from iron overload syndrome which has no genetic origin and can be caused, for example, by multiple blood transfusions or by long‐term very high supplemental iron intakes.
The panel notes that patients with haemochromatosis are a population group particularly sensitive to systemic iron overload. They are managed through medical care and are not the target of a UL for iron aimed at the general population.
3.2.2.2. Sex
Requirements for iron differ between men and women due to their differences in body size and due to menstrual losses in women (EFSA NDA Panel, 2004). The loss of iron through menstrual blood, although variable, makes iron accumulation slower for women.
There has been increasing interest in studying the sex‐specific differences of iron metabolism and dyshomeostasis (Das et al., 2017; Gabrielsen et al., 2018; Grubić Kezele & Ćurko‐Cofek, 2020; Yu et al., 2019); however, strong evidence for such differences is still lacking.
3.3. Biomarkers of intake and status
There are no reliable biomarkers of iron intake (EFSA NDA Panel, 2015). Several biomarkers of iron status have been proposed and those which could potentially give an indication of body burden and the risk of systemic iron overload are reviewed in the following.
3.3.1. Serum ferritin
SF is an indicator of body ferritin which is a protein that can bind and release iron in a controlled manner and can serve as an iron depot. SF reflects only a small amount of body ferritin (Saito, 2014; Walters et al., 1973) and may be elevated by factors that are independent of the body iron. In particular, given that SF is an acute phase protein, it may be influenced by many conditions, and may not provide an accurate estimate of body ferritin in acute or chronic inflammation, infection or tissue damage. Also, there is considerable variation in SF concentrations in response to age, ethnic origin, sex and blood volume, for example, in pregnancy (Cullis et al., 2018).
Several thresholds of SF concentrations have been proposed that could illustrate the upper range of normal for individuals with different diseases and which could be indicative of systemic iron overload in individuals suffering from the investigated diseases, as reviewed by Parlesak et al. (2024).
A recent consensus statement on the definition and classification of metabolic hyperferritinaemia (Valenti et al., 2023) proposed, as diagnostic criteria for metabolic hyperferritinaemia, the use of SF concentrations of > 300 μg/L in men and > 200 μg/L in women in combination with one or more indicators of altered metabolism (e.g. overweight, T2DM, hypertension, fatty liver, insulin resistance).
In their recommendations issued in 2012, the Nordic Council of Ministers (2014) considered SF concentrations above 300 μg/L to indicate ‘biochemical iron overload’ if SF concentrations were caused by dietary intake and not by other factors such as inflammation.
The WHO (2020) proposed that SF > 150 μg/L in healthy menstruating women, > 200 μg/L in healthy men and non‐menstruating women and > 500 μg/L in non‐healthy individuals may indicate systemic iron overload, but also noted that SF concentrations should not be used alone to identify risk of systemic iron overload.
A Cochrane systematic review, aimed at investigating the accuracy of SF concentrations as a measure or systemic iron overload (Garcia‐Casal et al., 2021), identified 36 studies, all of which were in patients, and found that mean SF concentrations in groups of patients with no systemic iron overload (as measured by iron concentrations in the liver), ranged from 220 to 1244 μg/L while in patients with systemic iron overload, these values ranged from 493 to 1671 μ/L. Large differences were observed between the different diseases studied and within groups in the individual studies. The authors concluded that it is unlikely that a single SF threshold could discriminate with high accuracy between individuals with and without systemic iron overload (in the diseased populations studied).
The Panel notes that cut‐off values for SF concentrations have been proposed to be indicative of systemic iron overload. However, they are proposed to be interpreted in conjunction with disease states or markers of metabolic dysfunction and cannot be used in isolation as markers of systemic iron overload, particularly in healthy individuals.
In subquestion 2b of the systematic review, the contractor (Parlesak et al., 2024) investigated whether a dose–response relationship between iron intake and SF concentration in healthy adults could be established and whether an equation could be created to derive dietary intakes based on SF concentrations. For this purpose, the contractor had systematically searched for RCTs in healthy adults, both iron deficient and iron sufficient, which reported on oral iron intake from all sources, with repeated administration for at least 4 weeks and in which duplicate portion techniques or validated tools were used to assess dietary background iron exposure.
In total, 14 RCTs were retrieved which complied with the criteria set out in the protocol (Parlesak et al., 2024). The highest mean SF concentrations at the end of the respective studies was 66 μg/L which was far lower than the SF concentrations proposed to be related to systemic iron overload. In addition, the equation best fitting the data was not only influenced by supplemental and background iron intake but also by SF before starting iron supplementation, body mass index (BMI), age and sex (Parlesak et al., 2024). Therefore, this assessment subquestion was not further pursued by the Panel.
3.3.2. Total iron binding capacity
TIBC reflects the maximum concentration of iron that can be bound to transferrin and is an indirect measure of transferrin (Kundrapu & Noguez, 2018). With increasing body iron, the quantity of free transferrin in blood decreases and TIBC values decrease (Faruqi & Mukkamalla, 2023).
3.3.3. Transferrin saturation
TSAT is derived from TIBC. An increase of TSAT is the first biochemical manifestation of haemochromatosis, reflecting an uncontrolled influx of iron from enterocytes and macrophages into the bloodstream (Fitzsimons et al., 2018). A TSAT exceeding 40% usually indicates ‘systemic iron overload’ (Gattermann et al., 2021). In cases where elevated SF is due to factors other than iron status, TSAT will not be raised. Therefore, when TSAT is within the normal range, high SF concentrations are likely not to be caused by ‘systemic iron overload’. The only exception is when ‘systemic iron overload’ co‐exists with an inflammatory syndrome. Therefore, the analysis of high‐sensitivity C‐reactive protein ((hs)CRP) alongside TSAT has been suggested. Increased TSAT may, however, also be found in conditions other than ‘systemic iron overload’, such as pronounced cytolysis (e.g. acute hepatitis) (Muñoz et al., 2011).
3.3.4. Soluble transferrin receptor to ferritin ratio
The ratio between sTfR and log ferritin is a marker that reflects functional iron and its stores but considering the lack of reference methods for the analysis of sTfR, its value will depend on the analytical method applied (Restrepo‐Gallego et al., 2021). Therefore, its usefulness for assessing ‘systemic iron overload’ is limited.
3.4. Intake assessment
3.4.1. Sources of dietary iron
3.4.1.1. Natural sources
Meat, fish, cereals, beans, nuts, egg yolks, dark green vegetables and potatoes are the richest natural food sources of iron, while dairy products and many fruits and vegetables do not contain appreciable amounts of iron. The forms of iron differ across sources and mostly consist of haem iron in animal flesh (i.e. meat, poultry and seafood) and non‐haem iron in plant‐based foods. Mixed (non‐vegetarian) diets provide about 90% of the dietary iron as non‐haem iron (Jakszyn et al., 2013; Milman, 2011), the remainder being haem iron. Thus, ferric salts naturally present in foods represent the largest part of total iron intake from natural sources. Some animal and plant foods also contain non‐haem iron proteins (e.g. ferritin), particularly liver and legume seeds, but this makes only a small contribution. The haem iron content of meat, relative to total iron, varies considerably (figures between 20% and 70% have been reported, depending on the meat type) (Balder et al., 2006; Cross et al., 2012). Small amounts of haem iron are also present in some plants and fungi.
3.4.1.2. Fortified foods and food supplements
The Mintel GNPD was used to extract information about fortified food and food supplements on the EU market (Section 2.3 ).
In the EU, authorised forms of iron for addition to foods and food supplements are depicted in Table 3. EU legislation sets minimum and maximum content of iron in infant and follow‐on formulae, 13 and in baby foods and processed cereal‐based foods for infants and children. 14
Fortified foods
In the Mintel GNPD, a total of 3824 packaged food products were identified as containing added iron. Only 31% (n = 1180) of the products had available data on content per serving. Among these, the Mintel categories with most products captured were ‘baby foods’, which included infant and follow‐on, and young‐child formulae (n = 878, median = 0.86 mg/100 g), baby cereals (n = 219, median = 7.5 mg/100 g) and other baby foods such as biscuits, yogurts, desserts, juices and snacks (n = 92, median = 4.9 mg/100 g). The category with the second highest number of products included ‘breakfast cereals’ (n = 650, median = 2.9 mg/serving). The highest iron content reported on the label was found in eight meal replacement drinks in powder form (17–18 mg/serving), and five soups in powder form (17 mg/serving), under the category ‘nutritional drinks and other beverages’.
Food supplements
In the Mintel GNPD, a total of 1055 food supplements were retrieved. The dose reported on labels was available for 754 products, with a median of 10 mg iron per serving. 15 About 29% of food supplements had a dose ≤ 5 mg of iron per serving, about 70% contained > 5–15 mg/serving [36%–107% nutrient reference value (NRV) 16 ] and only about 1% (n = 6) had doses > 45 mg per serving (Figure 3), which included two products with 50 mg iron per serving.
FIGURE 3.
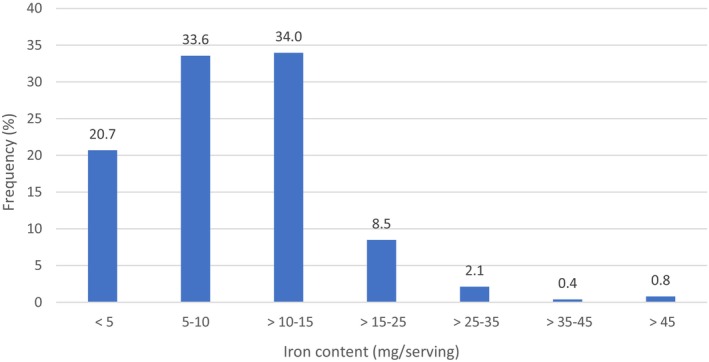
Distribution of iron content in food supplements as displayed on labels in EU Member States and Norway (mg/serving). Source: Mintel GNPD. Search for iron‐containing supplements available in the EU market from December 2017 to December 2022. A total of 1055 products available in 24 EU Member States and Norway were identified, of which 754 contained complete data on mg iron/serving.
There were around 300 additional food supplements containing ingredients naturally containing iron, such as herbal powders, bee pollen, hemp seeds or chia seeds. The iron content per serving was available for half of the products and ranged between 0.1 and 15 mg. The products with the highest content of iron per serving included preparations of curry leaf extracts, and algae powders (spirulina and chlorella algae).
3.4.2. EFSA's intake assessment
Iron intakes from food sources (excluding food supplements) in European populations were calculated in the context of the scientific opinion on DRVs for iron (EFSA NDA Panel, 2015), based on the data from the EFSA Comprehensive Database and the EFSA FCDB. Food consumption surveys of Finland, France, Germany, Ireland, Italy, Latvia, the Netherlands and Sweden were used for the assessment. The period of data collection covered by the surveys was from 2000 to 2012. Further information on the characteristics and methods used for the data collection in the respective surveys are provided in Annex B.
Food composition data from Finland, France, Germany, Italy, the Netherlands and Sweden were used to calculate iron intake in these countries. For nutrient intake estimates of Ireland and Latvia, food composition data from the UK and Germany, respectively, were used, because no specific composition data from these countries were available. The percentage of iron values in the composition databases that were borrowed from other composition databases varied between 15% and 85%.
The intake assessment of 2015 did not distinguish between iron ‘naturally present’ or ‘added’ to foods by manufacturers. As data on the consumption of foods fortified with iron available in the Comprehensive Database 17 and on the concentration of iron in fortified foods available in the EFSA FCDB are scarce, EFSA's intake estimates can be considered to reflect iron intake from natural sources.
The distributions of iron intakes estimated by EFSA are presented below by age group, sex and country of origin (Figures 4 and 5). A summary overview providing the ranges of means and 95th percentiles (P95) across EU surveys is given in Table 4.
FIGURE 4.
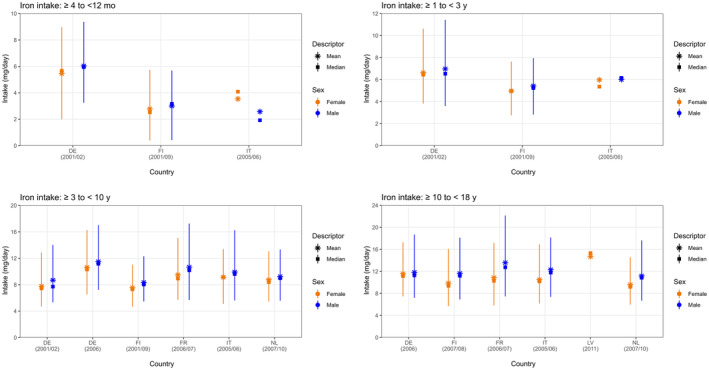
Mean, median, 5th and 95th percentiles of iron intakes in infants (≥ 4 to < 12 months old), toddlers (≥ 1 year to < 3 years old), other children (≥ 3 years to < 10 years old) and adolescents (≥ 10 years to < 18 years old), by sex and country. Estimates for females in orange and for males in blue. Squares correspond to medians and stars to means. Lines represent the range between the 5th and 95th percentiles. Estimated intakes from 5th and 95th percentiles are not presented when sample size is below 60 participants. DE, Germany; FI, Finland; FR, France; IT, Italy; LV, Latvia; NL, The Netherlands. Source: (EFSA NDA Panel, 2015) except for infants.
FIGURE 5.
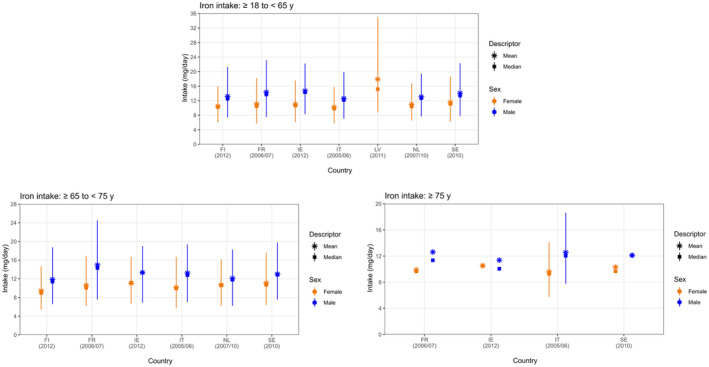
Mean, median, 5th and 95th percentiles of iron intakes in adults (≥ 18 to < 65 years old) and elderly as well as very elderly (≥ 65 to < 75 years old, and ≥ 75 years old), by sex and country. Estimates for females in orange and for males in blue. Squares correspond to medians and stars to means. Lines represent the range between the 5th and 95th percentiles. Estimated intakes from 5th and 95th percentiles are not presented when sample size is below 60 participants. FI, Finland; FR, France; IE, Ireland; IT, Italy; LV, Latvia; NL, The Netherlands; SE, Sweden. Source: (EFSA NDA Panel, 2015).
TABLE 4.
Minimum and maximum mean values and 95th percentiles of daily iron intake from food sources (supplements excluded) across European dietary surveys by population group and sex.
| Population group, age range | N of surveys | Iron (mg/day) | |||||||
|---|---|---|---|---|---|---|---|---|---|
| Males | Females | ||||||||
| Mean | P95 a | Mean | P95 a | ||||||
| Min b | Max b | Min b | Max b | Min b | Max b | Min b | Max b | ||
| Infants, ≥ 4 to < 12 months | 3 | 2.6 | 6.0 | 5.7 | 9.4 | 2.8 | 5.5 | 5.7 | 9.0 |
| Toddlers, ≥ 1 to < 3 years | 3 | 5.4 | 7.0 | 7.9 | 11.4 | 5.0 | 6.6 | 7.6 | 10.6 |
| Other children, ≥ 3 to < 10 years | 6 | 8.3 | 11.5 | 12.3 | 17.3 | 7.5 | 10.6 | 11.0 | 16.3 |
| Adolescents, ≥ 10 to < 18 years | 5 | 11.2 | 13.6 | 17.6 | 22.2 | 9.6 | 11.6 | 14.6 | 17.3 |
| Adults, ≥ 18 to < 65 years | 6 | 12.6 | 14.7 | 19.4 | 23.1 | 10.2 | 11.6 | 15.8 | 18.6 |
| Elderly, ≥ 65 to < 75 years | 6 | 11.9 | 15.0 | 18.3 | 24.5 | 9.4 | 11.1 | 14.7 | 17.6 |
| Very elderly, ≥ 75 years | 4 | 11.4 | 12.6 | 18.6 c | 18.6 c | 9.6 | 10.5 | 14.1 c | 14.1 c |
| Pregnant women | 1 | 14.7 | 17.9 | 34.9 c | 34.9 c | ||||
Source: (EFSA NDA Panel, 2015), except for infants.
Abbreviations: N, number; P, percentile.
The 95th percentile estimates obtained from dietary surveys and population groups with fewer than 60 subjects may not be statistically robust (EFSA, 2011) and consequently are not considered in this table.
Minimum and maximum mean and 95th percentile estimates across European surveys, for each population group.
Calculated from one survey only.
3.4.2.1. Main food contributors
The main food groups contributing to iron intake were ‘meat and meat products’, ‘cereals and similar’, ‘bread and similar products’ in all population groups except infants, for whom products belonging to the FoodEx2 food group ‘food for infants and young children’ were the major contributors. Differences in main contributors to iron intake between genders were in most cases minor (EFSA NDA Panel, 2015) (Annex B).
3.4.3. Complementary information from national reports
Data on iron intake from food, including fortified foods and food supplements, were collected from nationally representative consumption surveys (Section 2.3.1 ). Survey characteristics, mean and P95 intake estimates are presented in Annex C. Key information is summarised in the following paragraphs.
3.4.3.1. Data on iron intake excluding food supplements
There is no mandatory iron fortification policy among EU countries. Iron may be added to foods voluntarily. Consumption of foods fortified with iron is only recommended by a few countries, mainly targeting children (breakfast cereals) or individuals following vegan diets (European Commission, 2023, unpublished).
Estimates of iron intake from foods, including fortified foods, are available for 30 dietary surveys conducted in 20 European countries: Austria, Belgium, Bulgaria, Denmark, Estonia, Finland, France, Germany, Greece, Hungary, Iceland, Ireland, Latvia, Lithuania, the Netherlands, Norway, Slovenia, Spain, Sweden and Serbia. The survey characteristics and intake estimates are provided in Annex C.
Most of the survey reports did not distinguish between iron intakes from natural sources and intake resulting from addition of iron to foods.
Only one publication provided an analysis of the iron intake among consumers of foods which were voluntarily fortified with iron as compared to non‐consumers. Based on the results of the Dutch National Food Consumption Survey (DNFCS 2012–2016), de Jong et al. (2022) found that habitual iron intakes were statistically significantly higher in users of iron fortified foods (median (P5–P95): 9 (6–13) mg/day for boys, 8 (5–12) mg/day for girls) as compared to non‐users (median (P5–P95): 8 (4–12) mg/day for boys, 7 (4–10) mg/day for girls) in the survey population aged 1–17 years. In adults, no statistically significant differences were observed. Across all population groups (1–79 years), median iron intakes were 4% higher in users as compared to non‐users and the median (P5–P95) contribution from fortified foods to the total intake was 23% (4%–48%).
The highest P95 intake values in male children from foods including fortified foods were reported in Spain for infants (< 1 years, 21 mg/day), toddlers (> 1 to ≤ 3 years, 17 mg/day) and children (> 3 to ≤ 10 years, 15 mg/day) and in Germany for adolescents (> 10 to ≤ 17 years, 24 mg/day). For adult males (> 18 years), the highest P95 values were reported in Ireland (25 mg/day). Estimated intakes for females were generally lower than for males in all studies and age groups.
Intake estimates from total diet studies
Data on iron intake from food including fortified foods were also available from two TDSs conducted in the Czech Republic (Státní zdravotní ústav, 2021) and in Italy (Cubadda, 2021) (Annex C). In these studies, estimated intakes across age groups tended to be lower than values calculated based on the results of national surveys.
In the Italian TDS, higher intakes were found in males than in females: 15 mg/day in children (> 3 to < 10 years), 16 mg/day in adolescents (> 10 to < 18 years), 15 mg/day in adults (> 18 years). In the toddler group, females had higher P95 intakes than males (10 mg/day).
In the Czech TDS, data in young children have not been calculated. Intakes at the P95 were up to 12 mg/day in children (7–10 years, males and females combined), up to 17 mg/day in male adolescents (11–14 years) and up to 14 mg/day in male adults (18 to < 69 years).
3.4.3.2. Data on iron intake from food supplements
Only a few countries in the EU have reported to have recommendations for routine iron supplementations during pregnancy in place. Other recommendations exist for infants eating a vegetarian diet during weaning, for pre‐term infants and infants with low birth weight or for individuals following vegan diets (European Commission, 2023, unpublished).
A total of 18 dietary surveys conducted in 11 countries (Belgium, Denmark, Estonia, Finland, Germany, Ireland, the Netherlands, Norway, Poland, Portugal and Sweden) reported information on iron supplementation in whole survey populations or in a cohort of supplement users only. Survey characteristics and intake estimates are presented in Annex C.
Among users between 1 and < 18 years of age, absolute iron intakes from food supplements in high consumers (P95) have been calculated in three countries, and ranged from 7 mg/day in children (5–12 years, males and females combined) in Ireland to 14.6 mg/day in male adolescents (10–14 years) in the Netherlands (Table 5).
TABLE 5.
Percent iron supplement users in EU surveys and iron intake from food supplements among users (toddlers, children and adolescents).
| Country survey name (N subjects) reference | Dietary method (N of days) | Sex | Age range | % iron supplement users in total survey sample/among supplements users | Absolute iron intakes from Supplements, P95 (mg/day) | % contribution of supplements to iron intake, mean |
|---|---|---|---|---|---|---|
|
Denmark DANSDA 2011–2013 (n = 3936) (Hindborg, 2015, Unpublished) |
Face‐to‐face interview |
m + f m f |
4–10 years 11–17 years 11–17 years |
60 a /NR 46 a /NR 42 a /NR |
NR |
38 27 35 |
|
Germany EsKiMo II 2015–2017 (n = 2644) (Perlitz et al., 2019) |
Short questionnaire + weighing logs | m + f |
6–11 years 12–17 years |
NR/NR 3.9/24.1 |
NR | NR |
|
Ireland NPNS 2011–2012 (n = 500) NCFS II 2017–2018 (n = 600) NTFS II 2019–2020 (n = 428) (Kehoe & Walton, 2022) |
Weighted food diary (4 days) | m + f |
1–4 years 5–12 years 13–18 years |
5.8/27.1 6.3/28.8 5.3/37.6 |
10 7.1 13.4 |
9.7 7.8 12.2 |
|
Netherlands DNFCS 2012–2016 (n = 4313) (Van Rossum et al., 2022) |
Questionnaire (online/paper) | m + f |
1–3 years 3–10 years 10–14 years 14–18 years |
m 12/14 f 14/16 m 19/34 f 20/33 m 12/31 f 15/32 m 8/24 f 8/20 |
m 2.8/ f 4.2 m 9.6/ f 4.9 m 14.6/ f 12.2 m 11.9/ f 14.2 |
NR |
|
Norway Småbarnskost 2007 (2 years, n = 1674) Ungkost 32,016 (4 years, n = 399) Ungkost 32,015 (9 years, n = 636) Ungkost 32,015 (13 years, n = 687) (VKM, 2017) |
FFQ + food diary +24‐h dietary interviews |
m + f |
2 years 4 years 9 years 13 years |
5/NR 4/NR 2/NR 4/NR |
Mean 6.6 7.3 6.1 7.4 |
NA |
Abbreviations: DANSDA, The Danish National Survey of Diet and Physical Activity; DNFCS, Dutch National Food Consumption Survey; EsKiMo, Eating study as a KiGGS Module; f, females; FFQ, food frequency questionnaire; m, males; N, number; NA, cannot be calculated; NCFS, National Children's Food Survey; NPNS, National Pre‐School Nutrition Survey; NR, not reported in the publication, NTFS, National Teen's Food Consumption Survey; P95: 95th percentile; SD, standard deviation; VKM, Vitenskapskomiteen for mat og miljø [Norwegian Scientific Committee for Food and Environment].
% users of multivitamin/mineral supplements. By default, multivitamin/mineral supplements were considered to contain iron based on Danish households purchases data.
Among adults, absolute iron intakes in high consumers (P95) from food supplements were up to about 35 mg/day in the majority of countries and age groups. An exception were data from female adults in Norway and adults in Ireland (sex‐aggregated results), with mean absolute intakes from supplements only of 100 mg/day (Table 6). These high values may be explained by the availability in the market of supplements with very high recommended daily doses of iron (e.g. 100 or 105 mg/day in Ireland). Among the countries which calculated iron intake in supplements users only, the intake from all sources was available from the national reports for Denmark, Finland and Germany. Daily total intakes in high iron supplement consumers (P95 for adult males and females) were calculated only in Denmark (26–39 mg/day) and Germany (33–44 mg/day).
TABLE 6.
Percent iron supplement users in EU surveys and iron intake from food supplements among users (adults and older adults).
| Country survey name (N subjects) reference | Dietary method (N of days) | Sex | Age range | % iron supplement users in total survey sample/among supplements users | Absolute iron intakes from supplements, P95 (mg/day) | % contribution of supplements to iron intake, mean |
|---|---|---|---|---|---|---|
|
Denmark DANSDA 2011–2013 (n = 3936) (Hindborg, 2015, Unpublished) |
Face‐to‐face interview |
m f m f |
18–50 years 18–50 years 51–75 years 51–75 years |
42 a /NR 52 a /NR 43 a /NR 54 a /NR |
NR |
24 33 28 38 |
|
Finland FINDIET 2017 (n = 1655) (Valsta et al., 2018) |
FPQ |
m f |
18–74 yeaes |
10/NR 14/NR |
Mean 6.1 9.5 |
35.9 45.2 |
|
Germany NVS II 2005–2007 (n = 13,753) (Heuer et al., 2012) |
24‐h recall (2 days) |
m f |
15–80 years |
4.1/NR 6.0/NR |
10 32 |
15.8 17.9 |
|
Ireland NANS 2008–2010 (n = 1500) (Kehoe & Walton, 2022) |
Weighted food diary (4 days) | m + f |
18–64 years 65–91 years |
9.1/30.6 11.1/29.4 |
26.3 100 |
13.7 14.8 |
|
Netherlands DNFCS 2012–2016 (n = 4313) (Van Rossum et al., 2022) |
Questionnaire (online/paper) | m + f |
18–65 years 65–80 years |
m 13/36 f 19/34 m 12/35 f 19/32 |
m 24.0/f 17.9 m 19.5/f 22.4 |
NR |
|
Norway |
FFQ + food diary +24‐h dietary interviews | m + f | 18–70 years | 12/NR |
m 34.7 f 100 |
NA |
|
Poland National Dietary Survey 2019–2020 (n = 1831) (Stos et al., 2021) |
FPQ |
m f |
18–65+ years | NR/NR |
Mean ± SD (range) 7.1 ± 4.2 (2.1–14) 12.2 ± 16.3 (1–56) |
NA |
Abbreviations: DANSDA, The Danish National Survey of Diet and Physical Activity; DNFCS, Dutch National Food Consumption Survey; f, females; FINDIET, The Finnish National Dietary Survey in Adults and Elderly; FFQ; food frequency questionnaire; FPQ, food propensity questionnaire; m, males; N, number; NA, cannot be calculated; NANS, National Adult Nutrition Survey; NR, not reported in the publication; NVS II, Nationale Verzehrsstudie II [National Consumption Study II]; P95: 95th percentile; SD, standard deviation; VKM, Vitenskapskomiteen for mat og miljø [Norwegian Scientific Committee for Food and Environment].
% users of multivitamin/mineral supplements. By default, multivitamin/mineral supplements were considered to contain iron based on Danish households purchases data.
3.4.4. Overall conclusions on intake data
The Panel notes that the P95 estimated background intake of iron from natural food sources (excluding food supplements) in males across surveys included in EFSA's intake assessment is up to 9.4 mg/day in infants (≥ 4 to < 12 months), up to 11.4 mg/day in toddlers (≥ 1 to < 3 years), up to 17.3 mg/day in children (≥ 3 to < 10 years), up to 22.2 mg/day in adolescents (≥ 10 to < 18 years), up to 23.1 mg/day in adults (≥ 18 to < 65 years), up to 24.5 mg/day in older adults (≥ 65) and up to 34.9 mg/day in pregnant women (Table 4) (Annex B). Intakes are lower in non‐pregnant females, mainly due to smaller quantities of food consumed per day.
Iron may be added to foods, but it is not mandatory in any of the EU countries. In some of them, it is recommended that specific population groups (e.g. children) or individuals following vegan diets consume iron fortified foods (European Commission, 2023, unpublished). According to the Mintel GNPD, products belonging to its category ‘breakfast cereals’ (second highest in terms of products fortified with iron after the category ‘baby foods’) have a median iron content per serving of 2.9 mg.
With respect to iron‐containing food supplements, a search in the Mintel GNPD indicated substantial variability in the dose per serving across food supplements, with most values between 5 and 15 mg iron (36%–107% of the NRV) and about 1% of products with values > 45 mg (maximum 100 mg) per serving (357%–714% of the NRV). A few EU countries have policies in place advising daily iron supplementation for pregnant women, infants fed a vegetarian diet during weaning, pre‐term or low birth weight infants or individuals following a vegan diet (one country only).
The Panel notes that estimates of the contribution of fortified foods and food supplements to iron intake in EU populations are scarce. The Panel notes that in regular consumers of iron‐containing food supplements, the contribution of supplements to total iron intake can be substantial.
3.5. Hazard identification
3.5.1. Liver toxicity
The adverse effects of systemic iron overload on the liver are well known (EASL, 2022). Persistent systemic iron overload leads to the accumulation of iron in organs, especially the liver, in the form of ferritin and haemosiderin (Section 3.2 ). It has been proposed that ferritin and haemosiderin can be degraded by lysosomes, liberating ferric iron (Fe3+) which may accumulate in lysosomes as ferrous iron (Fe2+) following reduction. Hydrogen peroxide produced in cells can enter the lysosome where it may produce, in a reaction with ferrous iron (Fe2+), hydroxyl radicals. These radicals may be released into the cytosol when lysosomal membranes are ruptured by the radicals. Ultimately, they may cause hepatocellular damage, such as necrosis, and liver cirrhosis and ultimately may lead to liver failure and hepatocellular carcinoma. These are typical effects of excess iron accumulation which are observed in individuals with impaired downregulation of iron absorption, such as hereditary haemochromatosis, conditions associated with ineffective erythropoiesis (e.g. thalassaemia intermedia and haemoglobin E‐beta thalassaemia) and iron accumulation from repeated red cell transfusions (Valenti et al., 2023). The causes of iron accumulation in these patients are not representative of iron homeostasis in the general population but exemplify the effects of systemic iron overload on the liver.
Liver toxicity has also been reported in cases of iron overload as a consequence of excess dietary iron intakes. Dietary iron overload linked to the consumption of a fermented beverage with a high iron content has been reported in sub‐Saharan populations. This condition, referred to as African dietary iron overload, is characterised by a substantial deposition of iron in the liver and macrophages of the reticuloendothelial system. A study which included 22 individuals living in South Africa diagnosed with iron overload syndrome through liver biopsies (MacPhail et al., 1999), reported that these patients had consumed between 0.4 and 14 L per day of a fermented beverage (median 3 L) for 2–65 years (median 40 years). The average iron content of the beverages consumed was 46 (SD 17) mg/L, leading to a median iron intake of 138 mg/day. The alcohol consumed through this beverage was a median of 96 g/day. SF concentrations ranged from 773 to 38,483 μg/L (median 3050 μg/L) and hepatic iron content between 82 and 1035 μmol/g dry weight. It has been proposed that genetic factors contribute to the condition, but this has not been fully elucidated (Gangaidzo & Gordeuk, 1995; Kew, 2014; Kew & Asare, 2007; Oh & Moon, 2019).
Bell et al. (2000) reported on 21 C282Y‐mutation‐negative patients with iron overload syndrome living in Norway. Seventeen of the patients had taken, on a daily basis, iron supplements between 5 and 50 years and reached SF concentrations of between 428 and 4500 μg/L. The amount of iron consumed through supplements was only reported for one individual who had consumed 300 mg/day for 20 years. This patient had liver fibrosis grade 4 and a SF concentration of 2787 μg/L.
Barton et al. (2006) reported on three C282Y‐mutation‐negative patients with iron overload syndrome in the USA, of whom one had a heterozygosity for a TfR2 mutation. Patient 1 had taken 100 mg/day supplemental iron as ferrous sulfate supplements for 15 years. The SF concentration was 2100 μg/L and the amount of supplemental iron that was absorbed was 1.9%. Patient 2 (heterozygote for TfR2 mutation) had consumed 105 mg/day supplemental iron in the form of ferrous gluconate for 35 years. The SF concentration was 1947 μg/L and the amount of supplemental iron that was absorbed was 1.1%. Patient 3 had consumed iron supplements containing 220 mg/day iron as ferrous fumarate for 61 years. The SF concentration was 1686 μg/L and iron absorption was 0.08%.
Lands and Isang (2017) described a patient in the USA without HFE mutations and iron overload syndrome who had taken between 325 and 975 mg/day supplemental iron in the form of ferrous sulfate for 30 years. The SF concentration was 1379 μg/L.
The patient with iron overload syndrome described by Green et al. (1989) had taken 1000 mg iron as ferrous fumarate for 15 years.
The Panel notes that it is well established, mainly in patients with impaired downregulation of iron absorption, that systemic iron overload leads to liver toxicity. There is evidence that excess dietary iron intakes can lead to liver toxicity also in individuals without disorders of iron metabolism. The amounts of supplemental iron consumed by individuals described in available case reports ranged from 100 to 1000 mg/day for 15 years. However, these data cannot be used alone for setting a UL based on liver toxicity in the general population.
3.5.2. Type 2 diabetes mellitus
Patients with hereditary haemochromatosis are at increased risk of diabetes mellitus, with loss of insulin secretory capacity being a key pathogenic feature (Creighton Mitchell & McClain, 2014). Increased risk of diabetes is also seen with transfusional iron overload, although with a different pathophysiology which involves the development of insulin resistance along with a progressive decrease in the circulating insulin levels due to declining β‐cell function (De Sanctis et al., 2021; Harrison et al., 2023).
Several prospective cohort (PC) studies have indicated an association between SF concentrations and the risk of developing T2DM (Parlesak et al., 2024). Dietary intake of haem iron/dietary patterns rich in sources of haem iron have also been observed to be associated with an elevated risk of T2DM, while total, non‐haem and supplemental iron intake were not related to an increase in risk (Bao et al., 2012; Shahinfar et al., 2022).
Even though foreseen in the protocol, studies on the association between haem iron intake and non‐haem iron intake with T2DM were not used in the assessment (protocol amendment 6), as the available evidence did not allow disentangling a causal contribution of haem iron from that of other risk factors associated with ‘high’ red meat intake (e.g. other dietary factors, lifestyle). Therefore, the assessment of this part of the evidence was not pursued.
Eligible studies for the assessment of this outcome were RCTs, non‐randomised comparative studies of interventions, prospective observational (PC, nested case–control and case‐cohort) studies and follow‐up of intervention studies conducted in adults which excluded prevalent T2DM cases at baseline. For intervention studies, relevant exposures were oral iron supplemental intake vs. placebo and comparisons of different forms of iron. Observational studies should report on oral long‐term iron intake from all sources or supplemental iron intake or on measures of SF concentrations and at least one other marker of iron status (e.g. TSAT, TIBC, sTfR‐to‐ferritin ratio). Studies in which the dose or the amount of iron consumed was not reported or in which the supplementation route was not oral were not eligible. This exclusion criterion had been specified in the protocol for intervention studies but was also applied to observational studies (protocol amendment 7). Studies with co‐interventions were only eligible if the effect of iron per se could be assessed.
Eligible outcomes were measures of incidence of T2DM and measures of glucose homeostasis.
Pertinent studies were retrieved based on the searches performed for the systematic review by the contractor (Parlesak et al., 2024).
3.5.2.1. Intervention studies
No eligible intervention studies were retrieved which assessed the effect of iron supplementation on the incidence of T2DM or on measures of glucose homeostasis.
3.5.2.2. Observational studies
Dietary intake of iron
The relationship between iron intake and risk of T2DM was investigated in nine PC studies, reported in 10 publications [the Japan Collaborative Cohort Study for Evaluation of Cancer Risk (JACC Study), Eshak et al., 2018; the China Health and Nutrition Survey (CHNS; 1991–2015), He et al., 2020; the Health Professionals' Follow‐up Study (HPFS), Jiang et al., 2004; the Korean Genome and Epidemiology Study (KoGES) Ansan–Ansung cohort; Jung et al., 2021 and Kim et al., 2017; the Guangzhou Nutrition and Health Study (GNHS), Li et al., 2021; the Nurses' Health Study (NHS), Rajpathak et al., 2006, the Nurses' Health Study II (NHSII), Bao et al., 2016; the Women's Health Study (WHS), Song et al., 2004; and the Iowa Women's Health Study (IWHS), Lee et al., 2004]. Two publications were available for the KoGES Anan‐Ansung cohort (Jung et al., 2021; Kim et al., 2017).
No eligible PC studies which investigated the relationship between iron intake and glucose homeostasis were retrieved.
For the KoGES, Jung et al. (2021) used more stringent criteria for T2DM assessment and therefore excluded more prevalent cases at baseline than Kim et al. (2017) and is used in the present assessment. Jung et al. (2021) reported as exposure measure the ratio of total iron to total energy intake. As this is not comparable with the other studies, the mean iron intakes in this study have been multiplied by EFSA by mean energy intake for reporting purposes. The analysis by Song et al. (2004) used a population involved in an RCT in which the risks and benefits of low‐dose aspirin and vitamin E for prevention of cardiovascular disease and cancer were evaluated. The analysis by Song et al. (2004) included participants of both the intervention and placebo arms. In the study by Bao et al. (2016), non‐pregnant women with previous GDM, a high‐risk population for developing T2DM, were included.
The size of the PCs ranged from 2696 in the GNHS (around 670 participants per quantile) to 85,031 in the NHS (around 17,000 participants per quantile). The length of follow‐up ranged from 5 years in the JACC to 24 years in the CHNS. Four cohorts were conducted in Asia (KoGES, Korea; JACC, Japan; GNHS and CHNS, China) and three in the USA (WHS, NHS, HPFS). Three studies included males and females (KoGES, GNHS, JACC), three included females only (NHS, WHS, IWHS). One study included males only (HPFS) and two provided sex‐disaggregated analyses (CHNS, KoGES).
The exposure was total iron intake (8 studies), iron intake from natural sources and fortified foods (i.e. excluding intake from food supplements; 1 study) and supplemental iron intake (3 studies), respectively.
Iron exposure was assessed in the CHNS using three consecutive 24‐h recalls and household inventories over the same day. In the remaining studies, semi‐quantitative food frequency questionnaires (SFFQs) were used.
The exposure was presented as quantiles of energy‐adjusted iron intakes in the JACC Study, the CHNS, the GNHS, the NHS, the HPFS and the WHS and as total iron per total energy intake in the KoGES (recalculated to absolute intakes by EFSA for the purpose of inclusion in the forest plot). All studies, except for the NHSII presented analyses using baseline iron intake as exposure. For the analysis of NHSII data, the average cumulative exposure to total iron from all available questionnaires was used as exposure.
Total iron intake
Total iron intakes in the lowest quantiles were below the population reference intake (PRI, 11 mg/day for males and postmenopausal women and 16 mg/day for premenopausal women) derived by EFSA NDA Panel (2015) in five studies (JACC Study 5.1 mg/day; KoGES 6.8 mg/day; NHS 8 mg/day, NHSII 11.5 mg/day and WHS 11.1 mg/day), and in one study, the intake in the highest quantile was also below the PRI (JACC 10.1 mg/day).
The outcome was mainly assessed using participants' self‐reports with varying degrees of verification through using information on laboratory measurements.
The evidence table is in Appendix B . Key study characteristics, together with the effect estimates and related confidence intervals (CIs), are plotted in Figure 6.
FIGURE 6.
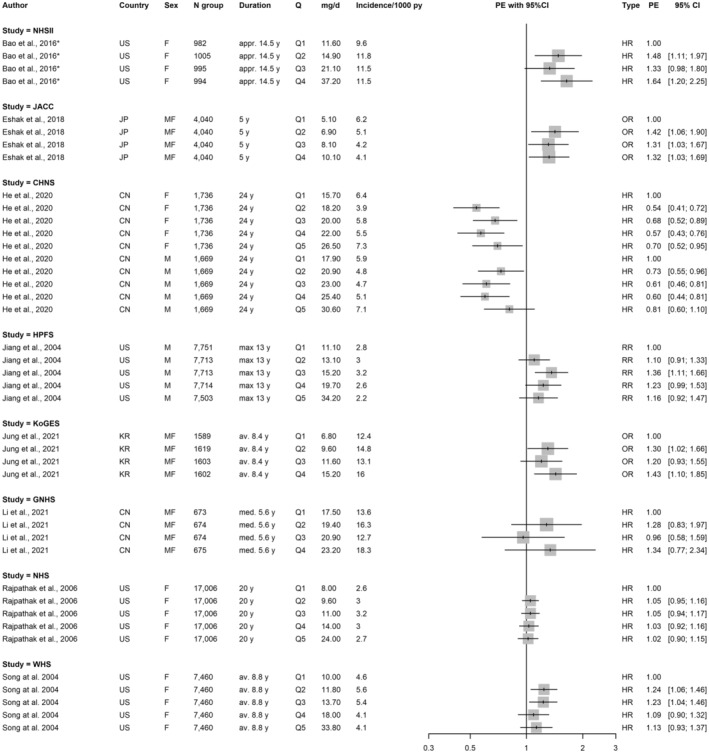
Prospective cohort studies investigating the association between total iron intake and the risk of T2DM. *Exposure = cumulative iron intakes. Intake estimates provided by Jung et al. (2021) (KoGES) as ratio of total‐iron‐to‐total‐energy intake were recalculated by EFSA. appr., approximately; av., average; CHNS, China Health and Nutrition Survey; CI, confidence interval; CN, China; F, females; GNHS, Guangzhou Nutrition and Health Study; HR, hazard ratio; HPFS, Health Professionals' Follow‐up Study; JACC, Japan Collaborative Cohort Study for Evaluation of Cancer Risk; JP, Japan; KoGES, Korean Genome and Epidemiology Study; KR, South Korea; M, males; max, maximum; med., median; NHS, Nurses' Health Study; OR, odds ratio, PE, point estimate; Q, quantile; RR, risk ratio; US, United States; WHS, Women's Health Study; y, years.
An increased risk for T2DM was observed in six out of eight studies (i.e. JACC Study, KoGES, GNHS, WHS, HPFS and NHSII) when comparing the highest with the lowest intake quantiles. This was statistically significant in the analysis of three cohorts (i.e. JACC Study, KoGES and NHSII). However, an increased risk was generally already observed at lower intake quantiles in which mean intakes were at or below the PRIs (Figure 6). The Panel notes that this raises some doubt about the biological plausibility of the association observed in these studies. The Panel also notes that the largest cohort (NHS) with around 17,000 individuals per quantile and a follow‐up of 20 years (between around 260,000 and 372,000 person years per quantile) did not show an association between total iron intake and the incidence of T2DM [aHR (adjusted hazard ratio) 1.02, 95% CI 0.90–1.15].
Supplemental iron intake
Three studies (the NHS, the NHSII and the IWHS] investigated supplemental iron intakes and T2DM. All were performed in the USA and on females. In the NHS (follow‐up of 20 years), the aHR (95% CI) for developing T2DM was 0.96 (0.84–1.1) when comparing supplemental iron intakes of median (range) 22 (15.9–391.7) mg/day with no supplement consumption. In the IWHS (follow‐up 11 years) and the NHSII (follow‐up approx. 14.5 years), the aHR (95% CI) was 1.16 (0.92–1.46) and 1.83 (1.25–2.70), respectively, when comparing supplemental intakes ≥ 30 mg/day with no supplement use.
Iron intake from natural sources and fortified foods
In the NHS, the relationship between intakes of dietary iron (excluding food supplements) and T2DM was investigated. When comparing the fifth quintile with the first (median intakes 14 vs. 8 mg/day), the aHR (95% CI) was 1.02 (0.91–1.15).
Conclusions on the evidence from observational studies on dietary intake of iron
The Panel notes the uncertainties related to the results of the PC studies showing an increase in risk in T2DM associated with ‘high’ total iron intakes, that the largest study (i.e. NHS) did not report such an association and that the results of the analysis using supplemental iron intake as exposure are inconsistent.
The Panel considers that the available BoE from observational studies is insufficient to conclude on a positive relationship between the dietary intake of iron and risk of T2DM.
Serum ferritin concentrations
Observational studies that used SF as a marker of iron exposure were not further assessed because it could not be determined with sufficient certainty that SF reflected iron intakes in these studies. Generally, baseline concentrations of CRP, plasma (fasting) glucose, plasma (fasting) insulin and other measures of glucose homeostasis, as well as concentrations of liver enzymes increased across quantiles of SF or in cases and controls, when reported, indicating that SF concentrations were rather a marker of inflammation than iron intake in these studies. In addition, when baseline iron intakes were given, these were generally not different across quantiles of SF concentrations or in cases and controls. The results of these studies are summarised in the report by the contractor (Parlesak et al., 2024).
3.5.2.3. Overall conclusions on type 2 diabetes mellitus
The Panel considers that the available BoE is insufficient to conclude on a positive relationship between dietary iron exposure and risk of T2DM over the range of iron intakes investigated in the studies. No comprehensive UA is performed.
3.5.3. Gestational diabetes mellitus
Several PC studies have indicated an association between SF concentrations or dietary intake of haem iron/dietary patterns rich in sources of haem iron and the risk of developing GDM (Durrani et al., 2021; Fernandez‐Cao et al., 2017; Fu et al., 2016; Iqbal & Ekmekcioglu, 2019; Kataria et al., 2018; Miranda et al., 2022; Parlesak et al., 2024; Petry, 2022; Yang et al., 2022; Zhao et al., 2017).
Even though foreseen in the protocol, studies on the association between haem iron intake and non‐haem iron intake with GDM were not used in the assessment (protocol amendment 6), as the available evidence did not allow disentangling a causal contribution of haem iron from that of other risk factors associated with ‘high’ red meat intake (e.g. other dietary factors, lifestyle). Therefore, the assessment of this evidence was not pursued.
Eligible studies for the assessment of this outcome were RCTs, non‐randomised comparative studies of interventions, prospective observational (PC, nested case–control, and case‐cohort) studies and follow‐up of intervention trials conducted in pregnant women. For intervention studies, relevant exposures were oral iron supplemental intake with repeated administration of at least 4 weeks vs. placebo and comparisons of different forms of iron. Observational studies should have reported on oral long‐term iron intake from all sources or supplemental iron intake or on measures of SF concentration and at least one other marker of iron status (e.g. TSAT, TIBC, sTfR‐to‐ferritin ratio). Studies in which the dose or the amount of iron consumed was not reported or in which the supplementation route was not oral, were not eligible. These exclusion criteria have been specified in the protocol for intervention studies but were also applied to observational studies (protocol amendment 7). Studies with co‐interventions were only eligible if the effect of iron per se could be assessed.
Eligible outcomes were measures of incidence of GDM and measures of glucose homeostasis.
Pertinent studies were retrieved based on the searches performed for the systematic review by the contractor (Parlesak et al., 2024) and by manual searching the reference lists of available systematic and narrative reviews (Durrani et al., 2021; Fernandez‐Cao et al., 2017; Fu et al., 2016; Iqbal & Ekmekcioglu, 2019; Kataria et al., 2018; Miranda et al., 2022; Petry, 2022; Yang et al., 2022; Zhao et al., 2017).
3.5.3.1. Intervention studies
Three eligible intervention studies were retrieved which assessed the effect of iron supplementation on GDM. No eligible studies were retrieved which investigated glucose homeostasis as an outcome independent of the risk of developing GDM. One study was conducted in Hong Kong (Chan et al., 2009), one in Iran (Ouladsahebmadarek et al., 2011) and one in China (Liu & Pang, 2018).
Chan et al. (2009) randomised 1164 pregnant females (recruited before the 16th gestational week, mean recruitment time point around 11.3 gestational weeks) with haemoglobin (Hb) concentrations between 8 and 14 g/dL, to daily supplementation of iron (300 mg ferrous sulfate equivalent to 60 mg elemental iron, n = 565) or placebo (n = 599). Baseline dietary iron intake was on average 16.3 mg/day in the iron and 16.1 mg/day in the placebo group, as assessed by a 7‐day dietary record. The study was single blind as investigators were aware of the group allocation. Between gestational weeks 28 and 30, a 75‐g oral glucose tolerance test (OGTT) was performed in all women to diagnose potential GDM cases. Those not diagnosed with GDM at 28 weeks underwent an additional OGTT at gestational week 36. Compliance was around 54% and 63% at gestational weeks 28–30 and 36, respectively, and not statistically significantly different between groups. At week 28, 56 women in the iron group and 60 women in the control group had developed GDM and at week 36 there were 16 additional cases in the iron group vs. 17 cases in the placebo group. In total, 72 cases were diagnosed in the iron and 77 cases in the placebo group with an OR, on an intention‐to‐treat basis, of 1.04 (95% CI 0.70–1.53). There were also no differences in the 2‐h glucose levels of the OGTT between groups (mean (SD): 6.20 (0.06) mmol/L vs. 6.22 (0.05) at week 28 and 6.04 (0.07) vs. 6.08 mmol/L at week 36 in the iron and placebo groups, respectively).
The Panel notes that this single‐blind intervention study does not show an effect of supplemental iron intake of 60 mg/day, taken in addition to around 16 mg/day dietary iron, starting from the second trimester of pregnancy and consumed for at least 20 weeks, on the risk of developing GDM.
In the study by Ouladsahebmadarek et al. (2011), non‐anaemic pregnant women in the first trimester of pregnancy were randomised matched by age, BMI, parity, previous obstetric history and biomarkers of iron status at baseline to receive daily 30 mg of elemental iron and a multivitamin supplement not containing iron from the 13th gestational week onwards (n = 480), while the placebo group received daily a placebo tablet and the multivitamin supplement (n = 480). GDM was self‐reported in a questionnaire. A total of 410 participants in the iron group and 372 in the placebo group completed the study. Two GDM cases occurred in the iron group and three in the placebo group (RR 0.61, 95% CI 0.10–3.61; calculated by EFSA).
The Panel notes that this intervention study with a high and differential dropout rate between the study groups does not show an effect of supplemental iron intake of 30 mg/day starting from the second trimester of pregnancy on an increase in risk of developing GDM. No information on the background dietary iron intake was available.
In a study, which is reported to have been retrospective in the title of the publication but was, based on the description in the publication, considered by the Panel to be a non‐randomised open label intervention study (Liu & Pang, 2018), 135 women consumed 300 mg/day supplemental iron from less than 16 gestational weeks onwards, while 124 women did not receive iron supplements. Ten women in the iron group and 9 women in the control group developed GDM (RR 1.02, 95% CI 0.43–2.43; calculated by EFSA). The time point and the way in which GDM was assessed (i.e. self‐report or OGTT for the purpose of the study) was not reported.
The Panel notes that this non‐randomised open label intervention study with a small sample size does not show an effect of supplemental iron intake of 300 mg/day starting at less than 16 gestational weeks on an increase in risk of developing GDM.
Conclusions on the evidence from intervention studies
The Panel considers that the evidence from three intervention studies does not indicate a relationship between iron supplementation during pregnancy, starting mostly from the second trimester of pregnancy, and the risk of developing GDM over the dose range investigated in the studies.
3.5.3.2. Observational studies
Dietary intake of iron
The systematic review of the scientific literature identified five prospective observational studies which assessed the association between iron intake (through the diet and/or supplementation) and GDM.
Two studies were excluded at the step of data extraction. One study (Behboudi‐Gandevani et al., 2013) reported implausible iron intakes of a mean of > 100 mg per day when data were presented separately for women with and without GDM and when considered together mean intakes were reported to have been around 17 mg/day in a population in which around 50% did not reach iron intakes of 50% of the PRI. The second study, a study by Helin et al. (2012), was a prospective study but the intake estimates used in the publication were those obtained by an SFFQ administered during the same time span during which also the OGTT was done. Hence, the results presented were considered to be of cross‐sectional nature.
Finally included in the assessment were three PC studies, i.e. the SUN Project (Marí‐Sanchis et al., 2018), the NHSII (Bowers et al., 2011) and the Tongji Maternal and Child Health Cohort (Zhang, Wu, et al., 2021; Zhang, Xu, et al., 2021). Results of the latter were reported in two publications which explored the effect of using different cut‐offs for iron supplementation in the analysis on the outcome.
The exposure in the three included studies was total iron intake (SUN Project, NHSII) or supplemental iron intake (NHSII, Tongji Maternal and Child Health Cohort). It was measured before pregnancy in one study (NHSII), while the timing of the assessment was unclear in the two other studies (SUN project, Tongji Maternal and Child Health Cohort).
Total iron intake
In analysis of the SUN Project (Marí‐Sanchis et al., 2018), data from 3298 pregnant females in Spain were included. The GDM diagnosis, based on a 50‐g and then a 100‐g OGTT, was self‐reported and then verified by investigators using medical records. Total iron intake was assessed using an SFFQ. The time point when the SFFQ was applied (i.e. before or during pregnancy) and how much it preceded GDM diagnosis was not reported. When comparing quartile 4 (median total iron intakes: 22.4 mg/day) with quartile 1 (14.4 mg/day), a non‐significantly increased risk of GDM was observed [adjusted odds ratio (aOR) 1.25, 95% CI 0.67–2.36, adjusted for age, BMI, family history of diabetes, parity, multiple pregnancy, smoking, physical activity, hypertension, sugar‐sweetened soft drinks, total energy intake, total fibre intake, special diet and snacking]. The risk was already increased in quartile 2 [median intake 17 mg/day; aOR 1.12 (95% CI 0.69–1.80)] and quartile 3 [median intake 18.9 mg/day; aOR 1.24 (95% CI 0.74–2.06)].
The Panel notes that even though the study in 3298 pregnant females indicates an increase in risk of GDM to be associated with total iron intakes above the PRI (median intakes 17–22.4 mg/day), the associations were not statistically significant. In addition, it is unclear to which time span the dietary assessment relates which limits the conclusions that can be drawn from this study.
An analysis of the NHSII (Bowers et al., 2011) used data from 13,475 females reporting a pregnancy lasting at least 6 months. GDM diagnosis was self‐reported by participants. Iron intake was assessed using a repeated SFFQ and the cumulative average iron intake, reflecting habitual iron intake outside of pregnancy, was used in the analysis. The total iron intakes were not associated with an increased risk of GDM in any of the quintiles investigated. When comparing Q5 (median intakes 49.8 mg/day, n = 3918) with Q1 (10.7 mg/day, n = 2380), the aRR was 0.90 (95% CI 0.72–1.12). Supplemental iron intake (60 mg/day, Q5, vs. 0 mg/day Q1) was not associated with the risk of GDM (aRR 1.04, 95% CI 0.84–1.28). Only for dietary iron, a non‐statistically significantly increased risk was observed when comparing Q5 with Q1 (18.9 vs. 10.3 mg/day; aRR 1.12, 95% CI 0.84–1.28).
The Panel notes that this analysis on 13,475 women does not show an association between total cumulative median iron intakes of 49.8 mg/day vs. 10.7 mg/day and the risk of GDM.
Supplemental iron intake
The association between supplemental iron intake and GDM was investigated in the study by Bowers et al. (2011) and this was not associated with the risk of GDM, as described above.
In the Tongji Maternal and Child Health Cohort (Zhang, Wu, et al., 2021; Zhang, Xu, et al., 2021) conducted in China, pregnant women were recruited at less than 16 gestational weeks. GDM was diagnosed using a 75‐g OGTT at gestational weeks 24–28. Data on iron supplement use were collected at baseline and during mid‐pregnancy. Iron supplement users were defined as those who took iron‐containing supplements (single nutrient or multi‐nutrient supplements) > 5 times per week for > 4 consecutive weeks. A total of 5101 women with a singleton pregnancy were included in the analysis. Those who took supplements containing > 30 mg/day iron for > 3 months were more likely to be diagnosed with GDM (aRR 1.53, 95% CI: 1.21–1.93), compared to those classified as non‐users. The aRR, when comparing those who took > 30 mg/day iron for < 3 months with non‐supplement users, was 1.14 (95% CI 0.80–1.61).
The Panel notes that this study shows an association between supplemental iron intakes of 30 mg/day for more than 3 months and the risk of developing GDM. However, it has not been reported whether this was associated with supplemental intake before or during pregnancy, or both.
Conclusions on the evidence from observational studies on dietary intake of iron
The Panel notes the poor reporting in most of the observational studies, in particular related to the timing of the dietary assessment and iron supplementation.
The Panel considers that the evidence from observational studies on the relationship between total iron intakes or supplemental iron intakes is inconsistent. The Panel, however, notes that the study with the largest sample size (around 13,500 women) did not show an association between total iron intake or supplemental iron intake and the risk of GDM and that iron intakes in this study were higher than the ones in studies reporting an association.
Serum ferritin concentration
Observational studies that used SF as marker of iron exposure were not further assessed because it could not be determined with sufficient certainty that SF reflected iron intakes in these studies (see also Section 3.5.2.2 ). The results of these studies are summarised in the report of the contractor (Parlesak et al., 2024).
3.5.3.3. Overall conclusions on gestational diabetes mellitus
The Panel notes that none of the three intervention studies showed an effect of iron supplementation during pregnancy, starting from the second trimester of pregnancy and the risk of developing GDM at doses up to 300 mg/day. The evidence from observational studies is inconsistent, although the largest study with the highest iron intakes (around 50 mg/day total iron intake; 60 mg/day iron supplementation) did not show an association between iron intake and an increased risk of developing GDM.
The Panel considers that the available BoE does not suggest a positive relationship between dietary iron intake and risk of GDM and thus, no comprehensive UA is performed.
3.5.4. Adverse gastrointestinal effects
It is well established that iron supplementation can be a cause of adverse GI effects (Cancelo‐Hidalgo et al., 2013; Tolkien et al., 2015). The incidence of adverse GI effects had been used as an outcome by IOM (2001) to set an UL for iron and by EVM (2003) to set a guidance value for iron supplementation. Eligible studies for the present assessment were RCTs with no restriction of the studied population group. Non‐randomised interventions were not considered (protocol amendment 2). Relevant exposures were oral supplemental iron intake vs. placebo or vs. intravenous iron supplementation, or the comparison of the effect of two different forms of iron. Studies with co‐interventions which could have had an effect on GI symptoms, or which did not allow to assess the effect of iron per se were excluded. The outcomes to be studied included acute GI effects (such as nausea, constipation, vomiting, bloating, flatulence, mucositis and loss of appetite) diagnosed by any medical anamnestic method, questionnaire, face‐to‐face interview and spontaneous reporting by study participants. The systematic search was limited to articles published from 2003 onwards. Relevant studies included in the previous assessments by IOM (2001), EVM (2003) and EFSA (2004) were added to the studies retrieved through the systematic search.
In the systematic search, the contractor had identified 58 intervention studies published after 2003 which provided data that could be used for the assessment of adverse GI effects after iron supplementation in different populations (i.e. infants, children, adolescents and adults, pregnant women). These studies have been reviewed in detail in the final report by the contractor (Parlesak et al., 2024). Vomiting and diarrhoea were the most frequently reported adverse effects associated with iron supplementation in infants. In children, no consistent pattern was identified. In adolescents and adults, diarrhoea, epigastric discomfort or abdominal pain and constipation were the main symptoms reported. In pregnant women, vomiting, epigastric discomfort or abdominal pain, nausea and constipation were cited most frequently. However, in the articles included, specific adverse GI effects were often reported only briefly, in an inconsistent manner and not systematically (Parlesak et al., 2024). The evidence differed largely according to the study population, including the sex distribution, the iron forms administered, the doses (ranging from 3 to 150 mg/day) and the study duration (ranging from 1 to 72 weeks); see Table 17 in the report of the contractor (Parlesak et al., 2024). The findings were generally inconsistent and sometimes contradictory and no relationship with the iron dose could be identified.
The findings of the contractor are in line with another systematic review and meta‐analysis conducted by Tolkien et al. (2015) that focussed on adverse GI effects caused by ferrous sulfate. The authors had identified 43 eligible RCTs investigating oral iron supplementation vs. placebo or vs. intravenous iron administration. The risk of experiencing adverse effects was higher with oral iron (ferrous sulfate) supplementation than with placebo (OR 2.32, 95% CI 1.74–3.08) or intravenous administration (3.05, 95% CI 2.07–4.48). However, there was no dose‐related response observed (dose ranges 20 to 222 mg/day for placebo‐controlled studies and 80–400 mg/day for studies with intravenously administered iron as control).
Another systematic review (Cancelo‐Hidalgo et al., 2013) found that micro‐encapsulated iron salts such as ferrous sulfate and retarded‐release iron preparations had the lowest incidence of adverse effects, while simple salts such as ferrous glycine sulfate, ferrous gluconate, uncoated ferrous sulfate and ferrous fumarate were less well tolerated. Therefore, adverse effects seem to depend on the forms of iron preparations ingested and are less likely to occur when iron is provided in chelated form (Fairweather‐Tait & Teucher, 2002).
The Panel decided to review in detail studies which reported the use of standardised tools to elicit adverse GI effects between the intervention groups in a consistent manner. Studies which used (validated) questionnaires, structured interviews or other standardised tools (e.g. data sheets) were included in this further review. In addition, the Panel searched for publications which cited the study by Pereira et al. (2014) in which a symptom questionnaire was developed to assess adverse GI effects of iron supplementation. In all the studies, symptoms were self‐reported by participants.
Thirteen intervention studies reported in 10 publications met the inclusion criteria and are described below. The results of studies investigating the percentage of individuals responding to iron supplementation with adverse GI effects are also shown in Figure 7.
FIGURE 7.
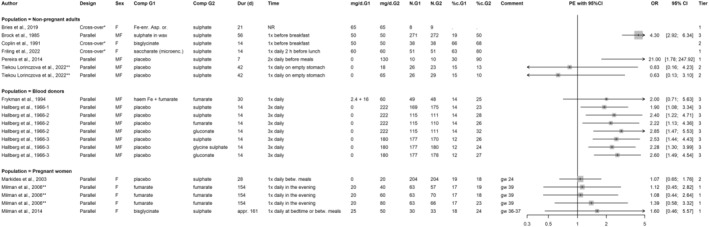
Intervention studies investigating the effect of iron supplements on adverse GI effects using structured tools for their assessment. *For cross‐over studies, no effect estimates could be calculated. In addition, Bries et al. (2019) did not report on the percentage of individuals with at least one symptom. It is, however, reported that consuming ferrous sulfate resulted in a tendency for a higher incidence of constipation, diarrhoea, nausea and abdominal discomfort. **Based on data provided by the authors of the study to EFSA. All OR estimated by EFSA.
3.5.4.1. Adults (excluding pregnant women)
Two randomised studies (Brock et al., 1985; Coplin et al., 1991) already considered by IOM (2001) and EFSA (2004) in their previous assessments, compared the effect of two different forms of iron without including a placebo group/period or reporting on GI symptoms during periods without iron supplementations. They included 543 adults [males (n = 59) and females (n = 484)] with Hb concentrations between 10 and 16 g/dL in a parallel design (Brock et al., 1985) and 38 non‐pregnant iron‐replete females in a cross‐over design (Coplin et al., 1991). For the study by Coplin et al. (1991), it is unclear whether a wash‐out period was included in the design or not. In both studies, 50 mg iron per day was given. The forms used were ferrous sulfate or a ferrous sulfate wax matrix preparation in the study by Brock et al. (1985) and ferrous sulfate and ferrous bisglycinate in the study by Coplin et al. (1991). In the intervention by Brock et al. (1985), which lasted 56 days and in which supplements were consumed in the morning before breakfast, 50% of individuals consuming ferrous sulfate experienced moderate to severe adverse GI effects, such as abdominal discomfort, nausea, vomiting, constipation and diarrhoea (assessed using diary cards) while in the group consuming supplemental iron in wax matrix form, also consumed before breakfast, the percentage was 19%. Dark stools were experienced in 6.3% of individuals in the ferrous sulfate group and in 1.8% of individuals in the wax matrix group. A total of 77 participants, 44 (16%) in the ferrous sulfate group and 33 (12%) in the wax matrix group stopped the study early because of ‘intolerable side effects’. In the study by Coplin et al. (1991) in which iron consumption periods lasted for 2 weeks, 68% of women reported GI symptoms (such as abdominal pain, bloating, constipation, diarrhoea, nausea and vomiting; assessed using a daily log of prespecified symptoms and their severity) during the period in which ferrous sulfate was consumed and 66% reported symptoms when taking the chelate. The incidence of black stools was not investigated in this study.
The Panel notes that in the absence of a comparison with a placebo, baseline or a wash‐out period, the findings of these two studies are difficult to interpret. The panel also notes the lack of information on the wash‐out period in the study by Coplin et al. (1991). However, the studies indicate the presence of GI symptoms when 50 mg/day elemental iron is consumed as ferrous sulfate and ferrous bisglycinate. The percentage of individuals with adverse GI effects was significantly less when iron was consumed in a wax matrix.
Four other studies described in two publications also already considered by IOM (2001) and EFSA (2004) were performed in blood donors.
Hallberg et al. (1966) described three randomised interventions (reported as series in the original publication) in blood donors (iron status not reported). All lasted 14 days and symptoms, such as constipation, diarrhoea, heartburn, nausea and epigastric pain, were assessed by questionnaires. The first study was in 393 individuals (195 received placebo and 198 ferrous sulfate). The iron dose was three times daily 74 mg (a total of 222 mg per day). The second study, testing different iron formulations, was in 477 individuals. Of those, 119 received placebo, 120 ferrous sulfate, 118 ferrous fumarate and 120 ferrous gluconate. The dosing was the same as in the first study. In the third study, 200 individuals received placebo, 200 ferrous glycine sulfate and 196 ferrous gluconate. In this study, iron tablets were taken three times a day and contained 60 mg providing a total of 180 mg iron per day. In all studies, significantly more adverse GI effects were reported by individuals taking the iron tablets, ranging between about 23% and 32% vs. around 12%–14% in the placebo consuming individuals. The incidence of black stools was not investigated in these studies.
The Panel notes that, in all three studies reported in this publication, there was a higher percentage of individuals with adverse GI effects when consuming 180–222 mg iron/day divided into three daily doses as compared to controls.
Frykman et al. (1994) described an intervention in 100 blood donors (iron status not reported). Individuals were randomly assigned to two parallel groups in which participants consumed once per day either 60 mg/day iron as ferrous fumarate or 2.4 mg as haem iron from porcine blood plus 16 mg as ferrous fumarate for 30 days. The authors state that the study was ‘divided into three consecutive periods of 1 month each’ and that ‘all participants randomly received a placebo during one of the last two periods’. The Panel assumes that, in the first period, around half of the participants were randomly assigned to receive ferrous fumarate alone and, the other half the combination of haem and non‐haem iron. Thereafter, two other periods followed, in both of which half of the participants randomly received placebo and the other half one of the iron interventions. Participants kept a symptom diary and filled in a multiple‐choice questionnaire in which they had to rate the severity of nausea, epigastric pain, obstipation and diarrhoea (ranging from none to intolerable). A total of 25% of individuals experienced at least one adverse GI effect in the group consuming ferrous fumarate alone. In the groups receiving the combination of haem and non‐haem iron or placebo the percentages were, in both instances, 14%. The percentages of participants experiencing the following individual symptoms when taking non‐haem iron, the combination of haem and non‐haem iron or placebo were nausea: 6%, 8%, 4%; epigastric pain: 19%, 6%, 10%; obstipation: 35%, 14%, 20%; and diarrhoea: 37%, 26%, 14%, respectively. The incidence of black stools was not investigated in this study.
The Panel notes that this study shows an effect of consuming 60 mg/day elemental iron once per day as ferrous fumarate on the percentage of individuals suffering from adverse GI effects compared to placebo or a combination of haem and non‐haem iron at lower doses.
The studies described below were published after the previous assessments and thus were not considered by IOM (2001) and EFSA (2004).
Pereira et al. (2014) developed a questionnaire to assess GI symptoms associated with iron supplementation. This questionnaire was based on a previously validated bowel symptom questionnaire and was tested in a randomised placebo‐controlled double‐blind study on 20 apparently healthy individuals (13 females, 7 males; iron status not reported). Ten individuals were randomised to ferrous sulfate (400 mg containing 130 mg elemental iron, divided into two doses to be consumed in the morning and the evening at mealtimes) for 7 days, and 10 individuals received placebo. After the intervention period, study participants were followed up for an additional week. All individuals were informed that they might suffer from black stools. Compliance with the intervention was > 80% for the pills to be taken in the morning and > 90% for the ones to be taken in the evening. Nine out of 10 individuals in the iron group (90%) and three in the placebo group (30%) reported at least one GI effect, including black stools, during the intervention. In the follow‐up period, the numbers were six and three, respectively. The mean number of symptoms, per participant, of overall adverse GI effects was higher in the iron group both in the intervention and the follow‐up period compared to the placebo group (6.7 vs. 1.2 and 4.6 vs. 1.0, respectively), but the difference was not statistically significant. Around 30% of participants in the iron group reported nausea compared to 20% in the placebo group during the intervention period. Fifty percent in the iron group had heartburn compared to 0% in the placebo group. Abdominal pain was reported in 70% vs. 20%, constipation in 30% vs. 20%, changes in bowel movements in 60% vs. 20% and black stools in 80% vs. 0%. Symptoms were experienced with less frequency during the follow‐up period, but the frequency was higher in the iron group compared to placebo except for nausea which occurred to a similar extent in both groups during follow‐up. Black stools first occurred after 72 h of supplementation. Other symptoms were reported from the first day onwards.
The Panel notes that this study with a small sample size shows an effect of consuming 400 mg/day ferrous sulfate (130 mg elemental iron) divided into two daily doses on the incidence of and the percentage of individuals with adverse GI effects. The effects persisted with lower frequency in the week of observation after cessation of iron supplementation. A total of 80% of individuals in the iron group and none in the placebo group reported black stools.
In a cross‐over study, Friling et al. (2022) randomised 51 non‐anaemic (Hb ≥ 12 g/dL) pre‐menopausal women with regular menstrual cycles, aged 18–50 years, to 60 mg/day iron, either a microencapsulated formulation of ferric saccharate or ferrous sulfate for 14 days, with a wash‐out period of at least 1 month (two menstrual episodes) in between. Participants were instructed to take the supplements 2 h before lunch. Two participants dropped out due to illness, one participant left the study during the wash‐out period, and one was excluded due to poor compliance (15% of capsules taken). Adverse GI effects were assessed via a questionnaire based on the one developed by Pereira et al. (2014), and participants were instructed to complete the questionnaire during the 14 days of interventions (for each treatment) and the wash‐out period. The percentage of participants experiencing GI effects was 68% (microencapsulated formulation of ferric saccharate), 87% (ferrous sulfate) and 64% (wash‐out period). The authors reported that dark stools was the most common adverse event in both iron supplementation periods (numerical results not given in the publication). Nausea was experienced in 23% of women during the ferrous sulfate period, in 9% of women during the period in which women took the microencapsulated formulation of ferric saccharate, and in 4% of women during the wash‐out period. For heartburn, the percentages were 21%, 15% and 6%; for abdominal pain, it was 36%, 21% and 32%; for flatulence, it was 64%, 43% and 40%; for diarrhoea, it was 30%, 13% and 11%; metallic taste was experienced by 13%, 6% and 2%; constipation was experienced by 26%, 23% and 19%; and finally vomiting was experienced by 2% vs. 0% in the other periods.
The Panel notes that this study shows an effect of 60 mg/day elemental iron consumed as ferrous sulfate on an empty stomach once per day on adverse GI effects compared to microencapsulated ferric saccharate and the wash‐out period. Dark stools was reported to be the most common side effect during both iron supplementation periods (prevalence not reported). Black stools have not been assessed specifically.
In another crossover study, Bries et al. (2019) randomised 17 non‐anaemic (Hb ≥ 12 g/dL) women, aged 18–40 years to 65 mg/day iron, to either ferrous sulfate or iron‐enriched Aspergillus oryzae. Interventions were to be consumed for 3 weeks each, with a three‐week placebo/wash‐out period before treatment crossover. Subjects were instructed to take one capsule per day with food. Adverse GI effects were assessed via a modified version of the questionnaire developed by Pereira et al. (2014) which was administered on two randomly chosen weekdays and one weekend day during each period. The subjects were asked to report the frequency and severity of nausea, heartburn, abdominal discomfort, fatigue, diarrhoea and constipation. One subject dropped out during placebo period because of reported GI discomfort. Compliance was reported as 97% (iron‐enriched Aspergillus oryzae), 93% (ferrous sulfate) and 95% (placebo), respectively. Ferrous sulfate supplementation tended to result in non‐statistically significantly higher mean frequency over 3 weeks [mean ± standard error of the mean (SEM)] of constipation (1.56 ± 0.50 vs. 1.13 ± 0.42 vs. 1.06 ± 0.37), diarrhoea (1.00 ± 0.33 vs. 0.63 ± 0.22 vs. 0.50 ± 0.24), nausea (0.75 ± 0.30 vs. 0.38 ± 0.18 vs. 0.44 ± 0.16) and abdominal discomfort (2.81 ± 0.56 vs. 2.50 ± 0.50 vs. 2.75 ± 0.78), compared to the iron‐enriched Aspergillus oryzae and the placebo. When the authors combined the most common adverse effects into a score, they reported that the differences were statistically significant between the ferrous sulfate group and the other two groups at the third week of supplementation, but not during the preceding weeks (numbers not given in the paper). The incidence of black stools was not investigated in this study.
The Panel notes that this study shows an effect of 65 mg/day elemental iron consumed as ferrous sulfate and taken once per day with food on a combined GI symptom score when compared to iron‐enriched Aspergillus oryzae or placebo.
Tiekou Lorinczova et al. (2022) randomised iron‐replete apparently healthy volunteers (76 females, 79 males), aged 18–40 years, to placebo (n = 31), ferrous sulfate with 18 mg/day elemental iron (n = 31) or ferrous sulfate with 65 mg/day elemental iron (n = 31) to be taken once per day on an empty stomach for 6 weeks. Two other groups were also included in the trial which investigated the combination of ferrous sulfate with curcumin. Due to the co‐supplementation with curcumin, these groups were not considered further by the Panel. GI symptoms were assessed by the questionnaire developed by Pereira et al. (2014) described above. Data from one individual were excluded from data analysis because of a BMI ≥ 40 kg/m2, even though this was not explicitly mentioned as an exclusion criterion. Adherence in both groups was ≥ 80%. The authors report no statistically significant differences in the percentage of individuals with nausea, vomiting, heartburn, abdominal pain, headache, breathlessness and diarrhoea or for experiencing at least one adverse effect, including darker stools (personal communication of the authors). The number of darker stools was statistically significantly higher in the group consuming 65 mg/day iron compared to placebo using the Fisher's exact test with Bonferroni correction at an intermediate timepoint, but not at the end of the study. No statistically significant differences were reported between the 18 mg/day group and placebo at any time point. Results with respect to black stools are not reported in the publication.
The Panel notes that this study does not show an adverse effect of 65 mg/day elemental iron consumed as ferrous sulfate on an empty stomach once per day on the incidence of adverse GI effects or the percentage of individuals reporting at least one adverse effect. The number of darker stools was significantly higher in the group supplemented with 64 mg iron compared to placebo at the intermediate assessment time point but not at the end of the study. Results with respect to black stools are not reported in the publication.
3.5.4.2. Pregnant women
In a dose–response study, Milman et al. (2006) randomised 427 pregnant women to consume 20, 40, 60 or 80 mg/day ferrous iron in the form of fumarate from 18 weeks of gestation until delivery (around 21 weeks). At inclusion, the authors found that 6–11% of the participants were ‘iron deficient’ (defined as SF < 13 μg/L) across the groups, while there were very few cases of ‘iron deficiency anaemia’ [defined as SF < 13 μg/L and Hb < 6.6 mmol/L (106 g/L)]. Iron tablets were to be taken once per day at bedtime or between meals, although 15% reported to have taken them with a meal. GI symptoms were recorded by interview at gestational weeks 18, 32 and 39. A total of 136 women dropped out during the study. They were evenly distributed among groups. This was also the case for women (n = 40) who dropped out because of GI symptoms. Only women who had compliance > 90% were included in the analysis which contained data from 404 individuals at baseline, 293 at 32 weeks of gestation and 256 at 39 weeks of gestation. Loss to follow up was similar among groups. Adverse GI effects were the reason for drop‐out in 12%, 8%, 8% and 9% of women in the 20, 40, 60 and 80 mg/day groups, respectively; poor compliance was the reason in 7%, 6%, 9% and 9% of participants, respectively. There was a statistically significantly increase in black stools across the intervention groups. At baseline, black stools occurred in 5%, 7%, 9% and 9% of women in the 20, 40, 60 and 80 mg/day groups (n = 99, 100, 102 and 103), respectively. At 32 weeks of gestation, the percentage was 10%, 29%, 58% and 72% (n = 71, 68, 79 and 75) and at 39 weeks of gestation 5%, 23%, 58% and 64% (n = 63, 57, 70 and 66). For other investigated adverse effects such as nausea, vomiting, epigastric pain, eructation, pyrosis, meteorism, borborygmi, colic pain, flatulence, constipation, thin faeces once per day, thin faeces several times per day, other abdominal complaints and use of laxative, no dose–response was observed. For eructation and thin faeces, the percentage of women experiencing these symptoms was somewhat higher at 32 and 29 weeks of gestation than at 18 weeks in all dose groups including the lowest dose group. Also, when all reported complaints were summed up and expressed as a percentage of overall responses (data provided to EFSA by the authors upon request), there were no differences in this composite outcome among the four groups, when black stools were not included in the calculation.
The Panel notes that this study does not show an effect of consuming 20, 40, 60 or 80 mg/day ferrous iron once per day at bedtime on the percentage of pregnant women with adverse GI effects, either as individual effects or as combined outcome. The study, however, shows a dose‐related increase in the percentage of women with black stools compared to the pre‐supplementation baseline, starting at a supplemental dose of 40 mg/day.
Milman et al. (2014) randomised apparently healthy pregnant women, to consume from the 15–19th gestational week until delivery either 25 mg elemental iron as ferrous bisglycinate (n = 40) or 50 mg elemental iron as ferrous sulfate (n = 40) at bedtime or between meals. Most women had taken supplements which contained iron before the initiation of the study and these supplements were discontinued upon inclusion in the study. At inclusion, the authors found that 8% of the participants were ‘iron deficient’ (defined as SF < 15 μg/L), while none of them had ‘iron deficiency anaemia’ [defined as SF < 12 μg/L and Hb < 6.8 mmol/L (110 g/L)]. Adverse GI effects (nausea, vomiting, pyrosis/cardialgia, ructus, meteorism, borborygmi, colic pain, flatulence, loose stools, constipation, use of laxatives, black stools) were assessed by questionnaire. A total of 17 women dropped out of the study; three in each group because of side effects. Drop‐outs were similar in both groups; 30 and 33 women, respectively, finished the study. Compliance was on average 89% in the bisglycinate group and 80% in the sulfate group. When combining all GI effects reported at gestational weeks 27–28 and at weeks 36–37, including black stools, there was a significant difference between the bisglycinate and the sulfate group with more women in the sulfate group reporting side effects (16% vs. 21%). Results did not change when black stools were excluded from the composite outcome. The percentage of individuals reporting black stools in the bisglycinate group remained stable from baseline to the end of the study while in the sulfate group, the percentage was higher with statistically significant differences at the end of the study (data provided to EFSA by the authors upon request).
The Panel notes that this study shows an effect of consuming 50 mg/day iron as iron sulfate compared to 25 mg/day iron as ferrous bisglycinate, consumed at bedtime or between meals, on the percentage of pregnant women with adverse GI effects. The percentage of pregnant women reporting black stools was also higher in the group consuming 50 mg/day iron as iron sulfate while in the group consuming 25 mg/day iron as ferrous bisglycinate the percentage did not change from baseline to the end of the study.
Makrides et al. (2003) randomised 430 pregnant non‐anaemic women (Hb concentrations ≥ 110 g/L) to consume either 20 mg/day iron (as ferrous sulfate) or placebo between meals from 20 weeks of gestation until delivery. If anaemia was detected at gestational week 28, women, irrespective of their randomised group, received ≥ 80 mg/day iron in addition to their intervention products from this time point onwards (n = 93). Iron intake from foods was assessed at week 20 and at week 36 using an iron‐specific validated FFQ; the mean intake was 13 and 14.5 mg/day at the respective timepoint. Adverse GI effects were assessed using a structured telephone interview at 24 and 36 weeks of gestation. As the results presented in the publication for gestational week 36 were on an intention‐to‐treat basis and thus included women who had taken high‐dose supplemental iron because of anaemia (both in the placebo and the intervention group), the Panel only considered for the present assessment the results provided for gestational week 24, i.e. after 4 weeks of supplementation. Compliance was 86% in the iron and 85% in the placebo group. There were no statistically significant differences in individual adverse GI effects. A non‐statistically significantly higher risk of nausea, epigastric pain, hard stools and bowel movements ≤ 3 times per week were reported for the iron‐supplemented group compared to placebo: [RR (95% CI) nausea: 1.13 (0.80–1.61), n = 51/204 vs. 45/204, stomach pain: 1.21 (0.83–1.76), n = 47/204 vs. 39/204, hard stools: 1.12 (0.73–1.74), n = 36/204 vs. 32/204, bowel movements ≤ 3 times per week: 1.49 (0.74–3.02), n = 18/204 vs. 12/203]. For the remaining symptoms (heartburn, vomiting and black stools), no increased risk associated with iron supplementation was reported. When all reported complaints were summed up and expressed as a percentage of overall responses (calculation performed by EFSA), the results for this composite outcome were similar among groups (i.e. 19% vs. 18%). A higher frequency of women who, due to subsequent anaemia diagnosis, had taken 100 mg/day iron reported black stools compared to individuals who had either consumed the lower dose or placebo (11% vs. 0.3%) and hard stools (23% vs. 13%). One participant who had consumed 20 mg/day iron reported black stools after gestational week 24.
The Panel notes that this study does not show an effect of consuming 20 mg/day iron as ferrous sulfate compared to placebo between meals on adverse GI effects. Apart from one participant, none reported the occurrence of black stools during the whole duration of the study of around 20 weeks.
McKenna et al. (2003) randomised 102 pregnant women, who were non‐compliant with the routinely prescribed supplementation of 200 mg/day of ferrous sulfate, to either iron‐rich water preparation (corresponding to approximately 10 mg of iron/day) or placebo, to be consumed for 4 weeks with the intervention starting at the 22nd week of gestation. Participants were instructed to take the iron half an hour before breakfast and were advised to dilute the contents in orange juice. GI effects were assessed via a modified version of the Glasgow Dyspepsia Severity Score (mGDSS), that apart from epigastric pain, bloating, indigestion, fullness, nausea and vomiting also asked about constipation symptoms. Thirty women stopped the supplementation before reaching the primary endpoint (17 in the iron and 13 in the placebo group). Compliance was reported as 57% the intervention group (29 of 51) and 67% in the placebo group (35 of 51). No statistically significant difference in the mean mGDSS was seen between the intervention [mGDSS 22 weeks of gestation: 3.54 (± 2SD 3.48), mGDSS 26 weeks: 3.51 (± 2SD 3.38)] and the placebo group [mGDSS 22 weeks of gestation: 1.86 (± 2SD 2.06), mGDSS 26 weeks: 1.54 (± 2SD 1.95)].
The Panel notes the low compliance in this study and that the supplementation of 10 mg/day iron in the form of an iron‐rich water preparation did not show an effect on the mGDSS which, however, does not specifically assess GI effects related to iron supplementation.
In summary, the panel notes that nine out of 13 studies which used either interviews, questionnaires or other standardised tools to assess adverse GI effects associated with iron supplementation showed adverse GI effects when more than 50 mg/day of supplemental iron was consumed as ferrous sulfate, ferrous fumarate or ferrous bisglycinate. The RoB of these studies ranged from low to high. Studies were judged as high RoB mainly as a result of insufficient reporting in the older publications.
There were two studies in which no effect of iron supplementation at doses of 50–65 mg/day on adverse GI effects was observed. In one study (Tiekou Lorinczova et al., 2022), more individuals in the placebo group experienced adverse GI effects than in the iron‐supplemented group at doses of 18 mg/day and 65 mg/day iron as ferrous sulfate (personal communication). The inconsistency in the findings with the other available studies on non‐pregnant adults cannot be explained. The other study (Milman et al., 2006), which was set up as a dose–response study in pregnant women with supplementation of 20, 40, 60 or 80 mg/day iron in the form of fumarate, did not show a relationship between the dose administered and the occurrence of adverse GI effects. From the study by Tiekou Lorinczova et al. (2022) and two additional studies (Makrides et al., 2003; McKenna et al., 2003), there is some evidence that at doses of supplemental iron intakes ≤ 20 mg/day as ferrous sulfate or iron‐rich water adverse GI effects do not occur in pregnant women. Data in non‐pregnant adults at these doses are lacking. Apart from the dose–response study by Milman et al. (2006), no other study investigated the effect of iron doses between 20 and 50 mg/day and no reliable conclusions can be drawn for this dose‐range.
There is some evidence for a dose‐related increase in the occurrence of black stools following iron supplementation. The dose–response study in pregnant women described above (Milman et al., 2006), showed that the percentage of women experiencing black stools started to increase at supplemental doses of 40 mg/day. This was also supported by Makrides et al. (2003) who did not observe an effect of iron supplementation of 20 mg/day vs. placebo on black stools and by Milman et al. (2014) where the occurrence of black stools in the group consuming 25 mg/day supplemental iron remained constant from baseline to the end of the study. The background iron intake of the participants was assessed in only one of the three studies (Makrides et al., 2003) and was between 13 and 14.5 mg/day.
3.5.4.3. Proposed mechanisms
It has been observed in humans that iron supplementation leads to deposition of iron within the epithelium and lamina propria, and results in gastric erosion (Haig & Driman, 2006; Ji & Yardley, 2004; Kaye et al., 2008; Laine et al., 1988; Marginean et al., 2006; Parfitt & Driman, 2007; Scarpignato & Bjarnason, 2019; Zhang et al., 2009). An increase in the generation of reactive oxygen species (ROS) has also been observed in the presence of unabsorbed iron in the gut in ex vivo studies (Lund et al., 1999; Orozco et al., 2012). In rodent studies, it has been shown that unabsorbed iron can lead to the exacerbation of pre‐existing inflammation (Carrier et al., 2002; Mahalhal et al., 2018; Seril et al., 2002; Werner et al., 2011), but findings in humans are inconsistent (Dostal et al., 2014; Jaeggi et al., 2015; Paganini et al., 2017; Simonyté Sjödin et al., 2019; Zimmermann et al., 2010). In addition, some studies mainly stemming from infants and young children living in lower income countries show that unabsorbed iron in reaching the colon can alter the composition of the gut microbiome decreasing the number of beneficial barrier commensal gut bacteria and increasing the abundance of enterobacteria (Paganini & Zimmermann, 2017).
3.5.4.4. Conclusions on gastrointestinal effects
The panel notes that most studies showed adverse GI effects when more than 50 mg/day of supplemental iron was consumed as a single dose in the form of ferrous sulfate, ferrous fumarate or ferrous bisglycinate. However, the percentage of individuals presenting with adverse GI effects was very variable and seemed not to be related to the dose administered, which ranged from 10 to 222 mg/day. This lack of a dose–response relationship cannot be explained by the different study designs, the RoB of the studies or the forms of iron used. Although the variability might be partly caused by the fact that, in some studies, the daily dose was subdivided into multiple daily doses, this cannot explain the lack of a relationship with the dose. The percentage of individuals with adverse GI effects within a study might be influenced by the different study populations (e.g. blood donors, pregnant women, non‐pregnant adults of the general population). Other individual characteristics could lead to a different tolerance to iron supplementation and might also explain that individuals respond with different symptoms to supplementation. However, the limited data available do not allow the investigation of these hypotheses.
When supplemental iron was given in doses of ≤ 20 mg/day, there is some evidence that GI symptoms do not occur.
It is plausible that a threshold between 20 and 50 mg/day of supplemental iron intake exists, below which adverse GI effects are less likely to occur. The dose below which adverse GI effects do not occur may depend on the form of iron used for supplementation and on the characteristics of the individuals taking the supplements. However, the available data are insufficient to investigate this.
The Panel also notes that there is some evidence of black stools occurring at supplemental iron intakes ≥ 40 mg/day, while no occurrence of black stools was reported at a supplemental iron intake of 20–25 mg/day. These data come from three studies, all conducted in pregnant women, in Denmark and Australia. The background iron intake of the participants was assessed in only one of these studies, in which the mean iron intake was estimated to be 13–14.5 mg/day. The presence of black stools is not considered an adverse health effect per se but is an indicator of the presence of large amounts of unabsorbed iron in the GI tract.
3.5.5. Adverse effects of iron supplementation in infants and young children
In infants younger than about 9 months of age, iron homeostasis is incompletely developed, with less capacity to downregulate iron absorption in response to an increased iron intake (Donker et al., 2021; Georgieff et al., 2019; Lönnerdal, 2017; Lönnerdal et al., 2015), in contrast to the adult general population. By 9 months of age, some homeostatic regulatory capacity has developed, but the extent of control of iron absorption with increased iron intake in young children is unknown. Several studies have found associations between iron supplementation in infants and young children with adverse health outcomes (Dewey et al., 2002; Domellöf et al., 2001; East et al., 2021; Gahagan et al., 2019; Lind et al., 2008; Lozoff et al., 2012). Adverse health outcomes which had been observed in relation to iron supplementation included lower growth rates, an increased risk for diarrhoea and other infections as well as less favourable cognitive development than non‐iron‐supplemented infants and children.
Eligible studies for the present assessment were RCTs (protocol amendment 2) in which iron‐replete non‐anaemic and non‐malnourished infants ≥ 4 months of age and young children (up to 3 years of age) received known doses of oral supplemental iron in the form of supplements or fortified foods, and were compared to an appropriate control group (either placebo or another chemical form of iron, but not a formula with lower iron content than the one investigated). Studies were excluded if there was a co‐intervention that was not the same between groups and if it was not possible to determine if iron deficient infants or children had been included in the study. Pertinent studies related to this outcome were retrieved through systematic searches performed by a contractor (Parlesak et al., 2024), complementary searches performed by EFSA, and by manual search in the reference list of pertinent systematic reviews.
For the purpose of identifying eligible studies for the assessment, the definitions of iron sufficiency, iron deficiency, iron deficiency anaemia and anaemia used by the authors of the publications were taken over.
Some of the studies cited above which had led to the identification of the outcomes clustered in this section as priority adverse health effects did not meet the inclusion criteria for the present assessment, mostly because the study population included iron‐depleted or iron‐deficient infants, or the iron status of the infants was not reported.
No eligible studies which investigated the outcome ‘asthma or respiratory function’, as foreseen in the protocol, were retrieved.
3.5.5.1. Growth
Besides the systematic review performed by the contractor (Parlesak et al., 2024), a systematic review conducted by the US Department of Agriculture (Dewey et al., 2020) on the relationship between supplemental iron consumed during infancy and young childhood and weight, length and body composition was used as a source of evidence.
Seven studies were retrieved. At the step of data extraction, two publications were excluded. Esamai et al. (2014) reported in the discussion section that there was a high incidence of inflammation in the study population and thus SF concentrations, even though in the reference range, were not reliable markers of iron status. In addition, the elevated sTfR concentrations were indicative of infants being iron depleted. Hacihamdioglu et al. (2013) studied infants whose weight at 4 months of age was on average (SD) 4.5 (0.4) kg in the intervention and 4.7 (0.3) kg in the control group. This mean weight was around −3 SD away from the median of the WHO growth reference standards, while length and head circumference were close to medians of the reference standards. The authors had described the infants as healthy. As the Panel considered that results from severely underweight infants at baseline, even if healthy, could not be extrapolated to the European setting, the study was excluded.
For the risk of impaired growth, impaired weight gain and impaired length gain are included in standalone main LoEs.
Preliminary UA
Five intervention studies on infants and young children aged between 4 months and 2 years remained for assessment. The results of studies with respect to weight gain are also shown in Figure 8A. Baseline characteristics and results for length gain are depicted in Figure 8B.
FIGURE 8.
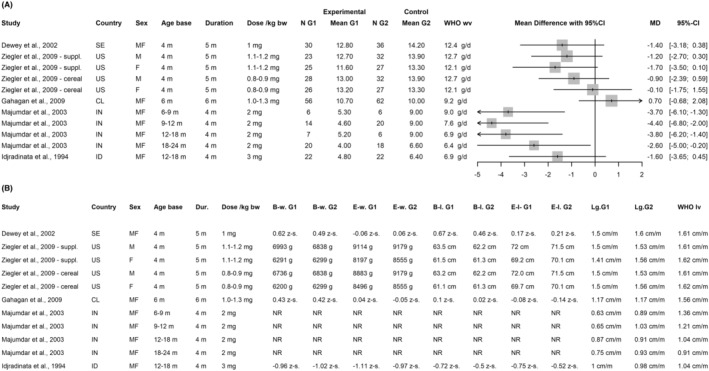
Intervention studies investigating the effect of iron supplementation on infant growth. (A) Weight gain per day in the study period. (B) Weight at baseline and the end of the study either as absolute weight or WAZ and length gain. Median weight and length gains of infants within the studied age range and averaged over the studied time period from the WHO growth reference standard are also given. For the study by Majumdar et al. (2003), SE for the individual age groups were imputed using the SE for the combined age groups. Weight and length gains of individual age groups were read from graphs. For Gahagan et al. (2009), length gains were read from a graph. For Ziegler et al. (2009) and Gahagan et al. (2009), the doses of iron supplements expressed as mg/kg bw were calculated based on the absolute weights of infants at the beginning as well as at the end of the studies. Base, baseline; B‐l, baseline length; B‐w, baseline weight; bw, body weight; CI, confidence interval; CL, Chile; Dur, duration; E‐w, end weight; E‐l, end length; F, females; G1, intervention group; G2, control group; ID, Indonesia; IN, India; Lg, length gain; Lv, length velocity; M, males; m, months; MD, mean difference; N, number; SE, Sweden; suppl.; supplement; US, United States of America; WHO, World Health Organization; wv, weight velocity; z‐s, z‐scores.
Studies in infants starting iron supplementation at 4 months of age
Dewey et al. (2002) analysed two populations, 96 infants in Sweden and 118 infants in Honduras. Originally, 121 infants had entered the study in Sweden and 142 in Honduras. In both sites, the infants were randomised to three groups at 4 months of age: a group receiving placebo from 4 to 9 months of age (completers: n = 36 in Sweden and n = 42 in Honduras), a group receiving placebo from 4 until 6 months and iron supplements (1 mg/kg bw/day) from 6 to 9 months of age (n = 30 in Sweden and n = 36 in Honduras) and a group receiving iron supplements from 4 to 9 months of age (n = 30 in Sweden and n = 40 in Honduras). No information on the sex distribution within the study groups was given in the publication. In both sites combined, four infants had SF concentrations < 12 μg/L at baseline. In the Swedish population, in the group who received iron supplements from 4 to 9 months, all but three had SF concentrations ≥ 50 μg/L and none had Hb concentrations < 110 g/L. In the placebo and the iron‐supplemented group consuming the supplement from 6 to 9 months, a total of 10 infants had Hb concentrations < 110 g/L and 14 had SF concentrations < 50 μg/L. The cut‐off of 50 μg/L was based on the 25th percentile of SF concentrations in the combined sites because of the low number of infants who had SF concentrations below the typical cut‐off for low SF, i.e. < 12 μg/L. In Honduras, 51 infants in all groups combined had Hb concentrations < 110 g/L. Therefore, the population studied in Honduras did not meet the inclusion criteria of the present review and the results obtained in this population were not further considered. For Sweden, the comparison between the group supplemented with iron from 4 to 9 months which was reported to have been non‐anaemic and iron‐replete and the placebo group is used in the present assessment. The Panel notes that the fact that some infants in the placebo group presumably had Hb concentrations < 110 g/L could potentially attenuate the outcome of the analysis with respect to growth, if it is assumed that anaemia has an independent effect on growth which is in the same direction as the effect of iron supplements. Compliance was assessed by diaries and by returned bottles. Compliance was 95% at 4–6 months and 96% at 6–9 months. Weight‐for‐age z‐scores (WAZ) at baseline was higher in the group supplemented with iron from 4 to 9 months with a mean ± SD of 0.62 ± 0.78 compared to 0.49 ± 0.84, as were length‐for‐age z‐scores (LAZ) (0.67 ± 0.76 vs. 0.46 ± 0.65). Weight gain from 4 to 9 months was on average 12.8 g/day in the group having consumed iron from 4 to 9 months and 14.2 g/day in the placebo group, the difference not being statistically significant. Length gains were 1.5 and 1.6 cm/month, respectively, with no statistically significant difference. When only the time period of 6–9 months was considered, length gain in Swedish infants was significantly lower in infants who had consumed iron supplements from 4 to 9 months compared to placebo. Lengths gains during this period were 1.3 and 1.6 cm/month, respectively.
The panel notes that infants in the group who consumed iron supplements at a dose of 1 mg/kg bw per day from 4 to 9 months gained 1.4 g/day less weight than the placebo group over the 5‐month study period. The infants in the iron‐supplemented group were slightly heavier and taller at baseline than the infants in the placebo group which can partly explain the slower weight gain with both groups reaching WAZ of around 0 (−0.06 in the iron supplemented and 0.06 in the placebo group) at the end of the study. Length gain was on average 1 mm per month less in the iron‐supplemented group, which is not of biological relevance. The panel notes that growth rates in the iron‐supplemented group were compatible with the WHO growth reference standards and that mean differences in weight gain were moderate when considering that the average weight gain of an infant at that age is around 12 g/day (based on the WHO growth reference standards). This is despite the fact that the 95% CI calculated by EFSA (see Figure 8) included the difference of 3 g/day which is considered to be a biologically relevant difference in growth in infants in the first months of life when averaged over 3–4 months. The presence of up to 10 anaemic infants out of 36 infants in the placebo group (distribution of anaemic infants between the placebo and the group receiving iron supplements from 6 to 9 months not reported) could have affected the results towards a smaller difference.
In the USA, Ziegler et al. (2009) randomised 152 apparently healthy predominantly breast‐fed infants at 4 months of age to consume either 7.5 mg/day iron as supplement (n = 48) from 4 to 9 months as long as the infant was breast‐fed, 7 mg daily iron in iron‐fortified cereal (n = 45), or their habitual diet (with no iron supplements) (n = 59). The Panel notes that the iron dose administered in the study amounted to an average of about 1.1–1.2 mg/kg bw per day at the beginning of the study and around 0.8–0.9 mg/kg bw per day at the end of the study. The Panel also notes that one infant in the iron supplement and one infant in the control group were iron deficient (SF < 10 μg/L) at the time of randomisation. Thus, this study does not fully comply with the inclusion criteria of EFSA's systematic review. However, the Panel considers that the inclusion of these two infants with iron deficiency in the study does not influence the study results. Compliance was assessed by weighing returned bottles of the liquid supplement and by counting returned empty jars of the cereal. Six infants in the iron supplement group, seven in the cereal group and three in the control group did not complete the study. In addition, only 35 out of 42 infants were still partly breast‐fed at 9 months, as reported in a table, and received the iron drops. The Panel notes that the authors report in the text on three infants who did not receive iron because mothers decided to stop breast‐feeding and the discrepancy between the table and the text could not be explained. Weight gain from 4 to 9 months was significantly less in the iron‐supplemented group than the control group (12.2 vs. 13.6 g/day) with a more pronounced difference in girls. This was not the case for the group consuming the fortified cereal in which the weight gain was 13.1 vs. 13.6 g/day with a more pronounced difference in boys (see Figure 7). When adjusting for sex, the effect of the iron supplement on weight gain was not statistically significant. Length gain was significantly lower in the iron‐supplemented group, also after adjustment for sex, compared to the control group (0.48 vs. 0.52 mm/day). There was no significant difference in length gain between the group consuming the iron fortified cereal and control (0.50 vs. 0.52 mm/day). There was no significant difference in weight or length gain during the second year or at the end of the follow‐up at 2 years of age (data not provided in the publication).
The Panel notes that infants in the group who consumed iron supplements at a dose of around 0.8 to 1.2 mg/kg bw per day from 4 to 9 months gained 1.4 g/day less weight than the placebo group over the 5‐month study period with a bigger difference in girls than in boys. A similar dose consumed in an iron‐fortified cereal led to a difference in weight gain between the group receiving iron and the control group of 0.45 g/day with a bigger difference in boys than in girls. Average length gain differences were at most 1.5 mm per month less between the intervention and the control groups, which is not of biological relevance. The panel notes that growth rates in both groups were within the normal range and that mean differences in weight gain were moderate when considering that the average weight gain of an infant at that age is around 12 g/day (based on the WHO growth reference standards). This is despite the fact that the 95% CI calculated by EFSA (see Figure 8) included the difference of 3 g/day which is considered to be a biologically relevant difference in growth in infants in the first months of life when averaged over 3–4 months. The Panel notes that the results of this study are not consistent with respect to the iron‐supplemented group and the group consuming iron‐fortified cereal and between boys and girls. At least three infants in the group consuming iron supplements stopped breast‐feeding during the intervention and did not continue to receive supplements. These were in addition to six infants who dropped out in the iron‐supplemented group during the intervention. Thus, at least 9 out of 48 infants did not receive the anticipated iron dose for the whole study duration in this group which might have had an impact on the outcome. Length gain in the iron‐supplemented group was on average around 1 mm per month less in the iron‐supplemented group than in the placebo group. The group consuming the fortified cereal showed an around 0.5 mm per month lower length gain than the placebo group.
The Panel notes that, in both studies, 4‐month‐old infants received iron supplements at a dose of around 1 mg/kg bw per day for 5 months. In the iron‐supplemented groups, weight gains were on average 1.4 g per day lower than in the unsupplemented groups. The iron‐supplemented group also showed lower length gains with a difference of at most 1.5 mm per month, which is not of biological relevance. The difference was less when iron was consumed at a similar dose in form of a fortified cereal, which cannot be explained. Also, the different findings in boys and girls cannot be explained.
Studies in infants starting iron supplementation at 6 months of age
Gahagan et al. (2009) retrospectively selected infants who were iron‐replete from a bigger trial conducted in Chile which aimed at preventing iron deficiency anaemia (Lozoff et al., 2003). Iron sufficiency was defined as capillary Hb ≥ 128 g/L or venous Hb ≥ 110 g/L with at least 2 of 3 iron measures in the sufficient range (mean corpuscular volume ≥ 70 fL, erythrocyte protoporphyrin < 1.77 mmol/L red blood cells (RBC), SF ≥ 12 mg/L). In the original trial, infants had been randomised to groups consuming from 6 to 12 months of age either the habitual diet or additional iron. This additional iron in an amount of 10 mg/day (amounting to an iron supplementation of around 1.0–1.3 mg/kg bw per day) was either given as supplement or as formula, depending on whether the infant had already started formula feeding in an amount of at least 250 mL per day. Infants who had consumed 10 mg/day iron (n = 56, 31 females) from 6 to 12 months of age had mean ± SD WAZ at 6 months of age of 0.43 ± 0.84 and 0.04 ± 1.00 at 12 months of age, amounting to a decrease in WAZ of on average 0.39 z‐scores. Those who had consumed the habitual diet (n = 62, 35 females) had a WAZ of 0.42 ± 0.73 at 6 months of age and − 0.05 ± 0.91 at 12 month of age, which is a decrease of on average 0.47 z‐scores. Adjusted mean differences in weight gain (95% CI) were 60 (−260 to 380) g over the study period. The non‐supplemented group gained, on average, 10 (95% CI 9–11) g per day. The iron‐supplemented group gained, on average, 0.67 (−0.33 to 2) g/day more than the non‐supplemented group. LAZ decreased in this time period in the iron‐supplemented group from 0.10 ± 0.68 to −0.08 ± 0.80 (an average decrease of 0.18 z‐scores) and in the group consuming the habitual diet from 0.02 ± 0.86 to −0.14 ± 0.70 (an average decrease of 0.16 z‐scores) with no statistically significant differences between groups.
At 12 months, infants with iron deficiency anaemia from the control group were switched to the intervention group and randomly selected non‐anaemic infants were also added to the intervention group and given 30 mg/day iron. In addition, results of a study were described in the publication in which anaemic infants and a comparison group of non‐anaemic infants were given iron drops or iron‐fortified formula at a dose of 15 mg/day. The Panel notes that information on randomisation of infants to the intervention and control groups is lacking for these two studies. Owing to the doubt about the studies being randomised interventions, the results of these two studies described by Gahagan et al. (2009) have not been used in the present assessment.
The Panel notes that infants who consumed 1.0–1.3 mg/kg bw per day iron as supplement or formula from 6 to 12 months of age had similar weight and length changes to infants in the control group consuming their normal diet. The iron group tended to have a slightly higher weight gain (on average 0.67 g/day more) and length gain (on average 0.02 z‐scores less) than the control group, which is not of biological relevance. There is uncertainty as to whether the subselection of iron‐replete infants from a bigger study properly maintained randomisation.
Studies in infants and young children
Majumdar et al. (2003) originally included 189 iron‐replete and iron‐depleted infants without malnutrition into a study in New Delhi, India, of which 39 did not complete the study. Completers included 105 boys and 45 girls. Iron sufficiency was defined as Hb > 110 g/L, SF > 12 μg/L and TSAT > 10%. The exact distribution of dropouts between iron‐replete and iron depleted infants was not reported. The final iron‐replete group was made up of 100 apparently healthy children who were 6–24 months old and who were randomised after the subselection to receive either iron supplements (2 mg/kg bw per day, form not reported; n = 50) or placebo (n = 50) for 4 months. This would have allowed to study the effect of iron supplementation on growth at difference ages. The majority of children belonged to the age ranges 9–12 months (n = 14 in the iron‐supplemented group and n = 20 in the non‐supplemented group) and 18–24 months (n = 20 and 18, respectively). In the 6–9 months of age group, there were nine and six infants, respectively, and in the 12–18 months of age group, seven and six infants, respectively. No information on the sex distribution within the study groups was given in the publication. Baseline characteristics of infants, including weight at baseline, were not given in the publication. Compliance was assessed every 14 days (method and results not reported). Mean weight gain for the intervention group was significantly lower compared to the control group (mean, measure of variability not defined in the publication 4.7 ± 0.83 vs. 8.3 ± 0.9 g/day, average difference − 3.6 g per day). Mean length gain of the intervention group was also significantly lower compared to the control group (0.69 ± 0.11 vs. 0.97 ± 0.11 cm/month, average difference: −2.8 mm per month). Average weight gain in the different age subgroups was: 6–9 months: intervention 5.3 g/day vs. control 9 g/day (mean difference of −3.7 g/day); 9–12 months: 4.6 g/day vs. 9 g/day (mean difference of −4.4 g/day); 12–18 months: 5.2 g/day vs. 9 g/day (mean difference of −3.8 g/day) and 18–24 months: 4 g/day vs. 6.6 g/day (mean difference of −2.6 g/day). Average length gains were in the 6–9 months of age group 0.63 cm/month vs. 0.89 cm/month (mean difference of −2.6 mm/month), in the 9–12 months of age group: 0.65 cm/month vs. 1.03 cm/month (mean difference of −3.8 mm/month), in the 12–18 months of age group: 0.87 cm/month vs. 0.91 cm/month (mean difference of −0.4 mm/month) and in the 18–24 months of age group 0.75 cm/month vs. 0.93 cm/month (mean difference of −1.8 mm/month).
The Panel notes that this study shows a biologically relevant average lower weight gain of −3.6 g/day in iron‐replete infants and young children supplemented with iron at a dose of 2 mg/kg bw per day for 4 months compared to the control group. In addition, length gain was 2.8 mm per month lower in the iron‐supplemented group than in the control group. However, the Panel notes the higher than average weight gains of 9–12 and 12‐ to 18‐month‐old infants and young children in the control group (9 g/day in both age groups vs. a median of the WHO growth reference standard of 7.6 and 6.9 g/day, respectively) and that the lack of baseline characteristics of participants, especially, with respect to weight and length hampers the interpretation of the findings (Figure 8). Finally, the Panel notes that length gain was below average in all age groups apart from the age group 18–24 months (length gain in cm per month in the control groups vs. median of the WHO growth reference standard: 0.89 vs. 1.36, 1.03 vs. 1.21. 0.91 vs. 1.04 and 0.93 vs. 0.91). The length gain in the control group of the 6‐9‐month‐old infants was below the 5th percentile of the WHO growth reference standards (i.e. 0.95 cm per month), see Figure 8.
Idjradinata et al. (1994) studied 47 apparently healthy iron‐replete children 12–18 months of age from middle‐class urban families in Indonesia, who had been part of a larger randomised study on the impact of iron deficiency anaemia on developmental outcomes. They received iron supplements (3 mg/kg bw per day; n = 24, 16 females) or placebo (n = 23, 11 females) for 4 months. Iron sufficiency was defined as Hb > 120 g/L, TSAT > 10% and SF > 12 μg/L. In each group, 22 children completed the study. Information on compliance assessment was not provided in the publication. At baseline, weight in the iron‐supplemented group was on average (measure of variability not defined in the publication) 9.18 (0.21) kg and in the control group 9.36 (0.16) kg. WAZ was −0.96 (0.18) and − 1.02 (0.13), respectively. At the end of the 4‐month intervention period, weight was 9.76 (0.24) kg and 10.13 (0.06) kg, respectively, with a weight gain of 0.58 (0.06) kg (4.8 g/day) and 0.77 (0.11) kg (6.4 g/day; mean difference of −1.6 g/day). WAZ declined in the iron‐supplemented group by 0.14 (0.05) and increased in the control group by 0.05 (0.09) z‐scores. Length at baseline was 75.3 (0.7) cm and 76.8 (0.7) cm, respectively, which increased by on average 4.0 (0.3) cm and 3.9 (0.3) cm over 4 months (mean difference of 0.25 mm per month). LAZ was −0.72 (0.16) and − 0.50 (0.20) at baseline and changed by −0.03 (0.11) and − 0.02 (0.11) z‐scores until the end of the study.
The Panel notes that this study shows an average lower weight gain of −1.6 g/day in iron‐replete infants and young children supplemented with iron at a dose of 3 mg/kg bw per day for 4 months compared to no iron supplementation. Length gain was similar between groups.
The Panel notes that four out of five studies show lower weight gain in infants and young children having received supplemental iron with mean differences in weight gain ranging from −0.1 to −4.4 g/day compared with the normal diet. In studies showing a lower weight gain, the 95% CI included the difference of 3 g/day. A difference in weight gain of 3 g/day is considered to be a biologically relevant difference in growth in infants in the first months of life when averaged over 3–4 months, even though mean differences were mostly moderate. Differences in length gain in most studies were mostly in the range of a mean difference of 1–2 mm per month and therefore considered of no biological relevance.
The Panel considers that the available BoE suggests a positive relationship between the intake of iron supplements and impaired growth in iron‐replete infants and young children.
Comprehensive UA
The Panel selects body weight gain as the key endpoint for the comprehensive UA.
Risk of bias appraisal. Five RCTs met the inclusion criteria, three of which were assessed at high RoB (Tier 3) and two at moderate RoB (Tier 2).
TABLE 7.
Outcome of the risk of bias appraisal of RCTs on infant growth.
| References | Risk of bias domains | ||||||||
|---|---|---|---|---|---|---|---|---|---|
| Randomisation (key) | Concealed allocation | Blinding | Attrition/exclusion | Exposure (key) | Outcome (key) | Selective reporting | Other sources of bias/statistics | Tier | |
| Ziegler et al. ( 2009 ) | + | NR | − | + | − | + | + | − | 3 |
| Gahagan et al. ( 2009 ) | − | NR | − | − | − | + | + | + | 3 |
| Majumdar et al. ( 2003 ) | + | + | + | − | NR | NR | − | − | 3 |
| Dewey et al. ( 2002 ) | + | NR | NR | − | + | + | ++ | − | 2 |
| Idjradinata et al. ( 1994 ) | − | NR | + | + | NR | + | + | NR | 2 |
Abbreviations: +, low RoB; −, high RoB; NR, not reported.
The reasons for a high RoB judgement other than deriving from non‐reported items are outlined in the following. When baseline characteristics of participants were not sufficiently reported, this was noted as ‘not reported’ in this item. If in addition, other issues were identified in the description of the study, the item was judged as probably high RoB.
Ziegler et al. ( 2009 ):
Blinding: The study is described as open‐label study.
Exposure: Compliance assessment was performed. However, once infants stopped breast‐feeding the consumption of iron drops was stopped. According to a table in the publication, 35 of 42 infants were still breast‐fed at 9 months and seven seemed not to have received the iron drops anymore. This is in discrepancy to the text where three infants were mentioned in this relation. The authors reported that there was a tendency to consume more than the 0.3 g/day of the iron drops and that consumption ranged from 0.08 to 1.15 g/day (average 0.47 g/day) in the first 28 days and from 0.10 to 1.1 g/day in the last 28 days of the study with an average of 0.41 g/day. In the cereal group, the consumption ranged from 0.15 to 1.0 jars/day (average 0.79) in the first 28 days and from 0.43 to 1.0 jars/day (average 0.92) thereafter. Therefore, there is uncertainty how many infants indeed consumed the anticipated dose.
Other sources of bias: During the time of the study, infants were gradually introduced to complementary foods, including some formula. Given that no information on the overall iron intake is provided, it is unclear how much other iron sources contributed to the overall iron intake and whether this was comparable between groups. Baseline characteristics of participants were not reported in the publication apart from information on the iron status.
Gahagan et al. ( 2009 ):
Randomisation: Infants analysed in this publication were part of a larger randomised study in which iron status was not a stratification factor. Therefore, conducting a subanalysis in these infants may have violated the principle of randomisation, even though the limited number of baseline characteristics which are reported are balanced, except for LAZ.
Blinding: There were different vehicles used for supplementation (i.e. formula and iron drops). The study is described as double‐blind. However, it is not reported whether blinding was maintained throughout the study which would be an important piece of information considering the complex study design.
Attrition/exclusion from analysis: A total of 142 infants were iron sufficient at 6 months of age and were subselected from the bigger RCT. However, only 118 were included in the analysis, i.e. the ones who had growth data at 10 years which is an observational follow‐up period of the study not considered in the present assessment. Therefore, 17% of originally eligible infants were not included in the analysis.
Exposure: Compliance assessment was performed. However, the outcome of the assessment is not reported, and the intervention consisted of formula in some participants and of drops in others.
Majumdar et al. ( 2003 ):
Attrition/exclusion from analysis: A total of 14% of children were lost to follow up or excluded, but there is no information on the reasons why and in which group children were lost.
Selective reporting: Outcomes for results in the individual age groups are only reported as histogram but are lacking information on the SD. Given also that the number of children in the different age ranges is uneven, this information would be important to assess the results.
Other sources of bias: Information on the baseline characteristics, also in relation to anthropometric measurements, is hampering the interpretation of the results.
Dewey et al. ( 2002 ):
Attrition/exclusion from analysis: Around 20% of infants dropped out in Sweden. Reasons for dropouts were not reported. It is described that infants who dropped out had similar characteristics than those who remained in the study.
Other sources of bias: During the time of the study, infants were gradually introduced to complementary foods, and it is unclear how much these contributed to the overall iron intake and whether the contribution was comparable between groups. The authors reported that complementary food intake was assessed, but the outcome was not reported. Baseline characteristics of participants were not reported in the publication apart from anthropometric measures.
Idjradinata et al. ( 1994 ):
Randomisation: Even though the study was reported as randomised, there was a large imbalance in gender between groups and a difference in baseline LAZ, which casts some doubt on whether randomisation was successful.
Publication bias. The funnel plot did not indicate publication bias. However, the Panel notes the low number of studies and the related risk for false negatives.
Dose–response relationship. All but two studies used the same supplemental dose of 1 mg/kg bw per day. Even though the study using 2 mg/kg bw per day (Majumdar et al., 2003) showed a greater difference in weight gain than the studies using the lower doses, the children in the control group in the age ranges 9–12 months and 12–18 months showed higher than average weight gains (i.e. 9 g/day in both age groups as compared to the median of the WHO growth standard of 7.6 and 6.9 g/day). Children in the iron‐supplemented group of these age categories showed on average weight gain below the median of the WHO growth reference standards (4.6 and 5.2 g/day). However, the higher than average weight gain in the unsupplemented group of infants in these age categories may explain the larger differences in weight gains in this study, compared to the others rather than a dose effect. The panel also notes the lower than average length gains in this study in all age groups, except for 18‐ to 24‐month‐old infants. In the study by Idjradinata et al. (1994) in which 3 mg/kg bw per day were administered, weight gain differences were in the same range as in the other studies. Overall, the data are not sufficient to conclude whether a dose–response relationship exists.
Consistency across LoEs. Findings regarding impaired weight gain are not supported by findings regarding length gain.
Mechanism. It has been proposed that an interaction with zinc, which is required for growth, could affect growth (Lönnerdal et al., 2015). However, this is inconsistent with the conclusions of the Panel in Section 3.5.7 on the effect of iron supplementation on zinc absorption. Iron supplementation might reduce the absorption of zinc only when the two nutrients are consumed simultaneously on an empty stomach, and this was not the case in the studies included in the assessment of growth.
Outcome of the comprehensive analysis of the uncertainties (Table 8 )
TABLE 8.
Comprehensive analysis of the uncertainties.
| What is the level of certainty that the intake of iron supplements is causally related to impaired growth in iron‐replete infants and young children? | ||
|---|---|---|
| BoE |
Endpoint: Weight gain Five RCTs, 545 infants and children (4–24 months of age). Four out of five studies show lower weight gain in infants and young children having received supplemental iron with mean differences in weight gain ranging from −0.1 to −4.4 g/day |
Initial certainty: High (> 75–100% probability) |
| Domain | Rationale | Evaluation |
|---|---|---|
| RoB |
Two studies in Tier 2 (moderate RoB), 3 studies in Tier 3 (high RoB) (Table 7).
Key questions:
Concealed allocation, blinding and attrition/exclusion from analysis: mostly high RoB; selective reporting: mostly low RoB |
Serious |
| Unexplained inconsistency | Except in one study, point estimates are in the same direction. However, mean effect estimates vary across studies (independent from the dose) and confidence intervals show some overlap. Results for different forms of iron supplementation (i.e. iron supplements vs. fortified food) within the same study and for the male and the female sub‐population give divergent results | Serious |
| Indirectness |
No concern regarding the directness of the endpoint (weight) Regarding the study populations: All studies were conducted in healthy iron‐replete populations without signs of malnourishment. Even though four out of five studies were not conducted in Europe, the Panel considers that the study populations and the study settings allow the extrapolation of results to the target population of healthy iron‐replete infants living in Europe |
Not serious |
| Imprecision | The number of infants per group ranged from 6 to 62, mostly around 30 children per group. On the one hand, CIs of individuals studies are wide; however, they only marginally cross the line of the null effect | Not serious |
| Publication bias |
The funnel plot does not indicate publication bias Funding sources were public in five studies mostly with intervention products donated by manufacturers. For one study (Majumdar et al., 2003), the funding source was not reported |
Not detected |
| Upgrading factors |
Dose–response: cannot be characterised based on the available BoE Consistency across LoEs: Findings regarding impaired weight gain are not supported by findings regarding length gain Magnitude: In studies showing an effect on weight gain, the 95% CI included the difference of 3 g/day. A difference in weight gain of 3 g/day is considered to be a biologically relevant difference in growth in infants in the first months of life when averaged over 3–4 months, even though mean differences were mostly moderate. However, the uncertainties around the findings of the studies are high. Therefore, magnitude was not considered in the upgrading of the certainty |
None identified |
| Final certainty | Started ‘high’. Serious concerns identified regarding RoB and unexplained inconsistency. Downgraded to ‘low’ | Low (> 15%–50% probability) |
Abbreviations: BoE, body of evidence; CI, confidence intervals; LoE, lines of evidence; RCT, randomised controlled trial; RoB, risk of bias; WAZ, weight for age z‐scores.
Overall conclusions on infant growth
The level of certainty in a causal relationship between high iron intake and impaired growth in iron‐replete infants and young children is low (rationale in Table 8). Because of the low certainty in a causal relationship, infant growth cannot be used as an outcome to set an UL.
3.5.5.2. Cognitive development
Besides a narrative review (protocol amendment 5) performed by the contractor (Parlesak et al., 2024), a systematic review of RCTs served as data source (Pasricha et al., 2013).
A total of two RCTs met the inclusion criteria of the present assessment, as outlined in Section 3.5.5 .
Yalçin et al. (2000) enrolled in Turkey 24 infants at 6 months of age who had Hb concentrations ≥ 110 g/L, SF ≥ 10 μg/L and TSAT ≥ 10%. Eleven were randomly allocated to the intervention (1 mg/kg bw iron per day for 3 months) and 13 to the control group (no supplementation). The Bayley Scales of Infant Development (BSID) were administered at the beginning and the end of the study, i.e. after 3 months of supplementation. Seven and nine infants, respectively, completed the study. There were no statistically significant differences in changes from baseline for the Mental Developmental Index (MDI) and Psychomotor Developmental Index (PDI) scores. The MDI scores increased from a mean (SD) of 80.9 (5.2) to 97.1 (2.9) in the iron‐supplemented group and from 78.3 (5.6) to 96.7 (1.9) in the placebo group. The PDI scores increased from a mean (SD) 29.3 (2.6) to 42.6 (1.9) in the supplemented and from 27.2 (2.2) to 42.6 (2.7) in the placebo group.
The Panel notes that this study does not show an adverse effect of consuming iron supplements for 3 months on cognitive development of 6‐month‐old iron‐replete infants.
Idjradinata and Pollitt (1993) described in Section 3.5.5.1 as Idjradinata et al. (1994) studied in Indonesia 47 iron‐replete young children (Hb ≥ 120 g/L, SF ≥ 12 μg/L and TSAT ≥ 10%) aged 12–18 months, from middle‐class urban families. The iron‐supplemented group received 3 mg/kg bw per day iron as ferrous sulfate (n = 24) for 4 months. The control group (n = 23) received placebo. The BSID were administered before the start of the intervention and immediately after the end of the study. There were no statistically significant differences in changes from baseline for the MDI and PDI scores. The MDI scores increased from a mean (SE) of 105.4 (2.2) to 109.1 (2.2) in the iron‐supplemented group and from 104.7 (2.2) to 106.8 (2.3) in the placebo group. The PDI scores increased from a mean (SD) 105.3 (2.1) to 108.7 (2.1) in the supplemented and from 105.9 (2.2) to 108.3 (2.1) in the control group.
The Panel notes that this study does not show an adverse effect of consumption of iron supplements for 4 months on cognitive development of 12‐ to 18‐month‐old iron‐replete infants.
Overall conclusions on cognitive development
The panel notes that neither of the two RCTs performed in iron‐replete infants and young children showed a detrimental effect of iron supplementation on cognitive development.
The panel considers that cognitive development cannot be used as an outcome for setting an UL for iron.
3.5.5.3. Infections
Two RCTs met the inclusion criteria of the present assessment, as outlined in Section 3.5.5 . They have already been described in Section 3.5.5.1 . The papers reported on incidence of diarrhoea (not further specified) and fever Dewey et al. (2002), and incidence of upper and lower respiratory tract infections and gastroenteritis (Idjradinata et al., 1994). The Panel notes that some of the symptoms investigated are unspecific and therefore might have been of non‐infectious origin.
Dewey et al. (2002) performed an RCT in 101 infants in Sweden and 131 infants in Honduras. Infants received iron supplements of 1 mg/kg bw per day either from 4–9 months or from 6–9 months, or received a placebo. Mothers noted, in a daily calendar, symptoms of illnesses or the diagnosis made by a health care professional. The publication reported on the incidence of diarrhoea and fever episodes. For the incidence of diarrhoea, sub‐group analyses in infants with initial Hb concentrations ≥ 110 g/L were presented for the combined sites and for Honduras only. As only four infants in the overall study had SF concentrations < 12 μg/L at baseline, the Panel considers that the analysed populations in the subgroup analyses were representative of non‐anaemic, iron‐replete infants. The OR (95% CI) for developing diarrhoea was 2.4 (1.0, 5.8) when comparing the groups supplemented with iron (from 4–9 months and from 6–9 months) with placebo, respectively, and 2.7 (1.0; 7.0) when combining the results from both study sites. In Honduras, the respective ORs were: 1.5 (0.5; 4.4) and 2.4 (0.5; 8.3). For Sweden, results were reported for the overall population in terms of percentage of infants with at least one episode of diarrhoea. In the group assigned to iron from 4 to 9 months, 30% of iron‐supplemented infants and 14% of infants in the placebo group had at least one episode of diarrhoea during these 5 months. In Sweden, at least one episode of fever occurred in the 67% of infants in the iron‐supplemented group and 81% of infants in the placebo group. Results with respect to fever in iron‐replete infants in Honduras were not reported in the publication.
The Panel notes that this study shows an adverse effect of consumption of iron supplements from either 4–9 or 6–9 months of age compared to placebo on the risk of developing diarrhoea in iron‐replete infants, while no effect on episodes of fever was observed.
Idjradinata et al. (1994) studied, in Indonesia, 47 apparently healthy iron‐replete children from middle‐class urban families, 12–18 months of age. The children had been part of a larger randomised study and received iron supplements (3 mg/kg bw per day) or placebo for 4 months. Parents were instructed to bring sick children for examinations to the paediatrician. Upper and lower respiratory tract infections and gastroenteritis were included in the analysis and the number of two‐week periods with illness was calculated for each child. In the supplemented group, children were sick in a mean ± SE of 1.45 ± 0.24 periods out of eight study periods in total. In the non‐supplemented group, the corresponding number was 2.09 ± 0.24. Also, a survival analysis (log‐rank test and a Kaplan Meier curve) on the probability that a child remained healthy, showed a delayed incidence of illness in the supplemented group.
The Panel notes that this study does not show an adverse effect of consumption of iron supplements for 4 months in 12‐ to 18‐month‐old iron‐replete children on the number of 2‐week periods with illness (i.e. upper or lower respiratory tract infections and gastroenteritis) or on the probability of remaining healthy.
Overall conclusions on infections
The Panel notes that the study by Dewey et al. (2002) showed an increased risk of developing diarrhoea in the iron‐supplemented group (4‐ to 9‐month‐old iron‐replete infants) but no effect on fever. The other study (Idjradinata et al., 1994) did not show an effect of iron supplementation in 12‐ to 18‐month‐old infants on the risk of infections.
The Panel notes the limited evidence and that adverse effects of iron supplementation have been reported in one study in relation to the risk of developing diarrhoea, while there was no effect on other types of infections in the same and the other study.
The Panel considers that the incidence of infections in infants and children cannot be used as an outcome for setting a UL for iron.
3.5.5.4. Overall conclusions on adverse effects of iron supplementation in infants and children
The Panel considers that none of the outcomes investigated in infants and children can be used for the setting of a UL.
3.5.6. Other adverse effects of iron supplementation during pregnancy
Studies have reported that excess iron from iron supplementation during pregnancy may have adverse effects on maternal (Baker et al., 2018; Dewey & Oaks, 2017; Iqbal & Ekmekcioglu, 2019), birth (Georgieff et al., 2019; Shastri et al., 2015) and infant outcomes (Jayasinghe et al., 2018; Quezada‐Pinedo et al., 2021; Wessling‐Resnick, 2017). Associations of iron supplementation with birth weight [absolute birth weight, low birth weight, small‐for‐gestational age (SGA) births], IUGR, still births, pre‐term births, pre‐term labour, pre‐eclampsia and impaired cognitive outcomes in the offspring later in life have been described.
Eligible studies were RCTs (protocol amendment 2) in which iron‐replete non‐anaemic pregnant women received known doses of oral supplemental iron as supplements or fortified foods and were compared to an appropriate control group (either placebo or another chemical form of iron). Studies were excluded if there was a co‐intervention that was not the same between groups and if it was not possible to determine if iron deficient women had been included in the study. Pertinent studies related to this outcome were retrieved through systematic searches performed by the contractor (Parlesak et al., 2024), complementary searches performed by EFSA and by manually searching the reference list of pertinent systematic reviews cited above.
No eligible studies which investigated cognitive outcomes in the offspring following iron supplementation of the mother during pregnancy were retrieved.
3.5.6.1. Pregnancy outcomes
Five eligible intervention studies were retrieved that assessed the effect of iron supplementation on pregnancy outcomes. The results of the studies with respect to absolute birth weight of the offspring are depicted in Figure 9.
FIGURE 9.

Intervention studies investigating the effect of iron supplementation during pregnancy on birth weight of the offspring. CI, confidence interval; G1, intervention group; G2, control group; GA, gestational age; MD, mean difference; N, number; PE, point estimate.
In the study by Parisi et al. (2017), conducted in Italy, 80 apparently healthy iron‐replete women, with singleton pregnancies, were randomised at 11–13 weeks of gestation into a control group consuming the habitual diet (n = 20), to a 30 mg/day iron as ferrous sulfate supplement (n = 20), to 14 mg/day iron as ferric pyrophosphate (n = 20), or 28 mg/day as ferric pyrophosphate (n = 20). Supplements were to be taken up to 6 weeks post‐partum. There were a total of 23 women lost to follow up (group not reported). Infants born to mothers assigned to 28 mg/day iron as ferric pyrophosphate had a statistically significantly higher birth weight compared to infants in the control group (mean ± SD: 3499 ± 464 g vs. 3092 ± 470 g). No statistically significant differences were observed between the control group and the other iron groups (3253 ± 324 g in the group receiving ferrous sulfate and 3280 ± 312 g in the group receiving 14 mg/day ferric pyrophosphate).
The Panel notes that this study does not show an effect of iron supplementation from 11 to 13 gestational weeks onwards at a dose of 14 and 28 mg/day iron as ferric pyrophosphate and 30 mg/day iron as ferrous sulfate in iron‐replete pregnant women on a lower birth weight of the offspring.
In Iran, three studies investigated the effect of prenatal iron supplementation on birth outcomes.
Ouladsahebmadarek et al. (2011) randomised 960 iron‐replete pregnant women to receive either a daily multivitamin plus 30 mg iron or a daily multivitamin with a placebo tablet from 13 weeks gestation until delivery. Birth weight was not significantly different between the two groups (mean ± SD intervention 3260 ± 396 g vs. control 3216.78 ± 431 g). The difference in number of neonates with IUGR (defined as birth weight < 10th percentile for gestational age) between groups was not significant either (58 [14.1%, intervention] vs. 65 [17.5%, control]). Regarding maternal outcomes, although preeclampsia was not significantly different between groups (3.9 vs. 2.7%), the incidence of pregnancy induced hypertension was significantly higher in the iron group compared to the control group (6.7% vs. 3.4%).
The panel notes that this study does not show an effect of iron supplementation from the 13th gestational week onwards at a dose of 30 mg/day iron in iron‐replete pregnant women on a lower birth weight of the offspring. There was no effect on IUGR and preeclampsia. However, incidence of pregnancy‐induced hypertension was significantly higher in the iron‐supplemented group compared to the control group.
Alizadeh and Salehi (2016) randomised 86 iron‐replete women at 16–20 weeks of gestation, into a group receiving 50 mg iron daily (n = 42) or a control group receiving placebo (n = 44), until delivery. There was no significant difference in birth weight between the two groups (mean ± SD intervention 3391.56 ± 422 g vs. control 3314.06 ± 341 g).
The Panel notes that this study does not show an effect of iron supplementation from 16–20 gestational weeks onwards, at a dose of 50 mg/day iron in iron‐replete pregnant women on a lower birth weight of the offspring.
Falahi et al. (2011) randomised 148 iron‐replete women at gestational age < 20 weeks, to receive 60 mg iron daily (n = 70) or placebo (n = 78) until delivery. No significant differences were observed between the two groups in the infants' birth weight (mean ± SD intervention 3.31 ± 0.49 kg vs. control 3.27 ± 0.47 kg), or in the rates of low birth weight and pre‐term delivery (data not provided in the publication).
The Panel notes that this study does not show an effect of iron supplementation from < 20 gestational weeks onwards at a dose of 60 mg/day iron in iron‐replete pregnant women on a lower birth weight of the offspring. There was also no effect on the rate of low birth weight or pre‐term delivery.
In the study by Chan et al. (2009), 1164 non‐anaemic pregnant women in Hong Kong were randomised to receive 60 mg iron daily or placebo from ≤ 16 weeks of gestation until delivery. A total of 862 had neonatal outcome data. Mean ± SD baseline SF concentrations were 87.6 ± 2.6 μg/L in the control and 81 ± 2.7 μg/L in the intervention groups. The Panel considers that based on these baseline SF concentrations, the vast majority of participating women were iron‐replete. There were two infants with IUGR in the control group and none in the intervention group. Pre‐term delivery was comparable between groups and amounted to 6.44% in the iron‐supplemented group and 6.77% in the control group. There was no significant difference in congenital abnormalities (5.08% in the iron‐supplemented vs. 6.86% in the control group). Birth weight of term infants was significantly higher in the iron group vs. control (mean ± SD 3247 ± 21 g vs. 3152 ± 20 g) while birth weight of pre‐term infants was non‐significantly lower in the iron group (2240 ± 93 g vs. 2470 ± 89 g). There was also a lower risk of an infant being born SGA in the iron‐supplemented group (OR: 0.46, 95% CI: 0.24–0.85).
The Panel notes that this study does not show an effect of iron supplementation from ≤ 16 gestational weeks onwards at a dose of 60 mg/day iron in iron‐replete pregnant women on a lower birth weight of the offspring. The risk of a SGA‐birth was lower in the iron‐supplemented group, compared to the control group.
3.5.6.2. Overall conclusions on pregnancy outcomes
The Panel notes that none of the five eligible RCTs on pregnancy outcomes showed iron supplementation of 14–60 mg/day during pregnancy to be associated with a lower birth weight of the offspring. One study showed a higher incidence of hypertension in mothers to be associated with iron supplementation. None of the other studies reported on this outcome. The incidence of pre‐term labour, SGA births, IUGR was investigated in single studies and no adverse effects were observed.
The Panel considers that the available BoE does not suggest a positive relationship between iron supplementation during pregnancy and adverse health outcomes for either the mother or the offspring. No comprehensive UA is performed.
3.5.7. Zinc absorption
A narrative review was conducted for this outcome. The contractor has identified pertinent studies for this subquestion by using the pool of intervention studies retrieved in the systematic reviews for SRQs 2b, 3a, 6a and 6b and hand searched published systematic reviews for relevant studies. Included studies were those which used as outcome measure plasma zinc concentrations or investigated zinc absorption using isotope‐labelled zinc. The study design included RCTs in all population groups without restriction. Overall, the contractor reported contradicting results (Parlesak et al., 2024).
Therefore, the Panel decided to concentrate the assessment on the study designs which were considered the most reliable ones. These were intervention studies (randomised or non‐randomised) which investigated zinc absorption using at least two different doses of iron supplementation (including a zero dose) and used stable isotopes to investigate absorption. Balance studies taking place in a metabolic unit were also considered pertinent. Studies which used plasma or serum zinc concentrations as the only endpoint were, therefore, excluded from the present assessment.
Fung et al. (1997) reported on an intervention aimed to assess fractional zinc absorption throughout pregnancy and in early lactation. Five of the 21 participants took iron supplements during different intervals of pregnancy and at different doses. Even though an analysis was presented comparing fractional zinc absorption in iron supplemented vs. non‐supplement participants, this analysis is of observational nature and has not been considered further in the assessment.
3.5.7.1. Studies with differential iron supplementation during a run‐in period and administration of only a zinc tracer on the test day(s)
Studies in infants
Domellöf et al. (2009) studied 25 infants who were part of a larger RCT on iron supplementation in exclusively breast‐fed infants, described as Dewey et al. (2002) in Section 3.5.5.1 . In the original trial, the infants had either received an iron supplement of 1 mg/kg bw per day from 4 to 9 months of age (n = 6), placebo from 4 to 6 months of age and an iron supplement of 1 mg/kg bw per day from 6–9 months of age (n = 8) or placebo from 4 to 9 months of age (n = 11). On the test days at 6 and 9 months of age, zinc absorption was studied using a stable isotope (70Zn, 93.2 μg) mixed with breast milk. No iron supplements were administered on that day. Six hours before and after the test, infants received only breast milk. All stools were collected for at least 78 h following 70Zn administration to assess recovery. The final analyses only included data from infants with complete stool collections. There were no statistically significant differences in zinc absorption between the groups [mean zinc absorption at 9 months: iron supplementation 4–9 months: 59% (SD 16%, n = 4), iron supplementation 6–9 months: 53% (SD 9%, n = 4), placebo: 56% (SD 22%, n = 8)]. No statistically significant difference was also observed when combining the two iron‐supplemented groups [iron supplemented: 56% (SD 12%, n = 8) vs. placebo: 56% (SD 22%, n = 8)].
The Panel notes that this study does not show an effect of iron supplementation at a dose of 1 mg/kg bw per day given during a run‐in period of 3–5 months in healthy 6‐ to 9‐month‐old infants on zinc absorption on a test day in which no iron supplements were consumed and zinc intakes were comparable between groups.
Studies in non‐pregnant adults
Ruz et al. (2002) administered, in a non‐randomised study, iron supplements containing 40 mg iron as ferrous sulfate per tablet to 21 non‐anaemic non‐pregnant women for 3 months. Women could choose to take one or two tablets per day. The average iron intake was 55 ± 18.5 mg/day (measure of variability not defined in the publication). Five women consumed placebo. Zinc absorption was measured before the start of the supplementation and 3 days after the end of the intervention. In both instances, the same procedures (as described in the following sentences) were followed. On the test day, 2 mg 68Zn was given orally in water and 0.5 mg 70Zn intravenously. One day later, 1 mg 67Zn was given as part of a standard meal. Spot urine samples were collected from days 4 to 9. Fractional zinc absorption in fasting state from 68Zn was 58 ± 20% at baseline and 69 ± 21% after the intervention in the iron group and 61 ± 14% and 60 ± 13% in the placebo group, respectively. After the test meal (67Zn), fractional zinc absorption was 22 ± 7% at baseline and 24 ± 6% after the intervention in the intervention group and 24 ± 9% and 23 ± 7% in the placebo group, respectively. The exchangeable zinc pool was 176.6 ± 38.3 mg at baseline and 160.3 ± 24.2 mg at the end of the intervention in the iron group. In the placebo group, it was 167.1 ± 32.1 mg and 171.8 ± 20.5 mg, respectively. Results of between‐group‐comparisons were not reported.
The Panel notes that this study does not show an effect of iron supplementation at a dose of around 55 mg/day during a run‐in period lasting 3 months on zinc absorption on a test day in which no iron supplements were consumed and in which zinc intakes were comparable between groups.
Studies in pregnant women
Harvey et al. (2007) conducted an RCT in 13 apparently healthy iron‐replete pregnant women which lasted from gestational week 16 until delivery. Six women were randomised to supplements with 100 mg/day iron as ferrous gluconate and seven to placebo. Zinc absorption was measured on test days at gestational weeks 16, 24 and 34. On the test days, iron supplements were not consumed. Volunteers received 1.6 mg 70Zn by intravenous infusion and 4 h later 3 mg of 67Zn taken orally together with a standard lunch containing an additional approximate 3 mg zinc. Complete faecal collections were made at baseline (baseline stool sample) before the test day and for the 10 days following the test day. A 24‐h urine collection was made on the day before the test day and on days 3–6 after the testing. Mean (SD) zinc absorption was 21% (3%), 24% (3%) and 31% (6%) in the iron group at baseline, 24 and 34 gestational weeks, respectively, and 22% (7%), 24% (3%) and 31% (5%) in the placebo group. The exchangeable zinc pool was 152 mg (33 mg), 154 mg (37 mg) and 147 mg (31 mg) in the iron group and 145 (22), 149 (11) and 146 (32) at the different time points, respectively.
The Panel notes that this study does not show an effect of iron supplementation at a dose of 100 mg/day given during a run‐in period lasting for at least 8 weeks during the second and third trimester of pregnancy on zinc absorption on a test day in which no iron supplements were consumed and in which zinc intakes were comparable between groups.
3.5.7.2. Studies with differential iron supplementation during a run‐in period and supplementation on the test day(s) with comparable amounts of iron and zinc
Studies in infants
Szymlek‐Gay et al. (2016) randomised 72 apparently healthy predominantly formula‐fed infants at 6 months of age to a high‐iron formula (6.6 mg/day), a low iron formula (1.3 mg/day) or iron drops (6.3 mg/day) in addition to a formula with no added iron (0.3 mg/day; total 6.6 mg/day) for 45 days. All formulas had similar zinc content that led to a zinc consumption of approximately 2 mg/day. On the test day (intervention day 31), both iron‐fortified formula groups received a total of 8.1 mg of iron and 2.5 mg zinc. The iron drops group received 8.3 mg iron and 2.4 mg zinc. This included the amount of the iron and zinc tracer (2 mg 57Fe and 0.5 mg 67Zn) which was split between three meals in the formula groups. In the iron drops group, the dose of 67Zn was also divided while the 57Fe was administered in a single dose 2 h after the first meal. No other meals were allowed until 2 h after the last meal was consumed. After the first meal (and the administration of 57Fe in the iron drops group), infants were infused intravenously with 50 μg 58Fe and 100 μg 70Zn. Blood samples were taken before administration of the stable isotopes and on day 45. A spot urine sample was collected 96 h after infusion of the stable isotopes. Fractional zinc absorption was mean (95% CI) 32.1% (29.7%–34.5%) in the high iron formula group (n = 22), 29.9% (27.1%–32.7%) in the low iron formula group (n = 19) and 32.7% (30.4%–35.0%) in the iron drops group (n = 19).
The Panel notes that this study does not show an effect of consumption of iron fortified formula or iron drops plus formula providing 6.6 mg/day iron (compared to a formula providing 1.3 mg/day) during a run‐in period of 31 days in healthy 6–7 months old infants on zinc absorption on a test day in which all infants were given 8.1–8.3 mg iron and 2.4 mg zinc.
3.5.7.3. Studies with differential iron supplementation during a run‐in period and differential supplementation on the test day(s)
Studies in infants
Esamai et al. (2014) randomised 45 apparently healthy non‐anaemic predominantly breast‐fed infants aged 6 months from an area with extreme poverty in rural Kenya to consume together with a meal (maize‐based porridge mixed with breast milk) micronutrient powder with 5 mg zinc and 12.5 mg iron per day, a powder with 5 mg zinc but no iron, or a placebo without iron and zinc until the age of 9 months. On the test day at 9 months of age, the different micronutrient powders were consumed and 67Zn was added to the meal during which the powder was consumed. 70Zn was added to all other meals of the day. After the last meal of the day, 68Zn was administered intravenously. Isotope doses were the same for the two intervention groups but lower for the placebo group, as the doses were calculated based on the estimated zinc intakes on the testing day (i.e. 10% of an estimated zinc intake of 6–7 mg in the powder groups and 1–2 mg/day in the placebo group). Weighed duplicate diets were collected for the test day. Around 20 mL of urine was collected in the morning and the evening during the days 4–7 following the test day. Fractional zinc absorption was similar in the high and no iron powder groups and statistically significantly higher in the placebo group, i.e. median [interquartile range (IQR)] 7.9% (6.6%–12.4%) in the high iron micronutrient powder group, 5.4% (3.5%–10.1%) in the no iron micronutrient powder group, and 24.8% (17.9%–28.2%) in the placebo group. The exchangeable zinc pool was 3.7 (3.0–4.2) mg/kg bw and 3.8 (3.5–4.3) mg/kg bw in the groups consuming micronutrient powders with and without iron, respectively. In the placebo group, it was 2.4 (2.1–2.9) mg/kg bw (all estimated from graphs in the publication).
The Panel notes the low fractional zinc absorption in the micronutrient powder groups and that this study does not show an effect of iron supplementation at a dose of 12.5 mg/day (compared to no supplementation) consumed as part of a micronutrient powder on zinc absorption in apparently healthy 9‐month‐old infants. When comparison was made with an un‐supplemented control group, zinc absorption in the groups having consumed the micronutrient powder (with and without iron) was lower, but testing conditions were not comparable in terms of the amount of zinc provided in the run‐in period and on the test day.
Haschke et al. (1986) recruited seven apparently healthy infants between 43 and 322 days of age into a balance study. Infants consumed infant formula with iron content of 10.2 mg/L or one with 2.5 mg/L iron and a zinc content of 1.9 mg/L in a cross‐over design. The formulae were fed for at least 11 days before the 72‐h balance study began. Net absorption was calculated as intake minus faecal excretion and net retention as intake minus total excretion. During the high iron formula period a mean (SD) of 15.6% (25.2%) of zinc was absorbed and 9.6% (26.0%) were retained. During the low intake formula period, this was 20.3% (12.9%) and 17.6% (13.8%), respectively. The difference was not statistically significant.
The Panel notes that this cross‐over study does not show an effect on zinc absorption between the low‐iron formula (2.5 mg/L) and the one providing 10.2 mg/L.
Studies in pregnant women
O'Brien et al. (2000) recruited women who participated in a pre‐natal supplementation study in which one group of women consumed 60 mg/day iron as ferrous sulfate and 250 μg folate and one group which consumed the same supplement plus 15 mg zinc (i.e. 60 mg iron, 250 μg folate and 15 mg zinc per day). Women from the same community who did not take any supplements because they had sought medical advice only late in pregnancy were taken as controls. Supplements were started on average at gestational week 16. Zinc absorption was measured on test days between gestational weeks 30–36. On the test day, women followed their assigned interventions and received an intravenous infusion containing 0.3 mg 70Zn and an oral zinc tracer 67Zn (0.25 mg/kg) in a flavoured drink. Thereafter, they fasted for 1.5 h. Breakfast and lunch on that day was standardised. A blood sample was taken 3 days after the test day. Spot urine samples were taken 60, 68 and 72 h post‐dosing. Fractional zinc absorption was higher in the non‐supplemented control women than in the women assigned to the iron‐containing supplements, i.e. mean (SD) 47.0% (12.6%) in the control group (n = 12), 20.5% (6.4%) in the iron‐supplemented group (n = 15) and 20.2% (4.6%) in the iron‐ and zinc‐supplemented group (n = 12).
The Panel notes that in this study, non‐supplemented women, who were not recruited from the same population as women who received the iron supplements, had a higher fractional zinc absorption compared to women consuming iron‐containing supplements at a dose of 60 mg/day.
3.5.7.4. Studies with no run‐in period or non‐differential iron supplementation during a run‐in period and comparable zinc doses on the test day
Studies in infants
In a non‐randomised cross‐over study (Fairweather‐Tait et al., 1995), 11 infants who were approximately 9 months old were fed ready‐made baby foods containing 1.6 mg zinc and 6.6 mg or 1 mg iron per test meal. One meal was labelled with 67Zn and the other with 70Zn. Meals were consumed on two consecutive days with a 2‐h fast before and after each meal. All diapers were saved from after the first meal to day four for stool analysis. Mean absorption (SD) was 31.3% (8.3%) from the iron fortified meal and 28.5% (10.5%) from the unfortified meal.
The Panel notes that this non‐randomised cross‐over study does not show an effect of iron intake of 6.6 mg vs. 1 mg in 9‐month‐old infants on zinc absorption.
Studies in children
Hettiarachchi et al. (2010) randomly assigned 53 4‐ to 7‐year‐old apparently healthy children to consume a cereal‐based micronutrient enriched food with 1.5 mg zinc and either 9 mg or 4.5 mg iron as ferrous fumarate. The food was consumed together with 67Zn, and after 2 h fasting, 0.5 mg 70Zn was administered intravenously. Two days after the test meal a 15 mL sample of early morning urine was collected. Zn absorption in the group having consumed 9 mg iron ranged from 5.7% to 15.9% with a geometric mean of 10.2%. In the group having consumed 4.5 mg iron, Zn absorption ranged from 5.6% to 15.7% with a geometric mean of 7.7%.
The Panel notes that this study does not show an effect of iron supplementation of 9 mg vs. 4.5 mg consumed once on zinc absorption in 4‐ to 7‐year‐old children.
Li et al. (2015) randomly assigned 30 non‐anaemic children (mean age 13 years) to consume ferrous sulfate‐enriched soy sauce, sodium iron (III) ethylenediaminetetraacetate (NaFeEDTA)‐enriched soy sauce or unfortified soy sauce. For the first 3 days, all children consumed an experimental diet. Thereafter, for 5 days, the soy sauce was added to the experimental diet. The diet in the iron‐enriched‐soy‐sauce‐consuming groups contained 6 mg iron and 3 mg 67Zn. In the group consuming the unfortified soy sauce, 3 mg 67Zn was provided. Complete faecal collections took place from day four onwards when also a faecal marker was consumed to be able to determine the end of the faecal collection period. Mean (SD) fractional zinc absorption was 22.1% (7.5%) in the NaFeEDTA group, 24.2% (6.5%) in the ferrous sulfate group and 25.7% (10.3%) in the unfortified soy sauce group.
The Panel notes that this study does not show an effect of consumption of iron fortified soy sauce at a dose of 6 mg/day consumed for 5 days vs. consumption of unfortified soy sauce in 13‐year‐old children on zinc absorption.
Studies in adults
Davidsson et al. (1995) reported on four randomised cross‐over studies in apparently healthy adults. Each test meal was labelled with radioactive Zn. The second test meal was consumed 14 days after the first test meal. In study 1, eight volunteers consumed a weaning cereal with 10 mg of added iron and one without added iron. The zinc content of the cereal was 0.44 mg per test meal. In study 2, 16 volunteers consumed the same cereal with 25 mg iron added and one without added iron. The zinc content of the cereal was 0.44 mg per test meal. In study 3, eight individuals consumed bread rolls with 3.9 mg iron added and bread rolls without added iron. The bread rolls had a zinc content of 0.51 mg per test meal. Finally, in study 4, eight participants consumed infant formula with 5.4 mg iron or without added iron. The zinc content was 0.54 mg per test meal. The content of iron and zinc in each meal was analysed in duplicate portions. Body retention was measured 10–14 days after the intake of each test meal in a whole‐body counter to allow excretion of the non‐absorbed fraction. Zinc absorption was found to be similar between both periods in all studies, i.e. mean (SD) supplemented vs. unsupplemented: study 1: 31.1% (11.9%) vs. 30.7% (7.0%), study 2: 37.7% (16.6%) vs. 30.2% (9.9%), study 3: 36.5% (12.4%) vs. 38.3% (18.1%), study 4: 41% (8.1%) vs. 38.9% (14.5%).
The Panel notes that these cross‐over studies comparing the doses of 10, 25, 3.9 and 5.4 mg iron consumed as part of meals with no additional iron supplementation do not show an effect on zinc absorption.
Sandström et al. (1985) studied zinc absorption in apparently healthy adults with radioactively labelled zinc (0.5 μCi 65Zn) and measurements of whole‐body retention after 14 days of intakes using a whole‐body counter. The first experiment was carried out with water and investigated zinc absorption in the fasting state. Six individuals consumed 40 μmol zinc (2.6 mg) with no added iron, 11 received 40 μmol zinc (2.6 mg) and 40 μmol iron (2.2 mg) as ferrous sulfate (molar ratio 1:1), six received 40 μmol zinc (2.6 mg) and 100 μmol iron (5.5 mg) (molar ratio 2.5:1), and six were supplemented with 40 μmol zinc (2.6 mg) and 1000 μmol iron (55 mg) (molar ratio 25:1). Four individuals who had taken 50 mg/day iron supplements for 2 weeks prior to the intervention were also studied with respect to zinc absorption, being assigned to a solution with 40 μmol zinc (2.6 mg) without iron. Another experiment was conducted to investigate zinc absorption in the non‐fasting state. For this, individuals consumed test lunches after a standardised breakfast containing 40 μmol zinc (2.6 mg) and 40 μmol (n = 21, 2.2 mg, molar ratio 1:1), 100 μmol (n = 6, 5.5 mg, molar ratio 2.5:1) or 1000 μmol (n = 6, 55 mg, molar ratio 25:1) iron. Zinc absorption was on average (SD) 73.8% (4.6%), 58.3% (17%), 59.3% (5.5%) and 33.7% (8.1%) when 0, 2.2, 5.5 and 55 mg iron were given together with zinc in the fasting state in a water solution. Zinc absorption in the group who had received iron supplements before the study was similar to the one in those who had not received supplements (only studied for 40 μmol zinc (2.6 mg) without added iron). When iron and zinc were consumed with a meal no effect of the iron dose was visible. Zinc absorption was 25.2% (8.0%), 22.8% (7.8%) and 21.5% (7.1%) at molar ratios of 1:1, 2.5:1 and 25:1.
The Panel notes that this study shows that in the fasting state co‐supplementation of zinc and iron in a molar ratio of 1:1 (2.6 mg zinc, 2.2 mg iron) led to a lower zinc absorption compared to no iron co‐supplementation. The absorption was further reduced at a molar ratio of 25:1 (2.6 mg zinc, 50 mg iron). When zinc and iron were consumed together with a meal, zinc absorption was not impacted by the presence of iron or the molar ratio.
A similar observation was made by Valberg et al. (1984) who studied zinc absorption using radioactively labelled zinc (0.5 μCi 65Zn) in apparently healthy adults. Zinc absorption was measured by whole body counting 2–4 h after the test dose and 7–10 days later. Different experiments are described in the publication. In the first experiment, 15 individuals received in a cross‐over study design, after an overnight fast, a zinc chloride test solution (92 μmol zinc = 6 mg zinc) without and with added iron (920 μmol iron = 51 mg iron; molar ratio 10:1) with 7–10 days between the two tests. In the second experiment, 11 individuals received haem iron as Hb added to the zinc solution with a molar ratio of 5:1 (96 μmol zinc = 6.2 mg zinc and 480 μmol iron = 27 mg iron). Absorption was on average (SD) 61% (15%) vs. 34% (7%) without and with added iron, respectively, in experiment 1 and 56% (17%) vs. 19% (7%) in experiment 2. When inorganic iron was added to turkey meat in molar ratios with zinc of 5:1 (61 μmol zinc = 4 mg zinc and 306 μmol iron = 17 mg iron) and 10:1 (61 μmol zinc = 4 mg and 610 μmol iron = 34 mg iron), no significant difference in absorption was observed. Mean (SD) absorption was 28% (8%) without added iron, 29% (12%) and 30% (9%) with added iron at the 5:1 and 10:1 molar ratio, respectively.
The Panel notes that this study shows that in the fasting state when zinc was consumed together with iron in a molar ratio of 5:1 and 10:1, zinc absorption was lower than when no iron was consumed together with zinc. When zinc and iron were consumed together with a meal, zinc absorption was not impacted by the presence of iron or the molar ratio with iron.
Studies in lactating women
In a randomised cross‐over study (Chung et al., 2002), five exclusively breast‐feeding mothers who had been taking multivitamin supplements with 18 mg iron and no zinc (duration not reported) were assigned to consume an iron supplement containing 60 mg iron as ferrous fumarate and a supplement without iron on two separate occasions with a 7‐day wash‐out period. Together with the supplements, women received 2 mg 67Zn in a lemonade beverage and a blueberry muffin. Before consuming the supplements, 50 μg of 70Zn were infused intravenously. Spot urine samples were collected in the morning of the test day and for 7 days after administration of the test doses. Fractional zinc absorption was on average 22% when women had taken iron supplements and 27% when they had not taken supplements (measures of variability not defined in the publication). The difference was reported to be statistically significant.
The Panel notes that in this cross‐over study in lactating women fractional zinc absorption was higher when no iron‐containing supplement was consumed as compared to the supplement containing 60 mg iron.
Studies in ileostomy patients
In a non‐randomised study, 11 non‐anaemic patients with ileostomy (Troost et al., 2003) received on three different occasions (wash‐out not reported) a test beverage containing 7 mg 67Zn, 5 mg 66Zn (in total 12 mg zinc) and 3 mg copper to which 0, 100 or 400 mg iron as ferrous sulfate was added. The test beverage was an isotonic maltodextrin solution. 70Zn was administered intravenously immediately after consumption of the test beverage. Individuals fasted for 4 h after the test beverage (isotonic maltodextrin solution). Ileostomy effluent was collected for 24‐h and 24‐h urine for 7 days following the isotope administration. Mean (SEM) true zinc absorption was lower on the occasion in which the test beverage was supplemented with iron, i.e. 22.9% (6.4%), 26.4% (14.4%) and 44.5% (22.5%) of the administered dose when 400, 100 and 0 mg iron were added to the drinks. The exchangeable zinc pool was 119 (35) mg, 120 (27) mg and 126 (28) mg, respectively.
The Panel notes that in this study in patients with ileostomy true zinc absorption was higher when a test beverage was consumed that did not contain iron compared to the solution that contained 100 or 400 mg iron. There was, however, no influence of the iron dose.
In summary, four studies investigated whether iron supplementation per se had an influence on zinc absorption, i.e. absorption tested at comparable intakes of iron and zinc, but testing was done after a period of supplemental iron intakes which differed in dose. Two studies were conducted in infants (Domellöf et al., 2009; Szymlek‐Gay et al., 2016) and assessed the administration of iron in amounts of around 1 mg/kg bw per day or 6.6 mg/day taken between 1 and 5 months. Two studies were performed in adults, one in pregnant women (Harvey et al., 2007) and one in non‐pregnant women (Ruz et al., 2002) who had taken an iron supplement with 100 mg/day and on average 55 mg/day iron for 8 weeks and 3 months, respectively. None of these studies showed an effect of iron supplementation on zinc absorption. This indicates that iron status does not affect zinc absorption.
Furthermore, three studies supplemented participants with different doses of iron in a run‐in period and tested whether there was an influence of the dose when the two nutrients were consumed together in a test meal, i.e. iron doses differed not only during the run‐in period, but also between test meals. Two studies were conducted in infants (Esamai et al., 2014; Haschke et al., 1986) and assessed the administration of iron in amounts of 12.5 mg/day and 10.2 mg/day in an infant formula given for 3 months and 11 days, respectively. One study was in pregnant women (O'Brien et al., 2000) who were supplemented with 60 mg/day iron for an unknown duration and who were compared to women drawn from a different source population not having consumed supplements during pregnancy. Both studies in infants did not show an effect of iron supplementation on zinc absorption when comparing the groups who had received supplementation already during the run‐in period, even though in one study there was a tendency for lower zinc absorption in the iron fortified group which was not statistically significant. In the study in pregnant women (O'Brien et al., 2000), zinc absorption was higher in the group of unsupplemented women than in the group of women who had consumed iron supplements (60 mg/day). However, women in the supplemented and unsupplemented groups were not from the same source population and the duration of the supplementation was not specified.
Eleven studies investigated the influence of iron supplementation on zinc absorption in test meals given mostly at single occasions without run‐in period. One study was conducted in infants (Fairweather‐Tait et al., 1995) with 6.6 mg iron, two in children (Hettiarachchi et al., 2010; Li et al., 2015) with 9 mg (vs. 4.5 mg) and 6 mg iron. Four studies reported in one publication (Davidsson et al., 1995) were performed in healthy non‐pregnant adults with iron doses between 3.9 and 25 mg. Another study (Sandström et al., 1985), investigated the effect of different molar ratios in fasting and non‐fasting states up to a molar ratio of 25:1. Valberg et al. (1984) also investigated different molar ratios and iron forms in fasting and non‐fasting state. One study was in lactating women (Chung et al., 2002) who received a 60 mg iron supplement on the test day and one study was in patients with ileostomy (Troost et al., 2003) with iron doses of 100 and 400 mg. Studies in infants, children and the four studies in adults, administering doses up to 25 mg did not find an effect of iron supplementation on zinc absorption. However, zinc absorption was reported to have been impacted by simultaneous consumption of iron supplements in the studies in lactating women and patients with ileostomy, as well as, in the studies investigating the influence of different molar ratios between iron and zinc when the two elements were consumed together in the fasting state. The latter studies did not show an effect when iron and zinc were consumed together with a meal.
3.5.7.5. Conclusions on zinc absorption
The Panel notes that there is no evidence that iron supplements affect zinc absorption when not consumed together with zinc. The evidence is inconsistent when iron and zinc supplements are ingested simultaneously. The studies in which iron and zinc supplements are consumed with a meal generally do not show an effect of iron on zinc absorption, while the studies in which supplements are consumed on the test day in the fasting state or together with a drink show an effect of iron supplementation on zinc absorption. The extent of zinc absorption reduction may be influenced by the molar ratio in which the two elements are administered, and the form of iron consumed.
The Panel considers that iron supplementation may reduce zinc absorption if both micronutrients are consumed together in the fasting state. This may also be influenced by the molar ratio in which the two elements are ingested. When consumed together with a meal, zinc absorption seems not to be impacted by the presence of iron or the molar ratio with iron.
The Panel considers that zinc absorption cannot be used as an outcome for setting an UL for iron.
3.5.8. Other adverse health effects
Other adverse health effects that have been reported to be associated with high iron intakes have been reviewed and summarised by Parlesak et al. (2024) and are described in the following.
3.5.8.1. Cancer
In meta‐analyses, the intake of haem iron, comparing highest with lowest intakes, was described to be positively associated with the risk of developing breast cancer RR 1.12 (95% CI 1.04–1.22) (Chang et al., 2019), 18 oesophageal cancer OR 1.35 (95% CI 1.00–1.80) (Ma et al., 2018) and colorectal adenomas RR 1.23 (95% CI 1.03–1.48) (Cao et al., 2017). Each 1 mg/day increase in haem iron intake has been reported to be associated with the risk of developing colorectal cancer RR 1.08 (95% CI 1.00–1.17), colon cancer RR 1.08 (95% CI 1.00–1.17) and lung cancer RR 1.12 (95% CI 0.98–1.29) (Fonseca‐Nunes et al., 2014). Positive associations were not replicated when total, dietary or supplemental iron was used as exposure measure (Cao et al., 2017; Chang et al., 2019; Ma et al., 2018). The risk estimates obtained in the meta‐analysis for total iron intakes, for example, were for breast cancer RR 0.97 (95% CI 0.82–1.14) (Chang et al., 2019), oesophageal cancer OR 0.81 (95% CI 0.70–0.94) (Ma et al., 2018), and for colorectal adenomas RR 0.93 (95% CI 0.61–1.42) (Cao et al., 2017). Fonseca‐Nunes et al. (2014) did not report results for total, supplemental or dietary iron intakes.
The Panel notes that, although positive associations have been observed between haem iron and certain types of cancers, the available evidence does not allow disentangling a causal contribution of haem iron from that of other risk factors associated with ‘high’ red meat intake (e.g. lifestyle).
The Panel notes that cancer incidence cannot be used as an outcome for setting an UL for iron.
3.5.8.2. Cardiovascular disease
A meta‐analysis of six studies (Han et al., 2020) found a positive association in dose–response modelling between haem‐iron intake and the risk of cardiovascular disease (CVD) mortality, RR 1.25 (95% CI 1.17–1.33) per 1 mg/day increase in haem iron intake. Neither dietary total iron intake (five studies in the dose–response analysis) nor non‐haem iron intake (four studies in the dose–response analysis) was found to be positively associated with CVD mortality (RR 0.97, 95% CI 0.91–1.05 and 1.02, 95% CI 0.97–1.07, respectively, per 5 mg/day increase in intake).
Another dose–response meta‐analysis of 11 studies (Fang et al., 2015) investigated the relationship between iron intake and risk of CVD (i.e. morbidity of coronary heart disease, stroke, hypertensive disease, heart failure, CVD‐related mortality). Outcomes for which meta‐analyses were presented were CVD mortality [two studies which were also covered by Han et al., 2020], fatal and non‐fatal myocardial infarctions, coronary heart disease, CVD, hypertension and stroke. Each 1 mg/day increase in haem iron intake was associated with an increased risk of CVD (RR 1.07, 95% CI 1.01–1.14). Neither dietary total iron intake (six studies in the dose–response analysis) nor non‐haem iron intake (seven studies) was found to be positively associated with CVD mortality (RR 1.00, 95% CI 0.94–1.06 and 0.98, 95% CI 0.96–1.01, respectively, per 5 mg/day increase in intake).
The Panel notes that CVD risk or mortality cannot be used as an outcome for setting an UL for iron.
3.5.8.3. Parkinson's disease and Alzheimer's dementia
Several systematic reviews of observational studies have investigated the association between plasma/serum concentrations of biomarkers of iron status and Parkinson's disease (Jiao et al., 2016; Jiménez‐Jiménez et al., 2021; Mostile et al., 2017; Zhao et al., 2023) or Alzheimer's dementia (Gong et al., 2023; Lopes da Silva et al., 2014; Tao et al., 2014).
Except for the review by Tao et al. (2014) none of the other systematic reviews and meta‐analyses reported an association between elevated plasma/serum concentrations of biomarkers of iron status and an increased incidence of Parkinson's disease or Alzheimer's dementia, even though an increased iron content in certain brain regions has been associated with these diseases (Ravanfar et al., 2021).
A systematic review and meta‐analysis investigating the association between iron intake and Parkinson's disease (Cheng et al., 2015) showed an increased risk of developing Parkinson's disease associated with high iron intakes in the USA (high intakes not defined and based on the fourth and fifth intake quantiles in the included studies) when pooling the results of three case control studies and one PC study. The single study conducted outside the USA in Japan and included in the review found a reduced risk associated with higher iron intakes. Systematic reviews on iron intake and Alzheimer's dementia have not been retrieved. The Panel notes that the evidence is mainly based on case control studies.
The Panel notes that neither Parkinson's disease nor Alzheimer's dementia can be used as outcomes for setting a UL for iron.
3.6. Hazard characterisation
3.6.1. Selection of the critical effect
In humans, there are no active pathways for iron excretion. The iron supply to the body is regulated mainly via up and downregulation of iron absorption.
Systemic iron overload leads to the accumulation of iron in organs, especially the liver and may lead to organ and liver damage such as liver cirrhosis, liver failure, and hepatocellular carcinoma. This is well documented in individuals with impaired downregulation of iron absorption, such as hereditary haemochromatosis. Patients with hereditary haemochromatosis or with transfusional iron overload are at increased risk of diabetes mellitus, with loss of insulin secretory capacity and/or development of insulin resistance. Also, increased risks of developing arthritis and cardiomyopathy have been observed. Even though these patients are not the target population of the current risk assessment, adverse health effects observed in this population group demonstrate the consequences of systemic iron overload. Indeed, liver toxicity has also been reported in cases of iron overload syndromes associated with high daily supplemental iron intakes, ranging from 100 mg to 1000 mg taken for 15 years. However, these data cannot be used alone for setting a UL based on liver toxicity in the general population (Section 3.5.1 ).
Studies show the occurrence of adverse GI effects when more than 50 mg/day of supplemental iron was consumed as ferrous sulfate, ferrous fumarate, or ferrous bisglycinate, but without a clear relationship between the dose of iron consumed and the percentage of individuals suffering from adverse effects. It has been proposed that these effects are a sign of mucosal damage of unabsorbed iron remaining in the gut (Hamdeh et al., 2021; Scarpignato & Bjarnason, 2019). In fact, gastric mucosal erosion and deposition of iron in the upper GI tract have been observed in humans following iron supplementation (Haig & Driman, 2006; Ji & Yardley, 2004; Kaye et al., 2008; Laine et al., 1988; Marginean et al., 2006; Parfitt & Driman, 2007; Scarpignato & Bjarnason, 2019; Zhang et al., 2009). In most publications, information on the iron dose consumed is not given. Individuals studied by Laine et al. (1988) had received around 1000 mg/day iron for 2 weeks and a similar amount has been taken by the patient described by Zhang et al. (2009). The Panel notes that the clinical significance of these findings is unclear.
With respect to infants, there are some data that show lower weight gain in iron‐replete infants and young children supplemented with iron at doses of between 1 and 3 mg/kg bw per day compared with unsupplemented iron‐replete infants. Considering the totality of eligible evidence, the Panel concludes that the level of certainty for a causal relationship between high iron intakes and impaired growth in iron‐replete infants and young children is low. Therefore, this outcome is not suitable to derive a UL.
Iron toxicity can result in various adverse effects resulting from iron deposition in organs and subsequent damage and dysfunction. In the absence of adequate data to characterise a dose–response relationship and identify a reference point for iron toxicity, the Panel considers that no UL for iron intake can be established for any population group.
3.6.2. Derivation of health‐based guidance values
3.6.2.1. Adults
For nutrients for which there are no, or insufficient, data on which to base a UL, the Panel is requested to ‘give an indication on the highest level of intake where there is reasonable confidence in data on the absence of adverse effects’ (Section 1.1 ), i.e. a safe level of intake (EFSA NDA Panel, 2022a).
Data to inform the derivation of a safe level of intake for iron are limited. Considering the available evidence, the Panel considers that the presence of black stools, which reflects the presence of large amounts of unabsorbed iron in the gut, is the only indicator for which sufficiently reliable and consistent data are available to characterise a dose–response (Section 3.5.4 ). The Panel considers that the presence of black stools is not an adverse event per se but is a conservative endpoint among the chain of undesirable events that may lead to systemic iron overload and iron toxicity, and can be used as a basis to derive a safe level of intake for iron.
Available evidence from three RCTs, which used iron supplemental doses between 20 and 80 mg/day, indicates that black stools do not occur among adults at supplemental doses of 20–25 mg/day iron, while they occur at supplemental doses of ≥ 40 mg/day (Section 3.5.4 ). The background intake of iron, assessed in only one of these studies, was on average about 15 mg/day. Although these data are restricted to studies in pregnant women, the Panel considers that using evidence of black stools is conservative and therefore sufficiently protective for the general adult population. Taking into account the totality of the evidence and related uncertainties, the Panel therefore considers that a total intake of iron of 40 mg/day, from diet and supplements, is not expected to lead to adverse effects in the general adult population. This safe level of iron intake has been derived from the upper range of the supplemental iron doses at which black stools did not occur (i.e. 25 mg/day) to which the mean background intake of iron (15 mg/day) was added that had been observed in one of the studies.
As the value has been derived from studies in pregnant women, the safe level of intake also applies to pregnant women. As no specific concern was identified regarding lactating women, it also applies to this population group.
3.6.2.2. Children and adolescents
For children and adolescents, no reliable data on the occurrence of black stools upon iron supplementation are available. The Panel used allometric scaling for scaling down the safe level of intake for adults to younger age groups from 1 year of age. Allometric scaling was chosen because of the involvement of iron in growth and the resulting differences in physiology between adults and children. The calculations of the safe levels of intake for total iron intakes from all sources for the respective age groups are depicted in Table 10. Values were rounded to the closest 5 mg/day. This represents a less than 10% variation compared to the unrounded figures (EFSA Scientific Committee, 2012).
TABLE 10.
Derivation of the safe level of intake for iron for children and adolescents.
| Age range | Reference bw males and females (kg) | Safe level of intake (mg/day) unrounded | Safe level of intake (mg/day) rounded |
|---|---|---|---|
| 1–3 years | 11.9 | 11 | 10 |
| 4–6 years | 19.0 | 15 | 15 |
| 7–10 years | 28.7 | 20 | 20 |
| 11–14 years | 44.6 | 29 | 30 |
| 15–17 years | 60.3 | 36 | 35 |
3.6.2.3. Infants
The Panel notes that, owing to the lack of reliable data on the occurrence of black stools upon iron supplementation and the limitations of extrapolating the safe level of total intake for iron from adults, no safe level of total intake for iron from all sources can be set for infants.
Through infancy, requirements for dietary iron change greatly. During the first 4–6 months of life, iron requirements of healthy term infants can be almost exclusively covered by iron stores present at birth. Thereafter, when iron stores are exhausted, there is a rapid increase in requirements for dietary iron, which in this population group are on a per kg body weight basis the highest of all population groups and in absolute terms higher than in young children. The Panel considers that because of these distinctively high iron requirements of infants in the second half of the first year of life and the rapid physiological changes during infancy it is not justified to scale down the safe level of total intake for iron from adults to infants. Rather, the Panel decided to use allometric scaling to scale down the highest supplemental intake of iron which has not led to the occurrence of black stools in adults (i.e. 25 mg/day), rather than total intake, to infants. A safe level of supplemental intake of 5 mg/day was derived for infants 7–11 months of age and extended to infants 4–6 months of age. Supplemental intake in this opinion refers to iron intakes from fortified foods and food supplements, not from infant and follow‐on formulae.
3.7. Risk characterisation
The Panel notes that the application of safe levels of intake for risk assessment and risk management is more limited than a UL because the proportion of people at risk of adverse effects in a population cannot be estimated, as the intake level at which the risk of adverse effects starts to increase is not defined.
The Panel notes that doses equal to or greater than the safe level(s) of intake are sometimes used for the prevention or treatment of iron deficiency anaemia. The safe levels of intake proposed by the Panel do not apply to individuals who receive iron under medical supervision.
4. CONCLUSIONS
No UL for iron can be established for any population group. The Panel establishes the safe levels of intake for iron reported in Table 11. The Panel considers that the safe levels of intake for adults, adolescents and children apply to total iron intake from all dietary sources, including fortified foods and food supplements. For children less than 1 year of age, safe levels of supplemental intake are given and apply to iron intakes from food supplements and fortified foods, not from infant and follow‐on formulae.
TABLE 11.
Safe levels of intake for iron.
| Age group | Safe level of supplemental intake males and females (mg/day) |
|---|---|
| 4–6 months | 5 |
| 7–11 months | 5 |
| Age group | Safe level of intake males and females (mg/day) |
|---|---|
| 1–3 years | 10 |
| 4–6 years | 15 |
| 7–10 years | 20 |
| 11–14 years | 30 |
| 15–17 years | 35 |
| Adults | 40 |
| Pregnant women | 40 |
| Lactating women | 40 |
The Panel notes that doses equal to or greater than the safe level(s) of intake are sometimes used for the prevention or treatment of iron deficiency anaemia. The safe levels of intake proposed by the Panel do not apply to individuals who receive iron under medical supervision.
5. RECOMMENDATIONS FOR RESEARCH
Further research regarding the effect of increasing doses of haem and non‐haem iron on gut physiology and pathology, including factors that may affect the risk of adverse effects (e.g. influence of the counter anions of iron supplements/fortificants, other factors in foods, genotype).
Characterisation of physiological thresholds for iron homeostasis using a newly developed stable isotope dilution technique to quantify iron absorption and losses from diets containing high levels of iron.
Further research regarding the effect of increasing doses of iron on gut microbiome and the effect of the changes in the gut microbiome on regulatory physiology.
The metabolism of iron at high doses suggests that cell types other than enterocytes are involved, which may have functional consequences. These processes and their consequences need to be identified and characterised.
Additional research on the mechanisms of interactions between high intakes of iron and the absorption and metabolism of other minerals e.g. copper, zinc, calcium, manganese.
To foster ongoing efforts on the collection of accurate food composition and food consumption data on fortified foods and food supplements.
ABBREVIATIONS
- ADI
Acceptable Daily Intake
- ADME
absoprtion, distribution, metabolism and excretion
- AFC Panel
Panel on Food Additives, Processing Aids and Materials in contact with Food
- aHR
adjusted hazard ratio
- ANS Panel
Panel on Food Additives and Nutrient Sources added to Food
- aOR
adjusted odds ratio
- appr.
approximately
- aRR
adjusted risk ratio
- av.
average
- BMI
body mass index
- BoE
body of evidence
- BSID
Bayley Scales of Infant Development
- bw
body weight
- CHNS
China Health and Nutrition Survey
- CI
confidence interval
- CL
Chile
- CN
China
- CRP
C‐reactive protein
- CVD
cardiovascular disease
- DANSDA
Danish National Survey of Diet and Physical Activity
- DcytB
duodenal cytochrome b reductase
- DMT1
transmembrane divalent metal transporter 1
- DNCFS
Dutch National Food Consumption Survey
- DRV
dietary reference value
- EASL
European Association for the Study of the Liver
- EDTA
ethylenediaminetetraacetic acid
- EsKiMo
Eating study as a KiGGS (Studie zur Gesundheit von Kindern und Jugendlichen in Deutschland) Module
- EVM
Experts Group on Vitamins and Minerals
- F/f
females
- FAO
Food and Agriculture Organisation
- FCDB
EFSA Food Composition Database
- Fe
iron
- FFQ
Food Frequency Questionnaire
- FINDIET
Finnish National Dietary Survey in Adults and Elderly
- FPQ
Food Propensity Questionnaire
- FSMP
food for special medical purposes
- GA
gestational age
- GDM
gestational diabetes mellitus
- GI
gastrointestinal
- GNHS
Guangzhou Nutrition and Health Study
- GNPD
Mintel Global New Products Database
- Hb
haemoglobin
- HC
head circumference
- HCP1
haem carrier protein 1
- HFE
human homeostatic iron regulator
- HPFS
Health Professionals’ Follow‐up Study
- HR
hazard ratio
- hs
high sensitivity
- ID
Indonesia
- IN
India
- IOM
Institute of Medicine
- IQR
interquartile range
- IUGR
intrauterine growth restriction
- IWHS
Iowa Women's Health Study
- JACC
Japan Collaborative Cohort Study for Evaluation of Cancer Risk
- JECFA
Joint FAO/WHO Expert Committee on Food Additives
- JP
Japan
- KoGES
Korean Genome and Epidemiology Study
- KR
South Korea
- LAZ
length‐for‐age z‐scores
- Lg
length gain
- LOAEL
Lower Observed Adverse Effect Level
- LoE
line of evidence
- Lv
length velocity
- M/m
males
- Max
maximum
- MD
mean difference
- MDI
Mental Development Index
- med.
median
- mGDSS
modified Glasgow Dyspepsia Severity Score
- N/n
number
- NA
not available
- NANS
National Adult Nutrition Survey
- NCFS
National Children's Food Survey
- Nd
not defined
- NDA Panel
Panel on Nutrition, Novel Foods and Food Allergens
- NHMRC
National Health and Medical Research Council
- NHS
Nurses’ Health Study
- NHSII
Nurses’ Health Study II
- NNR
Nordic Nutrition Recommendations
- NOAEL
No observed adverse effect level
- NPNS
National Pre‐School Nutrition Survey
- NR
not reported
- NRV
nutrient reference value
- NTFS
National Teen's Food Consumption Survey
- NTP
National Toxicology Program
- NVS
Nationale Verzehrsstudie
- OGTT
oral glucose tolerance test
- OHAT
Office of Health Assessment and Translation
- OR
odds ratio
- P
percentile
- PC
prospective cohort
- PDI
Psychomotor Developmental Index
- PE
point estimate
- PRI
population reference intake
- Q
quartile
- RBC
red blood cells
- RCT
Randomised controlled trial
- RoB
risk of bias
- ROS
reactive oxygen species
- RP
reference point
- RR
risk ratio
- SCF
Scientific Committee on Food
- SD
standard deviation
- SE
standard error
- SE
Sweden
- SF
serum ferritin
- s‐ferritin
serum ferritin
- SFFQs
semi‐quantitative food frequency questionnaires
- SGA
small‐for‐gestational age
- sQ
sub‐question
- sTfR
soluble transferrin receptor
- suppl.
supplement
- T2DM
type 2 diabetes mellitus
- TDR
total diet replacements
- TDS
total diet study
- TfR
transferrin receptor
- TIBC
total iron binding capacity
- TSAT
transferrin saturation
- UA
uncertainty analysis
- UF
uncertainty factor
- UK
United Kingdom
- UL
tolerable upper intake level
- US/USA
United States of America
- VKM
Norwegian Scientific Committee for Food Safety
- WAZ
weight‐for‐age z‐scores
- WG
working group
- WHO
World Health Organisation
- WHS
Women's Health Study
- Wv
weight velocity
- Zn
zinc
- z‐s
z‐scores
CONFLICT OF INTEREST
If you wish to access the declaration of interests of any expert contributing to an EFSA scientific assessment, please contact interestmanagement@efsa.europa.eu.
REQUESTOR
European Commission
QUESTION NUMBER
EFSA‐Q‐2021‐00370
COPYRIGHT FOR NON‐EFSA CONTENT
EFSA may include images or other content for which it does not hold copyright. In such cases, EFSA indicates the copyright holder and users should seek permission to reproduce the content from the original source.
PANEL MEMBERS
Dominique Turck, Torsten Bohn, Jacqueline Castenmiller, Stefaan De Henauw, Karen Ildico Hirsch‐Ernst, Helle Katrine Knutsen, Alexandre Maciuk, Inge Mangelsdorf, Harry J McArdle, Androniki Naska, Kristina Pentieva, Alfonso Siani, Frank Thies, Sophia Tsabouri and Marco Vinceti.
Supporting information
Protocol
EFSA’s intake assessment
Intake data from national authorities
References excluded at full text screening
Outcome of the public consultation
ACKNOWLEDGEMENTS
The Panel wishes to thank for their contribution to this output: the WG on Upper Levels: Peter Aggett, Brandy Beverly, Torsten Bohn, Julia Bornhorst, Marta Crous‐Bou, Francesco Cubadda, Aymeric Dopter, Susan Fairweather‐Tait, Rex FitzGerald, Susan Lanham New, Georg Lietz, Harry J McArdle, Anne Molloy, Androniki Naska, Giovanni Passeri, Kristina Pentieva, Marco Vinceti and Misha Vrolijk; and EFSA staff members: Irene Muñoz Guajardo and Laura Ciccolallo. The Panel also wishes to thank Carmen Peláez for her contribution as member of the NDA Panel until June 2023. The Panel acknowledges Alexandr Parlesak, Talia Theresa Masino, Kia Daniela Reis, Caroline Filskov Petersen, Jacob Juel Christensen, Thomas Olsen and Inge Tetens for the preparatory work as part of a procurement procedure. The Panel also wishes to acknowledge the contribution of all national institutions in European countries that provided consumption data for this scientific output and the authors of published articles who provided additional information upon request.
APPENDIX A. Literature screening and selection – Flow charts
A.1. PRISMA Flow Diagram of systematic reviews 5a and 5b

A.2. PRISMA Flow Diagram of systematic reviews 2b, 3a, 6a and 6b

APPENDIX B. Evidence tables
B.1. Prospective cohort studies on type 2 diabetes mellitus
| Reference study name country study design follow‐up funding | Original cohort (N total) population sampled exclusion criteria study population (n) | Ascertainment of outcome | Exposure groups n/person‐years exposure assessment method | Incident cases | Model covariates | Results |
|---|---|---|---|---|---|---|
|
Bao et al. ( 2016 ) Long‐term risk of type 2 diabetes in relation to habitual iron intake in women with a history of gestational diabetes: a prospective cohort study USA Design: PC Follow‐up: up to 18 years Funding: National Institute of Health Grants; the author was supported by the American Diabetes Association |
N = 116,430 Population sampled: female nurses aged 24–44 years Exclusion criteria: chronic diseases (T2DM, cardiovascular disease or cancer) before GDM pregnancy or before the return of their first post‐GDM FFQ, multiple‐birth pregnancy or returned no post‐GDM FFQ % lost to follow up: NR n = 3976 Sex (as %women): 100% Age, heterogeneity p = 0.22 (unit: years; values: Mean ± SD): Q1: 37.5 ± 4.6 Q2: 37.7 ± 4.6 Q3: 37.9 ± 4.5 Q4: 37.6 ± 4.7 BMI at baseline, heterogeneity p < 0.001 (unit: kg/m2; values: mean ± SD): Q1: 27.1 ± 6.7 Q2: 27.4 ± 6.6 Q3: 26.7 ± 6.1 Q4: 26.1 ± 5.9 Current smoker, heterogeneity p = 0.02 (unit: %; values: mean): Q1: 14.4 Q2: 12.5 Q3: 9.1 Q4: 7.4 |
Participants who reported physician‐diagnosed T2DM in a biennial questionnaire were mailed an additional questionnaire regarding symptoms, diagnostic tests and hypoglycaemic therapy to confirm self‐reported diagnoses Confirmed diabetes cases were defined according to the American Diabetes Association criteria as follows: (1) one or more classic symptoms (excessive thirst, polyuria, unintentional weight loss or hunger) plus elevated glucose concentrations (fasting plasma glucose concentration ≥ 7.0 mmol/L or random plasma glucose concentration ≥ 11.1 mmol/L); (2) no symptoms reported but ≥ 2 elevated plasma glucose concentrations on more than one occasion (fasting concentration ≥ 7.0 mmol/L; random concentration ≥ 11.1 mmol/L, or 2‐h oral‐glucose‐tolerance test concentration ≥ 11.1 mmol/L); or (3) treatment with insulin or an oral hypoglycaemic agent |
Unit of measurement: (mg/day, value: median/range) Quartiles of energy‐adjusted intakes (residual method) Total iron Q1: 11.6 Q2: 14.9 Q3: 21.1 Q4: 37.2 Supplemental iron Q1: 0 Q2: 0.1–29.9 Q3: ≥ 30 Q4: – Method: semiquantitative FFQ, food‐composition data from USDA sources and data from manufacturers |
641 incident T2DM cases during 57,683 person‐years n/person‐years Total iron Q1: 139/14,431 Q2: 171/14,436 Q3. 165/14,405 Q4: 166/14,411 Supplemental iron Q1: 252/26,942 Q2: 340/26,072 Q3: 49/4669 Q4: – |
M1: Age M2: M1 + parity, BMI, age at first birth, race‐ethnicity, family history of diabetes, oral contraceptive use, menopausal status, cigarette smoking, alcohol intake, PA, the ratio of PUFA intake to SFA intake and intakes of total energy, SFA, trans fat, dietary cholesterol, animal protein, vegetable protein, glycaemic load, cereal fibre, calcium, magnesium and vitamin C For the analysis of supplemental iron, an adjustment for intakes of dietary iron was also performed |
HRs (95% CIs) Total iron M1: P trend: 0.28 Q1: 1 Q2: 1.23 (0.96, 1.58) Q3: 1.05 (0.81, 1.35) Q4: 1.22 (0.95, 1.57) M2: P trend: 0.02 Q1: 1.00 (reference) Q2: 1.48 (1.11, 1.97) Q3: 1.33 (0.98, 1.80) Q4: 1.64 (1.20, 2.25) Supplemental iron M1: P trend: 0.01 Q1: 1 Q2: 1.21 (1.01, 1.46) Q3: 1.50 (1.07, 2.10) Q4: – M2: P trend: 0.002 Q1: 1 Q2: 1.47 (1.18, 1.84) Q3: 1.83 (1.25, 2.70) Q4: – |
|
Eshak et al. ( 2018 ) Japan Collaborative Cohort Study for Evaluation of Cancer Risk (JACC Study) Japan Design: PC Follow‐up: 5 years Funding: Comprehensive Research on Cardiovascular and Lifestyle Related Diseases (H26‐Junkankitou [Seisaku]‐Ippan‐001), the Japanese Ministry of Education, Culture, Sports, Science and Technology by Grants‐in‐ Aid for Scientific Research; Grants‐in‐Aid for Scientific Research on Priority Areas of Cancer and Grants‐in‐Aid for Scientific Research on Priority Areas of Cancer Epidemiology |
N = 110,585 (46,395 men and 64,190 women) Population sampled: General population 40–79 years from 45 communities Exclusion criteria: prior history of diabetes, cancer or cardiovascular diseases, missing information on dietary iron, copper and zinc intakes, history of diabetes and non‐respondents to the 5‐year questionnaire, older than 65 years % loss to follow up: NR n = 16,160 (5955 males and 10,205 females) Sex, heterogeneity p < 0.001 (as %women): Q1: 47 Q2: 64 Q3: 70 Q4: 72 Age, heterogeneity p < 0.001 (Unit: years; values: mean ± SD), Q1: 52.2 ± 7.6 Q2: 52.5 ± 7.5 Q3: 53.0 ± 7.4 Q4: 54.2 ± 7.1 BMI (Unit: kg/m2; Values: mean ± SD) Q1: 22.9 ± 2.9 Q2: 22.8 ± 2.7 Q3: 22.8 ± 2.7 Q4: 22.9 ± 2.8 Current smoking, heterogeneity p = 0.01 (Unit: %) Q1: 32 Q2: 21 Q3: 17 Q4: 15 Family history of diabetes, heterogeneity p = 0.001 (Unit: %) Q1: 9.3 Q2: 10.7 Q3: 9.2 Q4: 7.4 |
Self‐reported physician's diagnosis; compared with laboratory findings in around 20% of the participants |
Unit of measurement: (mg/day, value: mean ± SD) Quartiles of energy‐adjusted iron intakes (residual method) Total iron Q1: 5.1 ± 1.0 Q2: 6.9 ± 0.4 Q3: 8.1 ± 0.4 Q4: 10.1 ± 1.1 Method: Validated FFQ; Nature of Food Composition Tables NR |
n/total N Q1: 126/4040 Q2: 104/4040 Q3: 84/4040 Q4: 82/4040 |
M1: adjusted for age and sex M2: M1 + family history of diabetes, past history of hypertension, smoking status, BMI (quartiles), hours of walking and hours of exercise M3: M2 + alcohol intake, coffee intake, green tea intake, quartiles of total energy intake and quartiles of energy‐adjusted intakes for magnesium and carbohydrate M4: M3 + quartiles of energy‐adjusted copper and zinc |
OR (95% CI) Total iron: M1: P trend: 0.02 Q1: 1 Q2: 1.59 (1.22–2.09) Q3: 1.41 (1.17–1.85) Q4: 1.38 (1.15–1.80) M2: P trend: 0.01 Q1: 1 Q2: 1.55 (1.14–2.12) Q3: 1.40 (1.08–1.82) Q4: 1.39 (1.12–1.87) M3: P trend: 0.03 Q1: 1 Q2: 1.45 (1.12–1.99) Q3: 1.33 (1.05–1.71) Q4: 1.33 (1.05–1.75) M4: P trend: 0.03 Q1: 1 Q2: 1.42 (1.10–1.96) Q3: 1.31 (1.03–1.68) Q4: 1.32 (1.04–1.70) |
|
He et al. ( 2020 ) China Health and Nutrition Survey (CHNS) China Design: PC Follow‐up: 24 years Funding: National Institute for Nutrition and Health, China Center for Disease Control and Prevention ‐ Carolina Population Center, University of North Carolina at Chapel Hill, National Institutes of Health and National Institutes of Health Fogarty International Center |
N = 36,387 Population sampled: General population ≥ 18 years old Exclusion criteria: < 18 years, participants who were pregnant, nursing or disabled; had unavailable or incomplete diabetes information; or were lost to follow‐up after the baseline or first survey entry in 2015, participants with missing or implausible energy intake information, a baseline diagnosis of diabetes or a history of stroke, myocardial infarction or any type of tumour at baseline % loss to follow up: NR n = 17,026 (8346 males and 8680 females) Baseline characteristics for quintiles of total iron intake NR |
Self‐reported physician's diagnosis or self‐report of the following: special diet, weight control, oral medicine, injection of insulin, Chinese traditional medicine, home remedies or qigong (or spiritual treatment) |
Unit of measurement: (mg/day, value: median) Quartiles of energy‐adjusted intakes (residual method) Total iron (mg/day): Males Q1: 17.9 Q2: 20.9 Q3: 23.0 Q4: 25.4 Q5: 30.6 Females: Q1: 15.7 Q2: 18.2 Q3: 20.0 Q4: 22.0 Q5: 26.5 Method: 3 consecutive 24‐h recalls + household food inventory over the same 3 days; Chinese Food composition Tables |
n/person‐years Total iron: Males Q1: 106/18,038 Q2: 101/21,223 Q3: 103/21,882 Q4: 110/21,647 Q5: 127/17,976 Females Q1: 112/17,628 Q2: 82/21,216 Q3: 130/22,417 Q4: 123/22,372 Q5: 130/17,736 |
M1: adjusted for age, BMI, dietary intake of total energy M2: M1 + residence area, education level, household income level, PAL, smoking status, alcohol consumption and history of hypertension at baseline M3: M2 + dietary intake of carbohydrates, protein, ratio of MUFA‐to‐SFA intake, ratio of PUFA‐to‐SFA intake, cholesterol, magnesium, cereal fibre, vegetables and fruits |
HR (95% CI) Total iron: Males M1: P trend: 0.505 Q1: 1 Q2: 0.73 (0.56–0.97) Q3: 0.66 (0.50–0.87) Q4: 0.69 (0.53–0.91) Q5: 1.00 (0.77–1.29) M2: P trend: 0.793 Q1: 1 Q2: 0.73 (0.55–0.96) Q3: 0.65 (0.49–0.85) Q4: 0.67 (0.51–0.88) Q5: 0.94 (0.73–1.23) M3: P trend: 0.513 Q1: 1 Q2: 0.73 (0.55–0.96) Q3: 0.61 (0.46–0.82) Q4: 0.60 (0.44–0.80) Q5: 0.81 (0.60–1.11) Females M1: P trend: 0.150 Q1: 1 Q2: 0.57 (0.43–0.77) Q3: 0.78 (0.61–1.01) Q4: 0.70 (0.54–0.91) Q5: 1.03 (0.80–1.33) M2: P trend: 0.198 Q1: 1 Q2: 0.55 (0.42–0.74) Q3: 0.75 (0.58–0.96) Q4: 0.69 (0.53–0.90) Q5: 0.99 (0.77–1.28) M3: P trend: 0.203 Q1: 1 Q2: 0.54 (0.41–0.72) Q3: 0.68 (0.52–0.89) Q4: 0.57 (0.43–0.76) Q5: 0.70 (0.52–0.96) |
|
Jiang et al. ( 2004 ) Health Professionals' Follow‐up Study (HPFS) USA Design: PC Follow‐up: 12 years Funding: NR |
N = 51,529 Population sampled: male health professionals 40–75 years Exclusion criteria: missing or implausible information on diet, history of diabetes, cardiovascular disease (angina, coronary bypass or angioplasty, myocardial infarction and stroke) or cancer (except for nonmelanoma skin cancer) at baseline % loss to follow up: NR n = 38,394 Age (Unit: years; values: mean ± SD) Total iron: Q1: 52.4 ± 9.4 Q5: 54.2 ± 9.4 BMI, (Unit: kg/m2; Values: mean ± SD) Total iron: Q1: 25.6 ± 3.2 Q5: 25.1 ± 3.0 Current smoker (Unit: %) Total iron: Q1: 13.8 Q5: 8.2 Family history of diabetes, (Unit: %) Total iron: Q1: 12.7 Q5: 13.0 |
Participants who indicated a T2DM diagnoses in any of the biennial questionnaires were mailed a supplementary questionnaire regarding diabetes symptoms, diagnostic tests and treatments. T2DM was ascertained when at least one of the following criteria were met: at least one classic symptom (excessive thirst, polyuria, weight loss, hunger or coma) plus a fasting plasma glucose concentration ≥ 140 mg/dL (7.8 mmol/L) or a random plasma glucose concentration ≥ 200 mg/dL (11.1 mmol/L), 2) elevated plasma glucose concentrations on ≥ 2 occasions (a fasting plasma glucose concentration ≥ 140 mg/dL, a random plasma glucose concentration ≥ 200 mg/dL or a random plasma glucose concentration ≥ 200 mg/dL after ≥ 2 h of oral‐glucose‐tolerance testing) in the absence of symptoms, or 3) treatment with hypoglycaemic medication (insulin or oral hypoglycaemic agents) |
Dietary iron intake (values: median): Quartiles of energy‐adjusted intakes Total iron (mg/day): Q1: 11.1 Q2: 13.1 Q3: 15.2 Q4: 19.7 Q5: 34.2 Method: SFFQ (every 4 years); Harvard University Food Composition Database + manufacturer's information |
n/total N Total iron: Q1: 237/7751 Q2: 253/NR Q3: 267/NR Q4: 224/NR Q5: 187/7503 |
M1: adjusted for age M2: M1 + BMI M3: BMI, family history of diabetes in a first‐degree relative, physical activity cigarette smoking, alcohol consumption, intakes of total energy, trans fat, cereal fibre, magnesium, whole grains, vegetables and fruit, ratio of polyunsaturated fat intake to saturated fat intake, glycaemic load and multivitamin use |
RR (95% CI) Total iron: M1: P trend: < 0.001 Q1: 1 Q2: 1.06 (0.88–1.26) Q3: 1.14 (0.95–1.36) Q4: 0.92 (0.77–1.11) Q5: 0.78 (0.64–0.94) M2: P trend: 0.03 Q1: 1 Q2: 1.03 (0.86–1.23) Q3: 1.17 (0.97–1.39) Q4: 0.99 (0.82–1.19) Q5: 0.87 (0.71–1.05) M3: P trend: 0.67 Q1: 1 Q2: 1.10 (0.91–1.33) Q3: 1.36 (1.11–1.66) Q4: 1.23 (0.99–1.53) Q5: 1.16 (0.92–1.47) |
|
Jung et al. ( 2021 ), Kim et al. ( 2017 ) Korean Genome and Epidemiology Study (KoGES) Ansan–Ansung cohort South Korea Design: PC Follow‐up: 12 years (Jung et al., 2021) Mean Follow‐up: 8.4 years (Jung et al., 2021) Follow‐up: 10 years (Kim et al., 2017) Funding: No source of supporting to declare (Jung et al., 2021) This research was supported by a fund (HD14B0005) from Research of Korea Centers for Disease Control and Prevention and supported by a grant of the Korea Health Technology R&D Project through the Korea Health Industry Development Institute (KHIDI), funded by the Ministry of Health & Welfare, Republic of Korea (HI16C2048). (Kim et al., 2017) |
N = 10,038 (Jung et al., 2021; Kim et al., 2017) Population sampled: General population, community‐dwellers and participants recruited from the national health examinee registry, 40–69 years (Jung et al., 2021; Kim et al., 2017) Exclusion criteria: Total iron/total energy intake T2DM at baseline, hepatitis at baseline, no genetic data, no follow‐up data (Jung et al., 2021) Exclusion criteria: Total iron T2DM at baseline, no genetic data, lack of information on medicine intake, coronary artery disease, stroke or cancer, lack of information on food intake or implausible energy intake (Kim et al., 2017) % loss to follow up: 14 (n = 1356) (Jung et al., 2021) Total iron/total energy intake (Jung et al., 2021) n = 6413 Total iron (Kim et al., 2017) n = 7024 = 3326 males and 3698 females Sex (as %women) (Jung et al., 2021) Total iron to total calorie ratio heterogeneity p < 0.001 Q1: 47.8 Q2: 48.9 Q3: 53.3 Q4: 58.3 Age (Jung et al., 2021) (Unit: years; Values: mean ± SD) Total iron to total calorie ratio heterogeneity p < 0.001 Q1: 53.2 ± 9.0 Q2: 51.3 ± 8.6 |
T2DM was ascertained when at least one of the following criteria was met: (1) fasting blood glucose ≥ 126 mg/dL, (2) HbA1c ≥ 6.5% (48 mmol/mol), (3) 2‐h plasma glucose level ≥ 200 mg/dL during a 75 g OGTT, (4) currently taking an anti‐diabetic drug or insulin, (5) previous diagnosis by a physician |
Total iron/total energy intake (unit: μg/kcal; values: mean ± SD) Dietary iron intakes were divided by the total caloric intakes. (Jung et al., 2021) Q1: 3.87 ± 0.52 Q2: 5.01 ± 0.25 Q3: 5.83 ± 0.25 Q4: 7.34 ± 1.12 Total iron (unit: mg/day; values: median (range)) (Kim et al., 2017) Males T1: 7.9 (4.0–9.2) T2: 10.2 (9.2–11.3) T3: 12.5 (11.3–28.8) Females T1: 7.5 (2.9–8.7) T2: 9.8 (8.7–10.7) T3: 12.1 (10.7–35.3) Method: validated SFFQ + food composition database developed by Korean Nutrition Society (Jung et al., 2021) Method: semi quantitative FFQ and the seventh edition Food Composition Table of Korea (Kim et al., 2017) |
Total iron/total energy intake (Jung et al., 2021) 762 T2DM cases out of 6413 individuals n/person‐years Q1: 164/13,274 Q2: 203/13,680 Q3: 183/14,010 Q4: 212/13,280 Total iron (Kim et al., 2017) 984 T2DM cases out of 7024 individuals n/person‐years Males T1: 151/6760 T2: 194/6741 T3: 197/6519 Females T1: 114/7528 T2: 156/7520 T3: 172/7467 |
Total iron/total energy intake (Jung et al., 2021) M1: adjusted for age, sex M2: M1+ baseline BMI, glucose, HOMA‐IR (homeostatic model for assessment for insulin resistance), HbA1c, HDL‐cholesterol, triglycerides, total cholesterol, carbohydrates, fat, protein, smoking Total iron: (Kim et al., 2017) Males and Females: age, BMI, waist circumference (WC), daily dietary intake (total energy intake, carbohydrate, protein, fat, Zn, Vitamin C, Tea intake, Meat intake), residential area, education, drinking status, smoking status, regular exercise, dietary supplement use, WC and carbohydrate, zinc, vitamin C, tea and meat intake |
Total iron/total energy intake (Jung et al., 2021) OR (95% CI) M1: P trend: 0.002 Q1: 1.00 (ref) Q2: 1.32 (1.06–1.65) Q3: 1.21 (0.97–1.52) Q4: 1.45 (1.16–1.81) M2: P trend: 0.004 Q1: 1.00 (ref) Q2: 1.30 (1.02–1.67) Q3: 1.20 (0.94–1.56) Q4: 1.43 (1.11–1.86) Total iron (Kim et al., 2017) HR (95% CI) Males: P trend: 0.027 T1: 1 T2: 1.31 (1.03–1.68) T3: 1.39 (1.04–1.85) Females: P trend: 0.002 T1: 1 T2: 1.35 (1.03–1.79) T3: 1.57 (1.14–2.15) |
|
Q3: 50.9 ± 8.5 Q4: 50.9 ± 8.5 Total iron (mean values in mg/day ± SD) (Kim et al., 2017) Males Heterogeneity p < 0.0004 T1: 51.9 ± 8.9 T2: 50.3 ± 8.4 T3: 50.6 ± 8.3 Females (mean values in mg/day ± SD) (Kim et al., 2017) heterogeneity p < 0.0001 T1: 53.2 ± 9.1 T2: 51.2 ± 8.7 T3: 51.1 ± 8.7 BMI (Jung et al., 2021) (Unit: kg/m2; Values: mean ± SD) Total iron to total calorie ratio heterogeneity p < 0.001 Q1: 24.2 ± 3.3 Q2: 24.4 ± 3.0 Q3: 24.6 ± 2.95 Q4: 24.5 ± 3.2 BMI (Kim et al., 2017 ) (Unit: kg/m2; Values: mean ± SD) Males heterogeneity p < 0.0004 T1: 24.0 ± 0.1 T2: 24.1 ± 0.1 T3: 24.4 ± 0.1 Females heterogeneity p < 0.0697 T1: 24.6 ± 0.1 T2: 24.8 ± 0.1 T3: 24.8 ± 0.1 |
||||||
|
Current smoking, (%) (Jung et al., 2021) Total iron to total calorie ratio heterogeneity p < 0.001 Q1: 28.7 Q2: 26.4 Q3: 22.1 Q4: 23.1 Current smoking, (%) (Kim et al., 2017) Males Heterogeneity p < 0.0033 T1: 54.3 T2: 47.3 T3: 48.0 Females Heterogeneity < 0.0647 T1: 3.0 T2: 3.3 T3: 4.4 |
||||||
|
Lee et al. ( 2004 ) Iowa Women's Health Study (IWHS) USA Design: PC Follow‐up: 11 years Funding: NR |
N = 41,836 Population sampled: post‐menopausal women, aged 55–69 years Exclusion criteria: implausibly high or low energy intakes, left ≥ 30 items blank on the FFQ, premenopausal or reported diabetes at baseline. % lost to follow up: NR n = 35,698 Sex (as %women): 100% Age (unit: years; values: mean): Supplemental iron No: 61.6 Yes: 61.7 BMI (unit: kg/m2; values: mean): Supplemental iron No: 26.8 Yes: 26.4 Current smoker (value: %) Supplemental iron No: 15.5 Yes: 13.9 |
Self‐report |
Supplemental iron (unit: mg/day) Q1: 0 Q2: 1–29 Q3: ≥ 30 Method: SFFQ; information on food composition tables NR |
1921 T2DM cases out of 35,698 individuals n/person‐years Supplemental iron G1: 1588/267,757 G2: 254/52,303 G3: 79/12,794 |
M1: Age and energy intake M2: Age, total energy intake, WHR, BMI, PA, cigarette smoking, alcohol consumption, education, marital status, residential area and hormone replacement therapy. M3: M2 + animal fat, vegetable fat, cereal fibre, dietary magnesium, dietary non‐haem iron, dietary haem iron and supplemental iron. |
RR (95% CI reported only for the highest iron category) Supplemental iron M1: P for trend: 0.08 G1: 1.00 G2: 0.82 G3: 1.03 (0.83–1.30) M2: P for trend: 0.90 G1: 1.00 G2: 0.93 G3: 1.14 (0.91–1.44) M3: P for trend: 0.79 G1: 1.00 G2: 0.94 G3: 1.16 (0.92–1.46) |
|
Li et al., (2021) Guangzhou Nutrition and Health Study (GNHS) China Design: PC Follow‐up: median: 5.6 years (IQR: 4.1–5.9 years) Funding: National Natural Science Foundation of China and the Key Project of Science and Technology Program of Guangzhou |
N (with two follow‐ups) = 3158 N (with one follow‐up) = 834 Population sampled: General population 40–75 years Exclusion criteria: Diabetes at baseline, severe chronic diseases at baseline, diabetes developed within the first year, extreme (high > 4000 kcal for males and > 3500 kcal for females or low < 800 kcal for males and < 500 kcal for females) energy intake, missing data on fasting glucose, HbA1c, missing data on diet variables or other variables (height, socio‐demographics). % loss to follow up: 12 n = 2696 Sex (as % women) Total iron: Q1: 70.9 Q4: 70.8 Age (unit: years; values: mean ± SD) Total iron: Q1: 58.0 ± 5.7 Q4: 57.9 ± 5.5 Current smoker (unit: %): Total iron: Heterogeneity p = 0.777 Q1: 15.3% Q4: 13.5% BMI, (Unit: kg/m2; Values: mean ± SD) Total iron: Q1: 23.3 ± 3.0 Q4: 23.1 ± 2.9 |
Fasting glucose ≥7.0 mmol/L or HbA1c ≥ 6.5% (n = 139); or self‐reported diagnosed T2DM (n = 66) |
Dietary iron intake (values: median): Sex‐specific quartiles of energy‐adjusted intakes Total iron (mg/day): Q1: 17.54 Q2: 19.37 Q3: 20.88 Q4: 23.21 Method: Validated FFQ; Chinese Food Composition Table |
205 T2DM cases out of 2696 individuals Total iron n/person‐years Q1: 46/3387 Q2: 55/3381 Q3: 43/3374 Q4: 61/3334 |
M1: Adjusted for age, BMI, education level, household income, smoking status, alcohol drinking status and physical activity. M2: M1 + intakes of total energy, protein, fibre, cholesterol, the ratio of PUFA:SFA, Mg, vitamin C, meat, vegetables and fruit (all in sex‐specific quartiles), additionally adjusted non‐haem Fe for haem Fe and adjusted haem Fe for non‐haem Fe. |
HR (95% CI) Total iron M1: P trend: 0.134 Q1: 1.00 (ref) Q2: 1.28 (0.86–1.90) Q3: 0.94 (0.62–1.43) Q4: 1.45 (0.98, 2.12) M2: P trend: 0.391 Q1: 1.00 (ref) Q2: 1.28 (0.83–1.96) Q3: 0.96 (0.58–1.60) Q4: 1.34 (0.77–2.34) |
|
Rajpathak et al. ( 2006 ) Nurses' Health Study (NHS) USA Design: PC Follow‐up: 20 years Funding: National Institutes of Health Grants and an American Heart Association Established Investigator Award |
N = 121,700 Population sampled: female registered nurses, age 30–55 from 11 U.S. states Exclusion criteria: Women without FFQ data at baseline or those with unreasonably high or low energy intakes and those who had left > 10 items blank, participants with history of cancer other than nonmelanoma skin cancer, CVD or diabetes % lost to follow up: NR n = 85,031 Sex (as %women): 100 Age (Unit: years; values: mean): Total iron Q1: 45.6 Q3: 45.9 Q5: 45.9 BMI (Unit: kg/m2; values: mean): Total iron Q1: 24.2 Q3: 24.2 Q5: 23.7 Current smoker (value: %) Total iron Q1: 19.6 Q3: 13.9 Q5: 10.6 |
Self‐report of a T2DM diagnosis PLUS one of the following: (1) at least one of the classic symptoms (polydipsia, polyuria, polyphagia, weight loss or coma) in addition to a fasting plasma glucose level of ≥ 140 mg/dL (7.8 mmol/L) or a random level of ≥ 200 mg/dL (11.1 mmol/L); (2) at least two elevated plasma glucose concentrations on different occasions (see above or ≥ 200 mg/dL (11.1 mmol/L) after at least 2 h of oral glucose tolerance testing in the absence of symptoms; or 3) treatment with oral drugs for hyperglycaemia or with insulin |
Unit of measurement: (unit: mg/day, value: median (range)) Sex‐specific quartiles of energy‐adjusted intakes Total iron (diet and supplement) Q1: 8.0 (2.0–9.0) Q2: 9.6 (9.0–10.3) Q3: 11.0 (10.3–12.4) Q4: 14.0 (12.4–17.4) Q5: 24.0 (17.4–400) Dietary iron Q1: 8.0 (2.0–9.0) Q2: 9.2 (9.0–10.0) Q3: 10.3 (10.0–11.0) Q4: 11.5 (11.0–12.3) Q5: 14.0 (12.3–87.0) Supplemental iron Q1: 0 Q2: 3.4 (0.2–5.5) Q3: 8.4 (5.5–10.4) Q4: 12.6 (10.4–15.9) Q5: 22.0 (15.9–391.7) Method: Dietary intake collected every 2 years by FFQs. In 1980, a 61‐item FFQ was used and in 1984, 1986, 1990, 1994 and 1998, an expanded (131‐item) FFQ was used. Reproducibility and validity of FFQs have been reported in detail. USDA food composition data. Cumulative average intake defined as a measure of long‐term diet, calculated based on FFQ data provided until the beginning of each 2‐year follow‐up interval. |
4599 T2DM cases out of 85,031 individuals. n/person‐years Total iron Q1: 675/260,205 Q2: 1103/372,142 Q3: 1028/317,664 Q4: 956/314,337 Q5: 837/314,635 Dietary iron Q1: 798/298,521 Q2: 916/291,825 Q3: 960/306,210 Q4: 939/300,464 Q5: 791/294,837 Supplemental iron Q1: 3104/1,071,670 Q2: 413/133,012 Q3: 330/123,760 Q4: 422/124,333 Q5: 330/126,207 |
M1: Age adjusted M2: Age and BMI adjusted M3: Nondietary factors adjusted: Nondietary factors include age, BMI, family history of diabetes, smoking status, alcohol intake, quintiles of PA, postmenopausal hormone use and use of multivitamin supplements. M4: Dietary and nondietary factors adjusted: Dietary factors include intake of kcal/day, cereal fibre, magnesium, PUFA‐to‐SFA ratio, glycaemic load, caffeine and trans‐fat. Iron supplement users excluded in these analyses. |
[HR] (95% CIs) Total iron M1: P for trend < 0.0001 Q1: 1 Q2: 1.05 (0.95–1.16) Q3: 0.98 (0.88–1.08) Q4: 0.83 (0.75–0.92) Q5: 0.75 (0.67–0.83) M2: P for trend < 0.0001 Q1: 1 Q2: 0.97 (0.88–1.07) Q3: 0.91 (0.83–1.01) Q4: 0.85 (0.77–0.94) Q5: 0.82 (0.73–0.91) M3: P for trend: 0.0006 Q1: 1 Q2: 0.97 (0.88–1.07) Q3: 0.89 (0.81–0.99) Q4: 0.76 (0.74–0.93) Q5: 0.74 (0.72–0.92) M4: P for trend: 0.78 Q1: 1 Q2: 1.05 (0.95–1.16) Q3: 1.05 (0.94–1.17) Q4: 1.03 (0.92–1.16) Q5: 1.02 (0.90–1.15) Dietary iron M1: P for trend < 0.0001 Q1: 1 Q2: 1.05 (0.96–1.16) Q3: 0.99 (0.90–1.08) Q4: 0.95 (0.87–1.05) Q5: 0.76 (0.69–0.84) M2: P for trend < 0.0001 Q1: 1 Q2: 0.98 (0.89–1.08) Q3: 0.91 (0.83–1.00) Q4: 0.88 (0.80–0.97) Q5: 0.79 (0.71–0.87) M3: P for trend < 0.0001 |
|
Simple update with 4‐years latency was defined as prediction of the risk during a 4‐year interval based on intake data collected 4‐years prior to the start of this prediction interval |
Q1: 1 Q2: 0.98 (0.89–1.08) Q3: 0.91 (0.82–0.99) Q4: 0.89 (0.80–0.98) Q5: 0.78 (0.70–0.86) M4: P for trend: 0.90 Q1: 1 Q2: 1.06 (0.96–1.17) Q3: 1.03 (0.93–1.14) Q4: 1.07 (0.96–1.19) Q5: 1.02 (0.91–1.15) Supplemental iron M1: P for trend < 0.0001 Q1: 1 Q2: 0.81 (0.73–0.90) Q3: 0.74 (0.66–0.83) Q4: 0.90 (0.80–1.01) Q5: 0.74 (0.65–0.84) M2: P for trend: 0.08 Q1: 1 Q2: 0.88 (0.80–0.98) Q3: 0.81 (0.72–0.92) Q4: 1.01 (0.89–1.14) Q5: 0.88 (0.77–0.99) M3: P for trend: 0.19 Q1: 1 Q2: 0.90 (0.80–1.00) Q3: 0.85 (0.75–0.96) Q4: 1.04 (0.91–1.18) Q5: 0.90 (0.79–1.04) M4: P for trend: 0.67 Q1: 1 Q2: 0.92 (0.82–1.03) Q3: 0.85 (0.75–0.96) Q4: 1.08 (0.95–1.23) Q5: 0.96 (0.84–1.10) |
|||||
|
Song et al. ( 2004 ) Women's Health Study (WHS) USA Design: PC (analysis of an RCTs using aspirin and vitamin E including the intervention and placebo arms) Follow‐up: average 8.8 years Funding: National Institutes of Health, National Institute of Diabetes and Digestive and Kidney Diseases Grant DK‐02767 |
N = 39,876 Population sampled: female health professionals aged ≥ 45 years free of coronary heart disease, stroke and cancer (other than nonmelanoma skin cancer) Exclusion criteria: missing or implausible dietary data (> 70 items left blank in their SFFQ), diabetes at baseline and with energy intake outside the range of 600–3500 kcal n = 37,309 Baseline characteristics in quantiles of total iron or haem iron intake not reported |
Self‐report plus verification via telephone interview or mailed questionnaires to physicians |
Unit of measurement: (mg/day; value: median) Quartiles of energy‐adjusted intakes (residual method) Total iron Q1: 10.0 Q2: 11.8 Q3: 13.7 Q4: 18.0 Q5: 33.8 Method: SFFQ, Harvard food composition database |
1558 T2DM cases during 326,876 person‐years n/person‐years Total iron Q1: 304/65,405 Q2: 365/65,431 Q3: 353/65,076 Q4: 267/65,450 Q5: 269/65,514 |
M1: Age and energy intake M2: M1 + BMI, smoking, exercise, alcohol use and family history of diabetes M3: M2 + fibre intake, glycaemic load, magnesium, total fat |
[HR] (95% CI) Total iron M1: P trend: 0.001 Q1: 1 Q2: 1.17 (1.00–1.36) Q3: 1.11 (0.95–1.30) Q4: 0.83 (0.70–0.98) Q5: 0.86 (0.73–1.02) M2: P trend: 0.37 Q1: 1 Q2: 1.18 (1.01–1.38) Q3: 1.14 (0.97–1.34) Q4: 0.99 (0.83–1.17) Q5: 1.03 (0.87–1.22) M3: P trend: 0.94 Q1: 1 Q2: 1.24 (1.05–1.45) Q3: 1.23 (1.04–1.46) Q4: 1.09 (0.90–1.31) Q5: 1.13 (0.93–1.37) |
Abbreviations: BMI, body mass index; CI, confidence interval; CVD, cardiovascular disease; Fe, iron; FFQ, food frequency questionnaire; FPG, fasting blood glucose; GDM, gestational diabetes mellitus; HR, hazard ratio; M, model; N, total number; n, number analysed; NR, not reported; OR, odds ratio; PA, physical activity; PC, prospective cohort study; PUFA, polyunsaturated fatty acid; Q, quartile; RR, risk ratio; SD, standard deviation; SFA, saturated fatty acid; SFFQ, semi‐quantitative FFQ; T2DM, type 2 diabetes mellitus; USA, United States of America; USDA, United States Department of Agriculture; WHR, waist hip ratio.
B.2. Intervention studies on gestational diabetes mellitus
| First author publication year country study title duration funding | Design N: Number randomised n: Number analysed | Subject characteristics at baseline/the beginning of the intervention | Intervention | Outcome assessment | Results |
|---|---|---|---|---|---|
|
Chan et al. ( 2009 ) Hong Kong Duration: mean recruitment at 11.3 gestational weeks Funding: Public |
RCT, parallel, single‐blind Inclusion: Women with singleton pregnancy Exclusion: Diabetes, haemoglobinopathies, Hb levels lower than 8 g/dL or greater than 14 g/dL or had gestational age > 16 weeks, women with mean corpuscular volume < 80 would be considered as possibly having thalassaemia N = 1164 OGTT at 28–30 gestational weeks = 1042 Second OGTT at 36 gestational weeks = 492 |
G1 Control: Age (years, mean, SD): 31.3, 0.18 BMI (kg/m2, mean SD): 21.0, 0.11 Family history of diabetes mellitus (%): 24.2 G2 Intervention: Age (years, mean, SD): 31.3, 0.19 BMI (kg/m2, mean SD): 20.8, 0.11 Family history of diabetes mellitus (%): 23.0 |
Supplement form: Tablet Intervention: 1× daily G1 (Control group): Placebo, containing starch and lactose G2 (Fe group): 300 mg ferrous sulfate (60 mg of elemental iron) Co‐intervention: None Background nutrient intake: 7‐day dietary survey Compliance: Checked by counting the number of tablets remaining. In 977 (83.9%) women for whom compliance could be assessed, the overall compliance was on average 54.4% at gestational weeks 28–30 and 63% at gestational week 36 |
OGTT at three time points (shortly after recruitment for those with risk factors, at 28–30 weeks of gestation and at 36 weeks of gestation) |
Cases/total number of subjects 28–30 weeks G1: 60/531 G2: 56/511 36 weeks G1: 17/248 G2: 16/244 No significant differences in the number of women developing GDM between groups |
|
Liu and Pang ( 2018 ) China Duration: from < 16 gestational weeks Funding: NR |
Non‐randomised open label Inclusion: gestational age less than 16 weeks, and Hb levels between 8 and 14 g/dL Exclusion: Subjects were excluded if they had existing diabetes mellitus, abnormal Hb (Hb <8g/dL, or Hb > 14g/dL) and received supplemental iron only after 16 weeks gestation N = NR n = 259 |
G1 Control: Age (years, mean, SD): 31.1, 1.5 BMI (kg/m2, mean SD): 20.5, 0.5 Family history of GDM: 38.9% G2 Intervention: Age (years, mean, SD): 30.9, 1.3 BMI (kg/m2, mean SD): 20.6, 0.4 Family history of GDM: 31.9% |
Supplement form: NR Intervention: 1× daily G1 (Control group): NR G2 (Fe group): 300 mg Co‐intervention: None Background nutrient intake: NR Compliance: NR |
NR |
Cases/total number of subjects G1: 9/124 G2: 10/135 |
|
Ouladsahebmadarek et al. ( 2011 ) Iran Duration: From the 13th gestational week Funding: Public |
RCT, parallel, double‐blind Inclusion: at first trimester of a singleton pregnancy, Hb > 12 g/dL, had not taken iron containing supplements in the last month, BP < 140/90 mmHg, planned to go for all their prenatal care to the prenatal clinic Exclusion from analysis: Hb < 10.5 g/dL and < 11 g/dL at the end of 2nd and 3rd trimesters respectively, miscarriage of current pregnancy, abnormality of the foetus, loss to follow‐up N = 960 n = 782 |
Non‐anaemic women G1 Control: Age (years, mean, SD): 25.5, 5.0 Weight (kg, mean, SD): 64.5, 11.7 G2 Fe group: Age (years, mean, SD): 26.3, 5.3 Weight (kg, mean, SD): 66.6, 10.9 |
Supplement form: Tablet Intervention: 1× daily G1 (Control group): Placebo and multivitamin tablet G2 (Fe group): 30 mg of elemental iron and multivitamin tablet Co‐intervention: Multivitamin tablet Background nutrient intake: NR Compliance: NR |
Questionnaire |
Cases/total number of subjects G1: 3/372 G2: 2/410 |
Abbreviations: BMI, body mass index; Fe, iron; G, group; GDM, gestational diabetes mellitus; Hb, haemoglobin; Hg, mercury; N, total number; n, number; NR, not reported; OGTT, oral glucose tolerance test; RCT, randomised controlled trial; SD, standard deviation.
B.3. Prospective cohort studies on gestational diabetes mellitus
| Reference study name country study design follow‐up funding | Original cohort (N total) population sampled exclusion criteria study population (n) | Ascertainment of outcome | Exposure groups exposure assessment method | Incident cases n/person‐years n/participants | Model covariates | Results |
|---|---|---|---|---|---|---|
|
Bowers et al. ( 2011 ) Nurses' Health Study II USA Design: PC Funding: Public |
N = 116,671 Population sampled: Female U.S. nurses recruited between 22 and 44 years of age, reporting a pregnancy lasting at least 6 months Exclusion criteria: Multiple gestation, energy intake (< 500 or > 3500 kcal/day), a diagnosis of diabetes, GDM, cancer, cardiovascular disease, peri‐menopausal at baseline or missing information on age, iron intake or vital status. n = 13,475 |
Method: Self‐reported biennially via a questionnaire |
Dietary iron, quintiles of cumulative average intake; median Dietary total iron Q1: 10.30 mg/day Q2: 11.90 mg/day Q3: 13.30 mg/day Q4: 15.00 mg/day Q5: 18.90 mg/day Supplemental iron Q1: 0 mg/day Q2: 5.10 mg/day Q3: 15.00 mg/day Q4: 30.00 mg/day Q5: 60.00 mg/day Total iron (diet & supplements) Q1: 10.70 mg/day Q2: 13.00 mg/day Q3: 16.13 mg/day Q4: 24.15 mg/day Q5: 49.80 mg/day Method: Semiquantitative FFQ covering the past year, administered every 4 years. Cumulative average measurement of iron intake prior to GDM diagnosis |
Cases/total n Dietary total iron Q1: 183/2708 Q2: 211/2695 Q3: 148/2506 Q4: 163/2684 Q5: 162/2882 Supplemental iron Q1: 544/7949 Q2: 40/603 Q3: 95/1654 Q4: 59/1134 Q5: 129/2135 Total iron (diet & supplements) Q1: 180/2380 Q2: 161/2128 Q3: 144/2376 Q4: 154/2673 Q5: 228/3918 |
M1: Age M2: M1 + parity, BMI, physical activity, glycaemic load, polyunsaturated fat intake, cereal fibre, smoking, alcohol, total calories and family history of diabetes |
RR (95% CI) Dietary total iron M1: P trend: 0.05 Q1: 1 Q2: 1.00 (0.82, 1.23) Q3: 0.77 (0.62, 0.95) Q4: 0.84 (0.68, 1.04) Q5: 0.83 (0.68, 1.02) M2: P trend 0.26 Q1: 1 Q2: 0.99 (0.80, 1.24) Q3: 0.83 (0.66, 1.06) Q4: 0.97 (0.77, 1.24) Q5: 1.12 (0.87, 1.45) Supplemental iron M1: P trend: 0.56 Q1: 1 Q2: 0.96 (0.76, 1.22) Q3: 0.89 (0.72, 1.11) Q4: 0.80 (0.64, 1.01) Q5: 0.99 (0.81, 1.20) M2: P trend: 0.97 Q1: 1 Q2: 0.98 (0.76, 1.25) Q3: 0.95 (0.76, 1.19) Q4: 0.86 (0.68, 1.10) Q5: 1.04 (0.84, 1.28) Total iron (diet & supplements) M1: P trend 0.12 Q1: 1 Q2: 0.85 (0.68, 1.07) Q3: 0.80 (0.64, 1.00) Q4: 0.72 (0.58, 0.90) Q5: 0.78 (0.64, 0.96) M2: P trend 0.95 Q1: 1 Q2: 0.86 (0.68, 1.10) Q3: 0.85 (0.67, 1.09) Q4: 0.84 (0.66, 1.07) Q5: 0.90 (0.72, 1.12) |
|
Marí‐Sanchis et al. ( 2018 ) SUN Project Spain Design: PC Funding: Public |
N = 22,175 Population sampled: Spanish university graduates Exclusion criteria: Male, women not responding to the baseline questionnaire before March 2012, participants without any pregnancy during follow‐up, women with diagnoses of GDM at recruitment, women who reported caloric intake below the 1st percentile or above the 99th, women with the previous diagnosis of diabetes n = 3298 |
Method: Initially self‐reported, further adjudicated based on information requested and medical records |
Dietary iron, quartiles, median Dietary total iron Q1: 14.3 mg/day Q2: 16.6 mg/day Q3: 18.5 mg/day Q4: 21.9 mg/day Total iron (diet & supplements) Q1: 14.4 mg/day Q2: 17.0 mg/day Q3: 18.9 mg/day Q4: 22.4 mg/day Method: Semi‐quantitative FFQ |
Cases/total n Dietary total iron Q1: 40/835 Q2: 42/824 Q3: 45/825 Q4: 45/824 Total iron (diet & supplements) Q1: 40/825 Q2: 42/824 Q3: 45/825 Q4: 45/824 |
M1: unadjusted M2: age M3: M2 + BMI, family history of diabetes, parity, multiple pregnancy, smoking, physical activity, hypertension, sugar‐sweetened soft drinks, total energy intake, total fibre intake, special diet, snacking and non‐haem iron in the analysis of haem iron and for haem iron in the analysis of non‐haem iron |
OR (95% CI) Dietary total iron M1: P trend 0.546 Q1: 1 Q2: 1.05 (0.68, 1.64) Q3: 1.13 (0.73, 1.75) Q4: 1.13 (0.73, 1.76) M2: P trend: 0.564 Q1: 1 Q2: 1.03 (0.72, 1.74) Q3: 1.12 (0.72, 1.74) Q4: 1.12 (0.72, 1.74) M3: P trend: 0.471 Q1: Ref. Q2: 1.12 (0.69, 1.80) Q3: 1.24 (0.74, 2.06) Q4: 1.25 (0.67, 2.36) Total iron (diet & supplements) M1: P trend 0.545 Q1: 1 Q2: 1.05 (0.68, 1.64) Q3: 1.13 (0.73, 1.75) Q4: 1.13 (0.73, 1.76) M2: P trend: 0.564 Q1: 1 Q2: 1.03 (0.66, 1.61) Q3: 1.12 (0.72, 1.74) Q4: 1.12 (0.72, 1.74) M3: P trend: 0.465 Q1: Ref. Q2: 1.12 (0.69, 1.80) Q3: 1.24 (0.74, 2.06) Q4: 1.25 (0.67, 2.36) |
|
Zhang, Xu, et al. ( 2021 ) Tongji Maternal and Child Health Cohort China Design: PC Funding: Public |
N = 8649 Population sampled: pregnant enrolled at their 1st prenatal visit within 16 weeks of gestation Exclusion criteria: Could not speak Chinese, did not intend to receive routine prenatal cares or deliver at one of the three research hospitals, diabetes and/or hypertension before pregnancy, multiple or unclear birth, unreliable information on iron supplement use, no information on GDM diagnosis n = 5101 |
Method: OGTT at 24–28 gestational weeks |
Iron supplementation, based on dose and duration G1: Non‐users G2: iron ≤ 30 mg/day for any duration G3: > 30 mg/day iron for less than 3 months G4: > 30 mg/day iron for more than 3 months Method: Participants were instructed to report whether they used any supplements containing iron from pre‐pregnancy, and if so, more questions were asked about the brand, iron dosage contained, timing and how frequently the item was consumed. Information on supplementation after that was collected at their follow‐up clinic visits during middle pregnancy Iron supplements included both iron‐only supplements and multivitamins and minerals that contained iron |
Cases (%) G1: 106 (7.3) G2: 26 (7.6) G3: 17 (8.1) G4: 57 (14.8) |
Maternal age, pre‐pregnancy BMI, family history of diabetes, education level, mean household income, employed, smoking, alcohol consumption, parity, gestational weight gain at OGTT, early Hb concentrations, gestational age at Hb measurement |
OR (95% CI) G1: 1 G2: 1.15 (0.86, 1.54) G3: 1.14 (0.80, 1.61) G4: 1.53 (1.21, 1.93) p‐trend: 0.001 |
Abbreviations: BMI, body mass index; FFQ, food frequency questionnaire; GDM, gestational diabetes mellitus; Hb, haemoglobin; M, model; N, total number; n, number; OR, odds ratio; PC, prospective cohort study; Q, quartile or quintile; RR, risk ratio.
B.4. Intervention studies on adverse gastrointestinal effects
| First author publication year country study title duration funding | Design N: Number randomised n: Number analysed | Subject characteristics at baseline | Intervention | Outcome assessment | Results |
|---|---|---|---|---|---|
|
Bries et al. ( 2019 ) USA Duration: 9 week (Supplementation for 21 day at a time) Funding: Private |
RCT, cross‐over, double‐blind Inclusion: 18–40 years, BMI 18.5–30 kg/m2, no medication use except contraceptives, no blood donation within 2 m, non‐smoking, non‐pregnant or lactating, no history of chronic diseases, no gastrointestinal‐associated conditions or dietary intolerances; no intake of vitamin, mineral or herbal supplements 1 week before and during the study period, written informed consent Exclusion: Hb < 12 g/dL, SF ≥ 40 μg/L or abnormal kidney, liver and basic metabolic panel indicators N = 17 n = 16 |
% Female: 100 Age, mean ± SD 20.6 years ± 1.4 |
Supplement form: Capsules Intervention: 1 × daily with food G1: 65 mg of iron as iron enriched Aspergillus oryzae, then 65 mg of iron as ferrous sulfate G2: 65 mg of iron as ferrous sulfate, then 65 mg of iron as Aspergillus oryzae All subjects received placebo pills for 21 days wash‐out period Background nutrient intake: NR Compliance: General compliance was recorded by documenting the remaining capsules from the returned containers. Compliance was 97%, 93% and 95.2% for Aspergillus oryzae, ferrous sulfate and placebo, respectively |
Gastrointestinal side effects (nausea, heartburn, abdominal discomfort, fatigue, diarrhoea, constipation) Method: A gastrointestinal side effects questionnaire was distributed electronically to participants over 2 randomly chosen weekdays and 1 weekend day during each intervention period |
Number of side effects for 2 weekdays and 1 weekend day Mean (SE) Constipation G1: 1.13 (0.43) G2: 1.56 (0.50) G3: 1.06 (0.37) Diarrhoea G1: 0.63 (0.22) G2: 1.00 (0.33) G3: 0.50 (0.24) Nausea G1: 0.38 (0.18) G2: 0.75 (0.30) G3: 0.44 (0.16) Abdominal discomfort G1: 2.50 (0.50) G2: 2.81 (0.56) G3: 2.75 (0.78) Heartburn G1: 0.13 (0.09) G2: 0.13 (0.09) G3: 0 |
|
Brock et al. (1995) USA Duration: 56 day Funding: NR |
RCT, parallel, single‐blind Exclusion: Hb < 10 mg/dL or > 16 mg/dL, condition contraindicating iron oral administration or interfering with evaluation of the substances under test, use of medication interfering with factors under study N = 543 n = 543 |
% Female: 89 Age range: 18–39 years |
Supplement form: Wax‐matrix delivery system and conventional tablets Intervention: 1× daily, before breakfast G1: Wax‐matrix delivery system (ferrous sulfate providing 50 mg of iron) G2: conventional tablets (ferrous sulfate providing 50 mg of iron) Background nutrient intake: NR Compliance: 33 individuals on G1 and 44 on G2 dropped due to intolerable adverse effects; 8 in G1 and 4 in G2 dropped due to Hb > 16 mg/dL |
GI side effects Method: NR |
Abdominal discomfort (count/n): G1: 25/271; G2: 53/272 Nausea (count/n): G1: 11/271; G2: 26/272 Vomiting (count/n): G1: 3/271; G2: 5/272 Total stomach‐related effects (count/n): G1: 33/271; G2: 74/272 Constipation (count/n): G1: 18/271; G2 47/272 Diarrhoea (count/n): G1: 13/271; G2: 47/272 Dark stool (count/n): G1: 5/271; G2: 17/272 Total bowel‐related effects (count/n): G1: 28/271; G2: 77/272 Total GI effects (count/n): G1: 45/271; G2: 124/272 |
|
Coplin et al. ( 1991 ) USA Duration: 4 week (2 week for each treatment) Funding: Mixed, United Stated Public Health & Albion Laboratories |
RCT, crossover, double‐blind Inclusion: premenopausal, non‐pregnant women, with normal iron status (serum iron: 12–27 μmol/L; serum transferrin: 2.5–4.2 g/L; Hb: 115–150 g/L; haematocrit: 36%–47%; mean corpuscular volume: 76–100 fL) Exclusion: abnormal indicators of iron status N = 40 n = 38 |
% female: 100 Age range: 18–40 years |
Supplement form: Capsules Intervention: 1× daily, before breakfast G1: iron‐chelate bis‐glycine iron II, containing 50 mg of iron G2: ferrous sulfate (FeSO4.7H2O) with added soy protein, containing 50 mg of iron Background nutrient intake: NR Compliance: 2 women withdrew for reasons not related with iron preparations |
GI side effects Method: self‐reported (data sheets with daily log on the prevalence and intensity of symptoms recorded by participants) |
Abdominal pain (count/n): G1: 9/38; G2: 7/38 Bloating (count/n): G1: 9/38; G2: 10/38 Constipation (count/n): G1: 13/38; G2: 13/38 Diarrhoea (count/n): G1: 7/38; G2: 9/38 Nausea (count/n): G1: 9/38; G2: 12/38 Vomiting (count/n): G1: 0/38; G2: 0/38 Total GI symptoms (count/n): G1: 23/38; G2: 25/38 |
|
Friling et al. ( 2022 ) Spain Duration: 28 days (14 days for each treatment, with washout ≥ 1 month) Funding: Private |
RCT, 2‐way crossover, double‐blind Inclusion: healthy, volunteer, premenopausal women, aged between 18 and 50 years, with regular menstrual cycles, and normal health established by medical history, vital signs, physical examination, electrocardiogram and laboratory data within normal limits, including complete blood cell count, biochemical profile and urine analysis; BMI 20–25 kg/m2, non‐anaemic, CRP < 5 mg/L, and willingness to maintain stable nutritional and general habits during the study Exclusion: Hb < 12 g/dL, LDL > 130 mg/dL, TG > 200 mg/dL, severe premenstrual symptoms, relevant comorbid diseases (e.g. peptic ulcer, ulcerative colitis or enteritis, inflammatory bowel disease, iron storage disorders, liver and renal dysfunction, etc.), chronic or infectious diseases or any active medical illness in the 48 h prior to the baseline visit, drug or alcohol abuse, gastric bypass or bariatric surgery, use of nutritional supplements within the previous month, intake of iron supplements and/or iron‐containing multivitamins during 3 months prior to study entry, use of chronic medication (except oral contraceptives), previous participation in iron tolerability trials, participation in a clinical research trial within 30 days of randomisation, pregnancy or breastfeeding, planning pregnancy, intolerance to iron supplements, following a specific diet 30 days prior to the start of the study, blood donation in the previous month, cognitive impairment or incapability to give informed consent, and any other laboratory abnormality, medical condition or psychiatric disorder that, could adversely affect the ability of the subject to complete the study or its measurements or that may pose a significant risk to the subject N = 51 n = 47 |
% female: 100 Age (mean ± SD): 30.7 years ± 7.4 years |
Supplement form: Capsules Intervention: 1× daily, before lunch G1: microencapsulated ferric saccharate, containing 60 mg/day of elemental iron. G2: conventional ferrous sulfate, containing 60 mg/day of elemental iron. Washout period of 2 consecutive menstrual episodes and ≥ 1 month, before receiving crossover product Background nutrient intake: NR Compliance: assessed by counting the empty and non‐empty blister packages returned.G1: 97.5% ± 4.5%; G2: 97.9% ± 4.4% |
GI side effects Method: questionnaire and direct participant reporting, recorded after the intervention periods |
Total GI symptoms (count/n): G1: 32/47; G2: 41/47; Washout: 30/47 Nausea (count/n): G1: 4/47; G2: 11/47; Washout: 2/47 Heartburn (count/n): G1: 7/47; G2: 10/47; Washout: 3/47 Abdominal pain (count/n): G1: 10/47; G2: 17/47; Washout: 15/47 Flatulence/swelling (count/n): G1: 20/47; G2: 30/47; Washout: 19/47 Diarrhoea (count/n): G1: 6/47; G2: 14/47; Washout: 5/47 Metallic taste (count/n): G1: 3/47; G2: 6/47; Washout: 1/47 Constipation (count/n): G1: 11/47; G2: 12/47; Washout: 9/47 Vomiting (count/n): G1: 0/47; G2: 1/47; Washout: 0/47 |
|
Frykman et al. ( 1994 ) Sweden Duration: 30 days Funding: NR |
RCT, parallel, double‐blind Inclusion: blood donors Exclusion: elevated Hb N = 100 n = 97 |
% female: 53% Mean age 41–45 years, depending on group |
Supplement form: Tablets Intervention: 1× daily G1: 2.4 mg haem iron from porcine blood +16 mg iron from ferrous fumarate. G2: ferrous fumarate containing 60 mg/day of elemental iron Two other periods followed, in both of which half of the participants randomly received placebo and the other half one of the iron interventions Background nutrient intake: NR Compliance: NR |
GI side effects Method: Symptom diary + multiple choice diary for rating severity |
Nausea: G1: 8% G2: 6% Placebo: 4% Gastric pain: G1: 6% G2: 19% Placebo: 10% Constipation: G1: 14% G2: 35% Placebo: 20% Diarrhoea: G1: 26% G2: 37% Placebo: 19% Total with symptoms: G1: 14% G2: 25% Placebo: 14% |
|
Hallberg et al. ( 1966 ) Sweden Duration: 14 days Funding: NR |
RCT, parallel, double‐blind Inclusion: blood donors Exclusion: NR Series 1: N = 393 n = 344 Series 2: N = 477 n = 447 Series 3: N = 791 n = 705 |
Series 1% females: 17% Series 2% females: 13% Series 3% females: 17% |
Supplement form: Tablets, 3 × daily Series 1: G1: placebo (n = 195) G2: ferrous sulfate, 222 mg elemental iron (n = 198) Series 2: G1: placebo (n = 119) G2: ferrous sulfate, 222 mg elemental iron (n = 120) G3: ferrous fumarate, 222 mg elemental iron (n = 118) G4: ferrous gluconate, 222 mg elemental iron (n = 120) |
GI side effects Method: questionnaire on bowel habits and GI symptoms |
Series 1: Total with symptoms G1: 13.6% + 4.1% discontinued because of symptoms G2: 22.9% + 8.0% discontinued because of symptoms Constipation G1: 8.9% G2: 8.0% Diarrhoea: G1: 0.6% G2: 5.7% Heartburn G1: 3.6% G2: 2.3% Nausea G1: 0.6% G2: 5.7% Epigastric pain G1: 1.8% G2: 2.3% |
|
Series 3: G1: placebo (n = 200) G2: ferrous sulfate, 180 mg elemental iron (n = 195) G3: ferrous fumarate, 180 mg elemental iron (n = 200) G4: ferrous gluconate, 180 mg elemental iron (n = 196) Background nutrient intake: NR Compliance: NR |
Series 2: Total with symptoms G1: 13.9% G2: 27.9% G3: 26.4% G4: 31.5% Constipation G1: 4.3% G2: 9.9% G3: 10.0% G4: 13.5% Diarrhoea: G1: 0.9% G2: 6.3% G3: 6.4% G4: 6.3% Heartburn G1: 2.6% G2: 3.6% G3: 5.5% G4: 4.5% Nausea G1: 0.0% G2: 5.4% G3: 0.0% G4: 3.6% Epigastric pain G1: 0.9% G2: 7.2% G3: 2.7% G4: 4.5% Series 3: Total with symptoms G1: 12.4% G2: 26.5% G3: 24.4% G4: 27% Constipation G1: 6.2% G2: 11.2% G3: 10.0% G4: 12.9% |
||||
|
Diarrhoea: G1: 3.4% G2: 6.5% G3: 4.4% G4: 6.2% Heartburn G1: 1.7% G2: 1.8% G3: 1.7% G4: 2.2% Nausea G1: 1.7% G2: 2.9% G3: 2.8% G4: 3.4% Epigastric pain G1: 0.0% G2: 3.5% G3: 5.0% G4: 3.4% |
|||||
|
Tiekou Lorinczova et al. ( 2022 ) United Kingdom Duration: 6 week Funding: Private |
RCT, parallel, double‐blind Inclusion: healthy, aged 18–40 years, with ferritin levels 15–300 μg/L for men and 15–200 μg/L for women. Exclusion: Hb < 130 g/L for men and < 120 g/L for women, with medical conditions or comorbidities (currently trying to conceive, pregnant, lactating, experiencing any chronic menstrual disorders or reported undergoing any menopausal changes), any issues related to ingesting oral supplementation, taking any supplementation or medication, alcohol consumption exceeding 21 units/week, chronic GI symptoms, eating disorders, psychological conditions or any hypo/hypertensive BP measurements. N = 155 n = 154 |
% female: 49 Age (mean ± SD): 26.12 years ± 0.39 |
Supplement form: Capsules Intervention: 1× daily, 1 h before or 2 h after food consumption, with ferrous sulfate and curcumin taken at separate times. G1: ferrous sulfate placebo + curcumin placebo G2: ferrous sulfate with 18 mg elemental iron + placebo G3: ferrous sulfate with 18 mg elemental iron + 500 mg curcumin G4: ferrous sulfate with 65 mg elemental iron + placebo G5: ferrous sulfate with 65 mg elemental iron + 500 mg curcumin Background nutrient intake: NR Compliance: ≥ 80% at mid‐intervention period, and at the end of trial for all groups |
GI side effects Method: validated questionnaire for GI symptoms |
No differences between supplementation groups for nausea, vomiting, heartburn, abdominal pain, diarrhoea and darker bowel movements at the end of trial |
|
Makrides et al. ( 2003 ) Australia Duration: 20 week of gestation until delivery Funding: Private |
RCT, parallel, double‐blind Inclusion: singleton or twin pregnancies, informed consent Exclusion: pre‐existing anaemia (Hb > 110 g/L), thalassemia, history of drug or alcohol abuse, taking vitamin and mineral preparations containing iron N = 430 n 24 w gestation = 408 G1: 204 G2: 204 n 36 w gestation = 393 G1: 193 G2: 200 |
% Female: 100 Age, mean ± SD G1: 28.0 years ± 5 G2: 28.5 years ± 5 |
Supplement form: Tablet Intervention: 1× daily, between meals G1: placebo G2: 20 mg elemental iron, as ferrous sulfate Background nutrient intake: iron‐specific validated food‐frequency questionnaire at 20 and 36 week of gestation Compliance: Monthly telephone calls (at 24, 28, 32, 36 and 40 week of gestation) were made to encourage compliance and assess the average number of tablets not taken during the previous month. Women were supplied with excess tablets, and the number of tablets returned served as a measure of compliance. The back‐count of tablets collected from 174 women in G2 and 164 women in G1 showed that 86% of women in G2 and 85% of women in G1 took their allocated supplement daily. There was a strong correlation between the noncompliance data based on the tablet back‐count and that based on the number of tablets the women reported not taking during the monthly telephone calls |
Maternal gastrointestinal side effects (such as nausea, heartburn, abdominal discomfort, constipation, diarrhoea) Method: Gastrointestinal side effects were assessed at 24 and 36 week of gestation by use of a structured telephone questionnaire |
The prevalence of nausea, stomach pain, heartburn, vomiting and hard stools and the frequency of bowel actions was not significantly different between women in G2 and those in G1 at both 24 and 36 week of gestation. 24 week of gestation Nausea, count/n G1: 45/204; G2: 51/204 Stomach pain, count/n G1: 39/204; G2: 47/204 Heartburn, count/n G1: 100/204; G2: 100/204 Vomiting, count/n G1: 27/204; G2: 21/204 Black stool, count/n G1: 0/204; G2: 0/204 Hard stool, count/n G1: 32/204; G2: 36/204 36 week of gestation Nausea, count/n G1: 54/193; G2: 58/200 Stomach pain, count/n G1: 57/193; G2: 70/200 Heartburn, count/n G1: 133/193; G2: 136/200 Vomiting, count/n G1: 26/193; G2: 24/200 Black stool, count/n G1: 8/191; G2: 3/200 Hard stool, count/n G1: 34/191; G2: 25/200 Women who took high‐dose iron supplements reported a higher prevalence of black stools (10/93, or 10.8%, compared with 1/298, or 0.3%; p < 0.001) and hard stools (21/93, or 22.6%, compared with 38/298, or 12.7%; p < 0.05) than did the women who received only low‐dose iron or placebo treatment |
|
McKenna et al. ( 2003 ) United Kingdom Duration: 4 weeks Funding: NR |
RCT, parallel, double‐blind Inclusion: women with a singleton pregnancy incompliant with prescribed iron medication; booking haemoglobin > 10.4 g/dL and known gestational age confirmed by ultrasound at < 20 weeks gestation Exclusion: multiple pregnancy; booking haemoglobin < 10.4 g/dL; uncertain gestational age; known medical problem; maternal ingestion of other medication; patients compliant with prescribed iron supplements and known foetal anomaly N = 102 n = 72 |
Pregnant women |
Supplement form: Sachets to be diluted in orange juice Intervention: 1× daily, before breakfast G1: placebo G2: 10 mg elemental iron, as iron rich water preparation Background nutrient intake: NR Compliance: 67% in the control and 57% in the intervention group |
Gastrointestinal symptoms Method: modified Glasgow Dyspepsia Severity Score (mGDSS) |
Baseline at 22 weeks of gestation: mGDSS (mean, SD) G1: 1.86, 2.06 G2: 3.54, 3.48 26 weeks of gestation: G1: 1.54, 1.95 G2: 3.51, 3.38 |
|
Milman et al. ( 2006 ) Denmark Duration: 154 days Funding: Private |
RCT, parallel, double‐blind Inclusion: healthy pregnant women belonging to the middle or upper socioeconomic classes Exclusion: women taking acetyl salicylic acid N = 427 n = 291 |
Pregnant women |
Supplement form: Tablet Intervention: 1× daily in the evening G1: 20 mg elemental iron as ferrous fumarate G2: 40 mg elemental iron as ferrous fumarate G3: 60 mg elemental iron as ferrous fumarate G4: 80 mg elemental iron as ferrous fumarate Background nutrient intake: NR Compliance: only women with > 90% compliance were included in the analysis |
Gastrointestinal symptoms Method: interview |
n = total n per group Baseline Nausea G1: 18% (n = 99) G2: 17% (n = 100) G3: 15% (n = 102) G4: 22% (n = 103) Vomiting G1: 7% (n = 99) G2: 9% (n = 100) G3: 9% (n = 102) G4: 9% (n = 103) Epigastric pain G1: 8% (n = 99) G2: 12% (n = 100) G3: 11% (n = 102) G4: 14% (n = 103) Constipation G1: 32% (n = 99) G2: 24% (n = 100) G3: 29% (n = 102) G4: 27% (n = 103) Black stools G1: 5% (n = 99) G2: 7% (n = 100) G3: 9% (n = 102) G4: 9% (n = 103) |
|
32 gestational weeks Nausea G1: 4% (n = 71) G2: 6% (n = 68) G3: 1% (n = 79) G4: 4% (n = 75) Vomiting G1: 3% (n = 71) G2: 2% (n = 68) G3: 0% (n = 79) G4: 1% (n = 75) Epigastric pain G1: 13% (n = 71) G2: 9% (n = 68) G3: 12% (n = 79) G4: 10% (n = 75) Constipation G1: 24% (n = 71) G2: 17% (n = 68) G3: 20% (n = 79) G4: 37% (n = 75) Black stools G1: 10% (n = 71) G2: 20% (n = 68) G3: 58% (n = 79) G4: 72% (n = 75) 39 gestational weeks Nausea G1: 7% (n = 63) G2: 11% (n = 57) G3: 7% (n = 70) G4: 14% (n = 66) Vomiting G1: 3% (n = 63) G2: 7% (n = 57) G3: 1% (n = 70) G4: 3% (n = 66) Epigastric pain G1: 10% (n = 63) G2: 11% (n = 57) G3: 12% (n = 70) G4: 8% (n = 66) Constipation G1: 17% (n = 63) G2: 25% (n = 57) G3: 20% (n = 70) G4: 27% (n = 66) Black stools G1: 5% (n = 63) G2: 23% (n = 57) G3: 58% (n = 70) G4: 64% (n = 66) |
|||||
|
Milman et al. ( 2014 ) Denmark Duration: appr. 160 days Funding: Private |
RCT, parallel, double‐blind Inclusion: healthy Danish, Caucasian women > 18 years of age, with a normal single pregnancy Exclusion: treatment with acetyl salicylic acid; smoking > 5 cigarettes/day; clinically significant vaginal haemorrhage > 200 mL prior to the initial visit; haemoglobin at the initial visit < 103 g/L (6.4 mmol/L). G1: N = 40, n = 30 G2: N = 40, n = 33 |
Pregnant women |
Supplement form: Tablet Intervention: 1× daily in the evening or between meals G1: 25 mg elemental iron as ferrous bisglycinate G2: 50 mg elemental iron as ferrous sulfate Compliance: assessed at the last prepartum visit based on pill counts |
Gastrointestinal symptoms Method: questionnaire |
In both iron groups, from inclusion to delivery, there was a decrease in the frequency of nausea (p = 0.02) and colic pain (p = 0.04) and an increase in the frequency of pyrosis/cardialgia (p = 0.003) Women taking bisglycinate displayed a lower frequency of black stools than women taking sulfate (p = 0.003). The total number of reported complaints at inclusion was not significantly different in the two iron groups. When the complaints at 27–28 weeks, 36–37 weeks and just before delivery were pooled, there was a significantly lower frequency in the bisglycinate group (188 positive of 1203 responders) than in the sulfate group (272 positive of 1316 responders) (p = 0.001) |
|
Pereira et al. ( 2014 ) United Kingdom Duration: 7 days Funding: Public |
RCT, parallel, double‐blind Inclusion: Healthy, aged 18–65 years, written informed consent Exclusion: Presence of any chronic disease, pregnancy or lactation N = 20 n = 20 |
% Female: 65 Average age: 32 years |
Supplement form: Capsules Intervention: 2× daily, at mealtimes G1: Placebo G2: total: 130 mg iron as ferrous sulfate Background nutrient intake: NR Compliance: Assessed by questionnaire. Compliance with oral iron/placebo > 80% for the morning dose and > 90% for the evening dose for participants in both groups and did not differ between groups. Reasons provided for non‐compliance were unrelated to the study treatments |
Gastrointestinal symptoms Method: Self‐completed questionnaire on a daily basis for the 7d treatment and the following 7d wash‐out period |
Nausea, frequency of symptoms; day/week, mean ± SD: G1 (Treatment period): 0.2 ± 0.1 G1 (Washout period): 0.4 ± 0.4 G2 (Treatment period): 1.1 ± 0.6 G2 (Washout period): 0.1 ± 0.1 Heartburn, frequency of symptoms; day/week, mean ± SD: G1 (Treatment period): 0 G1 (Washout period): 0 G2 (Treatment period): 1.0 ± 0.4 G2 (Washout period): 0.3 ± 0.3 Abdominal pain, frequency of symptoms; day/week, mean ± SD: G1 (Treatment period): 0.2 ± 0.1 G1 (Washout period): 0 G2 (Treatment period): 2.0 ± 0.6 G2 (Washout period): 1.0 ± 0.7 Diarrhoea, frequency of symptoms; day/week, mean ± SD: G1 (Treatment period): 0.3 ± 0.3 G1 (Washout period): 0.4 ± 0.2 G2 (Treatment period): 0.4 ± 0.3 G2 (Washout period): 0.3 ± 0.2 Constipation, frequency of symptoms; day/week, mean ± SD: G1 (Treatment period): 0.2 ± 0.2 G1 (Washout period): 0 G2 (Treatment period): 1.0 ± 0.6 G2 (Washout period): 0.7 ± 0.5 |
|
Change bowel movements, frequency of symptoms; day/week, mean ± SD: G1 (Treatment period): 0.4 ± 0.3 G1 (Washout period): 0.4 ± 0.2 G2 (Treatment period): 1.3 ± 0.5 G2 (Washout period): 1.5 ± 0.3 Black stools, frequency of symptoms; day/week, mean ± SD: G1 (Treatment period): 0 G1 (Washout period): 0 G2 (Treatment period): 4.1 ± 0.7 G2 (Washout period): 1.3 ± 0.4 |
Abbreviations: appr., approximatively; BMI, body mass index; BP, blood pressure; CRP, C‐reactive protein; G, group; GI, gastrointestinal; Hb, haemoglobin; LDL, low density lipoprotein; mGDSS, modified Glasgow Dyspepsia Severity Score; N, total number; n, number; NR, not reported; RCT, randomised controlled trial; SD, standard deviation; SE, standard error; TG, triglycerides; USA, United States of America.
B.5. Intervention studies on adverse effects of iron supplementation in infants and young children
| First author, year study country, duration, funding | Design | Subject characteristics at baseline | Intervention | Ascertainment of outcome | Results |
|---|---|---|---|---|---|
|
Dewey et al. ( 2002 ) Sweden and Honduras Intervention duration: 5 months Funding: mixed, by the US department of agriculture, the thrasher research fund, stiftelsen oskardonden, Swedish Nutrition Foundation, Stiftelsen Samariten and the Swedish Medical Research council, HemoCue AB |
Study design: Double‐blinded, RCT, Parallel groups. Selection criteria Gestational age ≥ 37 week; birth weight ≥ 2500 g; no chronic illness; maternal age ≥ 16 years; infant exclusively breast‐fed at 4 months + did not receive > 90 mL/day of formula during any period since birth; mother intended to exclusively or nearly exclusively breast‐feed until 6 months and to continue breast‐feeding until 9 months N = 121 n = 96 Groupwise n: G1 (iron supplement from 4 to 9 months): 30 G2 (placebo): 36 |
Female (%): NR Age (months): 4 months Hb, Serum ferritin, TfR: NR WAZ (z‐score, mean ± SD): G1: 0.62 ± 0.78 G2: 0.49 ± 0.84 HAZ (z‐score, mean ± SD): G1: 0.67 ± 0.76 G2: 0.46 ± 0.65 |
Supplement form: Liquid formulation (Fer‐In‐Sol, Mead Johnson, Evansville, IN) of ferrous sulfate in a sugar solution containing 25 g/L of elemental iron. Intervention: 1× day Iron compound: ferrous sulfate Control: placebo Dose (mg/kg/day): 1 mg of elemental iron/kg/day Background nutrient intake: NR Compliance: Daily checklist indicating whether the drops were given, and by collecting the used bottles each month and measuring the amount of fluid remaining. Covariates: morbidity |
Weight and length measurement methods: Birth weight was recorded from medical charts. Each month from 4 to 9 months, weight was measured on an electronic scale (to the nearest 10 g), length was measured on a recumbent length board (to the nearest 0.1 cm) Weight and length measurements were used to derive infant's WAZ and HAZ Morbidity data: daily calendar for mothers to record the infant's stool frequency and consistency and any symptoms of illness, or diagnoses made by a health care provider. |
Infant growth: Weight gain (g, mean ± SE): G1: 1925 ± 101 G2:2134 ± 92 WAZ (z‐score, mean ± SD): G1: −0.06 ± 0.92 G2: 0.06 ± 1.08 There was no effect of iron supplementation on weight gain during the interval 4–9 months Length gain (cm, mean ± SE): G1: 7.31 ± 0.23 G2: 7.79 ± 0.21 HAZ (z‐score, mean ± SD): G1: 0.17 ± 0.80 G2: 0.21 ± 0.84 Length gain from 4 to 9 months was less in the iron‐supplemented groups than in the placebo group p = 0.03. Morbidity: Morbidity (Diarrhoea %yes): G1: 30 G2: 14 Morbidity (fever, %yes): G1: 81 G2:67 No significant effect on other morbidity outcomes, although it should be noted that detecting effects on morbidity generally requires larger sample sizes than achieved in this study |
|
Gahagan et al. ( 2009 ) Refer to Lozoff et al. (2003 ) Chile Duration: 6 months Funding: public, NIH: grant K23HD001481 (S. Gahagan, PI) and R01 HD33487 (B. Lozoff, PI) |
Study design: RCT, parallel, double‐blinded Selection criteria Chilean infants weighing > 3 kg, aged 6–12 m, iron sufficient (capillary Hb ≥ 128 g/L/ venous Hb ≥ 110 g/L, + at least 2 of 3 iron measures in the sufficient range: mean corpuscular volume ≥ 70 fL, erythrocyte protoporphyrin < 1.77 μmol/L RBC, serum ferritin ≥ 12 mg/L N = 142 n = 118 Groupwise n 6–12 month: G1 (fortified formula/vitamin with iron): 56 G2 (usual nutrition): 62 |
% females: G1: 53.4 G2: 56.5 Age (months) G1: 6 months G2: 6 months WAZ (z‐score, mean ± SD): G1: 0.43 ± 0.84 G2: 0.42 ± 0.73 HAZ (z‐score; mean ± SD): G1: 0.10 ± 0.68 G2: 0.02 ± 0.86 Hb, TfR, serum ferritin: NR |
Supplement form: iron fortified formula (for those receiving at least 250 mL of supplemental milk) or vitamin with iron (for those taking < 250 mL of supplemental milk to breast‐feeding) Intervention: daily Iron compound: not described by type (only as part of vitamin powder/supplement) Control: usual nutrition, Dose (mg/day): G1: iron fortified formula: 12 mg/L; vitamins with iron: 10 mg/day Covariates: Sex and socioeconomic status (SES) were included as covariates in all analyses, also birth weight and length were included as covariates in the models of growth from 1 to 10 years, as birth size is related to both growth and iron stores at birth Background nutrient intake: NR Compliance: project personnel made weekly home visits to review the infants' consumption of study provided formula or milk, vitamins or iron drops with the mothers |
Weight and length measurement methods: Electronic scale (to the nearest 0.01 kg); recumbent length board (to the nearest 0.1 cm). |
Infant growth: 12 m: WAZ (z‐score, mean ± SD): G1: 0.04 ± 1.00 G2: −0.05 ± 0.91 HAZ (z‐score, mean ± SD): G1: 0.08 ± 0.80 G2: 0.14 ± 0.70 During the study, both WAZ and HAZ did not differ significantly between intervention and control groups |
|
Idjradinata et al. ( 1994 ) Idjradinata & Pollitt ( 1993 ) Indonesia Intervention duration: 4 months Funding: the International Nutrition Foundation for Developing Countries, the US Department of Agriculture Experiment Station, and the United Nations University |
Study design: randomised trial, blinding NR. Parallel groups Selection criteria: birthweight > 2500 g; Singleton pregnancy; no major congenital anomalies or perinatal complications, no jaundice treated with phototherapy; no hospital admission or supplementation with micronutrients during the 6 months before enrolment; no chronic illness or folic acid deficiency; haemoglobin at least 80 g/L; no signs of abnormal haemoglobin or thalassaemia; and weight, length and head circumference within 2 SD of National Center for Health Statistics Reference standards. N = 47 n = 44 Groupwise n: G1 (ferrous sulfate): 24 G2 (placebo syrup): 33 |
Female (%): G1: 66.6% G2: 47.8% Age (months, mean ± SE): G1: 14.27 ± 0.50 G2: 14.73 ± 0.38 Hb, Serum ferritin, TfR: NR Weight (kg, mean ± SE): G1: 9.18 ± 0.21 G2:9.36 ± 0.16 Length (cm, mean ± SE): G1: 75.3 ± 0.7 G2:76.8 ± 0.7 WAZ (z‐score; mean ± SE): G1: −0.96 ± 0.18 G2: −1.02 ± 0.13 HAZ (z‐score; mean ± SE): G1: −0.72 ± 0.16 G2: −0.50 ± 0.20 |
Supplement form: Liquid formulation (cherry flavoured syrup) of ferrous sulfate Intervention: daily Iron compound: ferrous sulfate Control: placebo Dose (mg/kg/day): 3mg/kg/die of ferrous sulfate. Background nutrient intake: not reported, only mentioned in inclusion criteria no iron supplementation before the intervention. Covariates: sex, morbidity Compliance: checked once a week by a nurse |
Weight and length measurement methods: Weight was measured (within 100 g) on a Salter scale; length (within 1 cm) with fibreglass measuring devices. Side effects assessment: morbidity data were derived from paediatrician diagnoses. Cognitive function: Bayley Scales of Infant Development (BSID) |
Infant growth 16 week‐baseline: Weight (kg, mean ± SE): G1: 0.58 ± 0.06 G2: 0.77 ± 0.11 Length (cm, mean ± SE): G1: 4.0 ± 0.3 G2: 3.9 ± 0.3 WAZ (z‐score, mean ± SE): G1: −0.14 ± 0.05 G2: 0.05 ± 0.09 HAZ (z‐score, mean ± SE): G1: −0.03 ± 0.11 G2: −0.02 ± 0.11 Significant interaction (p = 0 03) between treatment group and time for weight gain, but not for linear growth. Morbidity: There was no significant difference in morbidity between the groups (p = 0.07). mean (SD) mean (SE): Mental Developmental Index (MDI) G1 baseline: 105.4 (2.2) G1 end: 109.1 (2.2) G2 baseline: 104.7 (2.2) G2 end: 106.8 (2.3) Psychomotor Developmental Index (PDI) G1 baseline: 105.3 (2.1) G1 end: 108.7 (2.1) G2 baseline: 105.9 (2.2) G2 end: 108.3 (2.1) |
|
Majumdar et al. ( 2003 ) India Intervention duration: 4 months Funding: NR |
Study design: randomised trial, double blinded, parallel groups. Inclusion criteria: Birthweight > 2500 g, singleton pregnancy, weight, length and head circumference within 2 SD of the National Center for Health Statistics (NCHS) reference standards, adequate diet in proteins and calories, no signs of any vitamin/micronutrient deficiency Exclusion criteria: major congenital anomaly or prenatal complications, hospital admission or iron supplementation during the months before enrolment, chronic illness, anaemia other than iron deficiency or had received a recent blood transfusion. N = 189 n = 150 Groupwise n: G1 (iron supplementation): 50 G2 (placebo): 50 |
Female (%): 30% (only info available was the number of female participants on the total n , and not divided into treatment/placebo groups) Age (months): 6–24 months Age distribution of children (months): G1: 6–9 months: 9 9–12 months: 14 12–18 months: 7 18–24 months: 20 G2: 6–9 months: 6 9–12 months: 20 12–18 months: 6 18–24 months: 18 Data have been reported for both intervention and control groups as whole, they were not divided into age groups. Hb (g/dL, mean): G1: 14 G2: 8 Serum ferritin (ng/dL, mean): G1: 56 G2: 60 TfR: NR Baseline anthropometric parameters: NR |
Supplement form: Liquid formulation (syrup) Intervention: daily Iron compound: NR Control: placebo Dose (mg/kg/day): 2 mg/kg/day of iron supplement Background nutrient intake: not reported Covariates: NR Compliance: monitored fortnightly |
Weight and length measurement methods: NR Side effects assessment: NR, just mentioned that children developing chronic diarrhoea, fever lasting > 7 days or those requiring any hospital admission during the course of the study were dropped from follow‐up |
Infant growth: Weight gain (kg/month, mean ± 2 SD): G1: 0.14 ± 0.025 G2: 0.25 ± 0.027 Iron supplementation in iron replete children significantly slowed the average weight gain of children in the various age groups (p < 0.001). Linear growth (cm/month, mean ± 2 SD): G1: 0.69 ± 0.112 G2: 0.97 ± 0.112 The difference in rate of mean linear growth of group IA and group IB were both statistically significant at p < 0.001 |
|
Yalcin et al. ( 2000 ) Turkey Duration: 3 months Funding: NR |
RCT, parallel, open label Inclusion criteria: (i) infants had to have a gestational age between 38 and 42 weeks; (ii) the birthweight had to be > 2500 g; (iii) it had to have been a singleton pregnancy; (iv) no pathologic jaundice during the newborn period; (v) no major congenital anomaly; (vi) no illness in the preceding 1 month before enrolment into the study; (vii) head circumference, height and weight within ~2SD of mean values for chronological age according to National Center for Health Statistics growth charts; (viii) no central nervous system disorders; and (ix) no history of iron supplementation or therapy Exclusion criteria: Hb values lower than 11 g/dL and serum ferritin concentrations below 10 μg/L or TS lower than 10 N = 24 n = 16 Groupwise n: G1 (iron supplementation): 7 G2 (placebo): 9 |
%females: 56 Age (mean months (SD)) G1: 6.1 (0.4) G2: 6.1 (0.3) Birthweight (mean kg (SD)) G1: 3.1 (0.3) G2: 3.3 (0.3) |
Supplement form: Ferrous sulfate suspension (Ferrosanol®; Schwarz Pharma AG, Monheim, Germany) Intervention: once daily Iron compound: ferrous sulfate Control: no supplementation Dose (mg/kg/day): 1 mg/kg/day of iron supplement Background nutrient intake: NR Covariates: NR Compliance: measured by weekly house calls |
Bayley Scales of Infant Development (BSID) |
mean (SD) Mental Developmental Index (MDI) G1 baseline: 80.9 (5.2) G1 end: 97.1 (2.9) G2 baseline: 78.3 (5.6) G2 end: 96.7 (1.9) Psychomotor Developmental Index (PDI) G1 baseline: 29.3 (2.6) G1 end: 42.6 (1.9) G2 baseline: 27.2 (2.2) G2 end: 42.6 (2.7) |
|
Ziegler et al. ( 2009 ) USA Duration: 5 months Funding: Mixed, by National Institutes of Health, the Gerber Products Company and Mead Johnson Nutrition |
RCT, parallel, open label Inclusion criteria: predominant breastfeeding at 4 months, at 5.5 months breast milk at least once/day Exclusion criteria: intake > 200 mL formula/day N = 152 n = 136 for intervention Groupwise n: enrolled and analysed after 9 months: G1 (iron supplements): n = 48 G2 (iron in cereal): n = 45 G3 (placebo): n = 59 |
female % within each group: G1: 25 G2: 22 G3: 27 Age (months): 4 months Hb (g/L, mean ± SD): G1: 114 ± 8 G2: 115 ± 8 G3: 115 ± 7 Serum ferritin (μg/L, mean ± SD): G1: 98 ± 67 G2: 134 ± 136 G3: 89 ± 60 TfR (mg/L, mean ± SD): G1: 6.37 ± 1.03 G2:6.35 ± 1.18 G3:6.27 ± 1.06 Weight (g, mean ± SD) Boys G1: 6993 ± 692 G2: 6736 ± 752 G3: 6838 ± 726 Girls G1: 6299 ± 455 G2: 6200 ± 664 G3: 6291 ± 558 Length (cm, mean ± SD) Boys G1: 63.5 ± 1.57 G2: 63.2 ± 1.60 G3: 62.2 ± 4.11 Girls G1: 61.5 ± 1.56 G2: 61.1 ± 2.04 G3: 61.3 ± 1.46 |
Supplement form: drops or cereal Intervention: 1× daily Iron compound: ferrous sulfate Control: normal diet Doses: G1 (supplements): 7.5 mg of ferrous sulfate + sugar, sorbitol and citric acid G2 (cereal): 7 mg of ferrous sulfate +15.7 mg ascorbic acid Covariates: plasma ferritin at baseline Background nutrient intake: NR Compliance: recorded, G1: Bottles of supplement were weighed before dispensing and weighed back when returned at monthly visits. G2: The number of jars used was determined from the number dispensed and the number returned |
Weight and length measurement Method: NR Side effects: self‐reported from parents by questionnaire, stool records |
Weight (g, mean ± SD): Boys G1: 9114 ± 970 G2: 8883 ± 755 G3: 9179 ± 877 Girls G1: 8197 ± 732 G2: 8496 ± 871 G3: 8555 ± 772 Length (cm, mean ± SD) Boys G1: 72.0 ± 1.92 G2: 71.7 ± 1.50 G3: 71.5 ± 1.84 Girls G1: 69.2 ± 1.79 G2: 69.7 ± 2.32 G3: 70.1 ± 1.96 The treatment effect was not significant (p = 0.083) for weight gain but was significant (p = 0.039) for length gain. Side effects: G1: in 10% of infants the iron supplement was poorly tolerated. G2: 9% of infants did not tolerate cereals |
Abbreviations: BSID, Bayley Scales of Infant Development; G, group; HAZ, height‐for‐age z‐scores; Hb, haemoglobin; MDI, Mental Developmental Index; N, total number; n, number; NR, not reported; PDI, Psychomotor Developmental Index; RBC, red blood cells; RCT, randomised controlled trial; SD, standard deviation; SE, standard error; TfR: transferrin receptor; TS, transferrin saturation; WAZ, weight‐for‐age z‐scores.
B.6. Intervention studies on adverse effects of iron supplementation during pregnancy other than gestational diabetes mellitus
| First author publication year country, duration, funding | Design | Subject characteristics at baseline | Intervention | Ascertainment of outcome | Results |
|---|---|---|---|---|---|
|
Alizadeh & Salehi ( 2016 ) Iran Duration: 20 week of pregnancy until birth Funding: Private, Islamic Azad University |
RCT, parallel, double‐blind Inclusion criteria: no medical disease, age 18–35 years, BMI of 19.8–26 kg/m2, Hb > 13.2 g/dL and ferritin > 15 μg/L, singleton pregnancy, 16–20 weeks gestational age Exclusion criteria: smoking, having a disease related to polycythaemia (such as asthma or chronic hypertension), renal disease, malignancy or a known blood disorder N = 86 n = 64 Participants per group (enrolled/analysed): G1 (control): 44/32 G2 (ferrous sulfate): 42/32 All data were calculated using the number of subjects that completed the study |
Age (years, mean ± SD): G1: 25.63 ± 5.04 G2: 26.59 ± 5.26 Average gestational age at recruitment: 16–20th weeks BMI: (kg/m 2 , mean ± SD) G1: 23.68 ± 2.47 G2: 24.12 ± 2.17 All the subjects selected were non‐smokers Hb (g/dL, mean ± SD): G1: 13.57 ± 0.4 G2: 13.69 ± 0.44 Serum ferritin (μg/L, mean ± SD): G1: 37.05 ± 16.86 G2: 33.93 ± 13.72 |
Supplement form: tablet containing ferrous sulfate Intervention: 1× daily Control group: placebo Dose: G2: ferrous sulfate tablet containing 50 mg of elemental iron Covariates: NR Background nutrient intake: NR Compliance: NR |
Birth weight assessment Method: infants' weight was measured using Sea scale (accuracy: 10 g) |
Birth weight (g, mean ± SD): G1: 3314 ± 341 G2: 3391 ± 422 There was no significant difference between the 2 groups regarding birth weight (p = 0.2) |
|
Chan et al. ( 2009 ) Hong Kong Duration: April 2005–March 2007. Intervention duration: 16 weeks Funding: Unclear, from Research Grant Council, Hong Kong |
RCT, parallel, single‐blinded study: the participants but not the research assistants were blinded to the group assignment Inclusion criteria: women with singleton pregnancy who could understand either Chinese or English Exclusion criteria: MCV < 80 (possible thalassemia); existing diabetes or haemoglobinopathies, Hb < 8 g/dL or > 14 g/dL, gestational age > 16 weeks at booking N = 1164 n = 925 Participants per group (enrolled/analysed) G1 (placebo): 599 468 had maternal delivery data, 443 had neonatal outcome data 413 had birthweight data G2 (iron supplementation): 565 457 had maternal delivery data, 419 had neonatal outcome data 392 had birthweight data |
Age (years; mean ± SD) G1: 31.3, ± 0.18 G2: 31.3 ± 0.19 Average gestational age at recruitment (week, mean ± SD): G1: 11.2 ± 0.08 G2: 11.4 ± 0.08 BMI (kg/m 2 , mean ± SD): G1: 11.2 ± 0.08 G2: 11.4 ± 0.08 Smoking population: NR Daily iron dietary intake (mg, mean ± SD): G1: 16.1 ± 0.33 G2: 16.3 ± 0.34 Hb (g/dL, mean ± SD): G1: 12.6 ± 0.03 G2: 12.5 ± 0.03 Ferritin (pmol/L; mean ± SD): G1: 196.9 ± 5.84 G2: 182.0 ± 6.01 |
Supplement form: tablets of ferrous sulfate Intervention: daily Control group: placebo containing a combination of starch and lactose Co‐intervention: none Covariates: none Doses: G1: placebo G2: 300 mg ferrous sulfate tablet (60 mg of elemental iron) Background iron intake: NR Iron intake from diet at baseline: reported via dietary survey Compliance: checked between 28–30 weeks of gestation and at 36 weeks of gestation by counting the number of tablets remaining |
Neonatal outcomes: Birthweight assessment method: babies were weighed to the nearest 1 g with a digital electronic scale. Apgar score: Apgar test. Cord blood for FBC and newborn's iron status. Cord arterial pH checked to detect hypoxia. Preterm delivery was defined as delivery before 37 weeks of gestation, and SGA defined as birthweight < 10th percentile for gestational age. |
Birthweight of term infants (g; mean ± SD): G1 (n = 413): 3151.9 ± 20.43 G2 (n = 392): 3247.3 ± 20.98 p = 0.001 birthweight was significantly higher in the supplement group than in the placebo group. There were significantly fewer SGA infants in the supplement group (p = 0.013). No significant differences in other outcomes including Apgar score at 1 and 5 min (p = 0.62, 0.35, respectively), arterial cord blood pH (p = 0.56) and Hb and ferritin of cord blood (p = 0.62, 0.47, respectively) |
|
Falahi et al. ( 2011 ) Iran Duration: ~ 20 weeks Funding: NR |
RCT, parallel, triple‐blind Inclusion criteria: nonanemic pregnant women with gestational age < 20 weeks, primigravidae, age 20 and 35 years, BMI > 25 and < 30, haemoglobin > 110 g/L and serum ferritin > 20 μg/L. Exclusion criteria: diabetes mellitus, coronary heart disease, thalassemia, renal disease, respiratory disease, use of supplementary multivitamins or minerals, drug use, being on a special diet. N = 148 n = 148 Participants per group: G1 (placebo): 78 G2 (ferrous sulfate): 70 |
Age (year, mean ± SD) G1: 23.1 ± 3.7 G2: 24.6 ± 4.7 Average gestational age at recruitment (week, mean ± SD): G1: 11.9 ± 4.0 G2: 12.2 ± 3.5 BMI (kg/m 2 , mean ± SD): G1: 24.4 ± 3.4 G2: 24.8 ± 3.1 Smoking population: NR Haemoglobin (g/L, mean ± SD) G1: 130.5 ± 8.9 G2: 129.8 ± 10 Ferritin (μg/L, mean ± SD): G1: 31.7 ± 19.7 G2: 36.6 ± 21 Iron deficiency (%): G1: 0 G2: 0 Iron deficiency anaemia (%): G1: 0 G2: 0 |
Supplement form: tablets with ferrous sulfate Intervention: daily Control group: placebo tablets Dose: G2 (intervention): 60 mg of iron as ferrous sulfate Covariates: NR Background iron intake: NR Compliance: NR |
Birth outcome assessment: Birthweight and birth length were measured to the nearest 0.1 kg and 0.1 cm, respectively, instruments NR. The duration of gestation period was calculated as the number of weeks from the reported last menstrual period to the delivery date |
Birthweight (kg, mean ± SD): G1: 3.27 ± 0.47 G2: 3.31 ± 0.49 Birth length (cm, mean ± SD): G1: 49.3 ± 4.3 G2: 49.1 ± 3.9 Gestational age at delivery (week, mean ± SD) G1: 38.8 ± 2.2 G2: 38.9 ± 1.7 No significant differences between the two treatment groups in birthweight, birth length or gestational period. P values not reported |
|
Ouladsahebmadarek et al. ( 2011 ) Iran Duration: 13 week of pregnancy until delivery Funding: Vice‐Chancellor for Research, Tabriz University of Medical Sciences |
RCT, parallel, double‐blind Inclusion criteria: first trimester of singleton pregnancy, Hb > 12 gm/dL and had not taken iron‐containing supplements in the last month, BP < 140/90 mmHg, planned to go for all their prenatal care to the prenatal clinic at Alzahra Hospital Exclusion criteria: Hb < 10.5 gm/dL and < 11 gm/dL at the end of 2nd and 3rd trimesters, respectively, miscarriage of current pregnancy, abnormality of the fetus and loss to follow‐up N = 960 n = 782 Participants per group (enrolled/analysed): G1 (placebo): 480/372 G2 (iron supplementation): 480/410 All data were calculated using the number of subjects that completed the study |
Age (year, mean ± SD) G1: 25.48 ± 4.96 G2: 26.28 ± 5.25 Average gestational age at recruitment (week): 13 BMI (kg/m 2 , mean ± SD): NR Weight at entry to study (kg, mean ± SD): G1: 64.46 ± 11.67 G2: 66.55 ± 10.89 Smoking population: NR Haemoglobin (g/dL, mean ± SD): G1: 13.26 ± (0.78 G2: 13.83 ± 0.78 Serum ferritin (μg/L, mean ± SEM): G1: 35.008 ± 1.86 G2: 41.05 ± 2.16 Serum iron (μg/dL, mean ± SD): G1: 86.76 ± 41.06 G2: 89.73 ± 33.50 Hct (%, mean ± SD): G1: 41.22 ± 3.33 G2: 41.48 ± 3.60 |
Supplement form: tablets, iron compound NR Intervention: 1× daily Control: multivitamin Co‐intervention: multivitamin Dose: G2: multivitamin +30 mg elemental iron Covariates: NR Background nutrient intake: NR, we just know that one of the exclusion criteria was the consumption of iron supplements prior to the enrolment. Compliance: NR |
Birth outcome assessment: Birth weight, women's weight at entry, weight at delivery Method: NR Apgar scores (1st and 5th min) Method: Apgar test |
IUGR, preeclampsia, gestational diabetes, oligihydramnious and placental abruption have not increased with iron supplementation, but pregnancy induced hypertension in supplemented mothers was higher (6.7% vs. 3.4%, p = 0.04). Birth weight (g, mean ± SD): G1: 3217 ± 431 G2: 3260 ± 396 p value: 0.28 Difference between not significant. No significant differences between the two groups regarding gestational age at birth (p = 0.74), Apgar scores at 1st and 5th minute (p = 0.5 and 0.11, respectively) |
|
Parisi et al. ( 2017 ) Italy Duration: from 11 to 13 weeks of gestation up to 6 week post‐partum Funding: NR; Pharmanutra S.r.l. donated the pharmacological formulations |
RCT, parallel, not blinded Inclusion criteria: Healthy, non‐anaemic, singleton pregnant women, aged 18–45 years from Milano, Italy Exclusion criteria: Any known maternal pathology, use of drugs, any micronutrient supplementation in the first trimester of pregnancy with the exception of folic acid supplements, extreme BMI (< 18 or > 30 kg/m2), Hb value 510.5 g/dL and/or ferritin < 15 mg/L at baseline, known fetal pathologies, complicated pregnancy, specific dietary pattern or any dietary restriction N = 80 n = 57 Participants per group: G1 (control):20 G2 (ferric pyrophosphate):20 G3 (ferric pyrophosphate):20 G4 (ferrous sulfate): 20 |
Age (mean ± SD, years): 30.7 ± 4.9 Average gestational age at recruitment (weeks): 11–13 Pregestational BMI (kg/m 2 , mean ± SD): 22.7 ± 2.8 Current smokers (%): 15 Hb (g/dL, mean ± SD): G1: 12.0 ± 0.6 G2: 12.0 ± 0.5 G3: 11.9 ± 0.6 G4: 11.9 ± 0.7 Serum ferritin (μg/L, mean ± SD): G1: 46.6 ± 47.4 G2: 52.4 ± 43.9 G3: 52.6 ± 52.1 G4: 43.7 ± 37.3 Transferrin saturation (%, mean ± SD): G1: 27.6 ± 10.1 G2: 28.1 ± 12.3 G3: 26.5 ± 11.0 G4: 26.9 ± 9.8 |
Supplement form: Tablets containing for G2 and G3 ferric pyrophosphate (liposomal Fe), for G4 ferrous sulfate. Intervention: Daily 1× on an empty stomach Control group: untreated Doses: G2: 14 mg ferric pyrophosphate G3: 28 mg ferric pyrophosphate G4: 30 mg ferrous sulfate Covariates: NR Compliance: assessment methods NR |
Data on birth outcomes: Birth weight: regression model. Apgar score: Apgar test Gestational weeks, placental weight, umbilical pH, estimated blood losses, pregnancy complications: collected at birth, assessment method NR |
Birth weight (g, mean ± SD) G1: 3092.9 ± 469.5 G2: 3280.0 ± 312.1 G3: 3499.3 ± 464.1 G4: 3253 ± 323.8 No significant overall effect of treatment on birth weight (p = 0.07). The LI28 group showed a higher mean birth weight, compared with controls (p = 0.0089) Placental weight (g, mean ± SD): G1: 513.1 ± 105.0 G2: 514.1 ± 73.5 G3: 488.8 ± 48.3 G4: 482.6 ± 46.8 Umbilical pH (pH, mean ± SD): G1: 7.27 ± 0.10 G2: 7.29 ± 0.08 G3: 7.28 ± 0.09 G4: 7.24 ± 0.10 Apgar score (Apgar score, median, range): G1: 10 (8–10) G2: 10 (8–10) G3: 10 (9–10) G4: 10 (9–10) p‐values for group comparisons not reported. The interaction between the supplementation groups (G2, G3, G4) and control group (G1) for these parameters are reported to be non‐significant |
Abbreviations: BMI, body mass index; G, group; Hb, haemoglobin; Hct, haematocrit; IUGR, intrauterine growth restriction; MCV, mean corpuscular volume; N, total number; n, number; NR, not reported; RCT, randomised controlled trial; SD, standard deviation.
List of Annexes
Annex A – Protocol
Annex B – EFSA’s intake assessment
Annex C – Intake data from national authorities
Annex D – References excluded at full text screening
Annex E – Outcome of the public consultation
Annexes A–E can be found in the online version of this output (in the ‘Supporting information’ section): https://doi.org/10.2903/j.efsa.2024.8819
EFSA NDA Panel (EFSA Panel on Nutrition, Novel Foods and Food Allergens) , Turck, D. , Bohn, T. , Castenmiller, J. , de Henauw, S. , Hirsch‐Ernst, K.‐I. , Knutsen, H. K. , Maciuk, A. , Mangelsdorf, I. , McArdle, H. J. , Pentieva, K. , Siani, A. , Thies, F. , Tsabouri, S. , Vinceti, M. , Aggett, P. , Fairweather‐Tait, S. , de Sesmaisons Lecarré, A. , Fabiani, L. , … Naska, A. (2024). Scientific opinion on the tolerable upper intake level for iron. EFSA Journal, 22 (6), e8819. 10.2903/j.efsa.2024.8819
Adopted: 30 April 2024
Annexes A‐E are available under the Supporting Information section .
Note: A plain language summary of this scientific opinion is available at https://efsa.onlinelibrary.wiley.com/doi/10.2903/j.efsa.2024.p220601
Notes
SCF (2000). Scientific Committee on Food. Guidelines of the Scientific Committee on Food for the Development of Tolerable Upper Intake Levels for Vitamins and Minerals. in: Scientific Committee on Food, Scientific Panel on Dietetic Products, Nutrition and Allergies (2006). Tolerable Upper Intake Levels for Vitamins and Minerals.
The expert panel was composed of Susan Fairweather‐Tait (Norwich Medical School, Faculty of Medicine and Health Sciences, University of East Anglia, UK), Kostas Pantopoulos (Lady Davis Institute for Medical Research, McGill University, Canada), Nils Milman (Departments of Clinical Biochemistry and Obstetrics, Naestved Hospital, University of Copenhagen, DK) and Gary Brittenham (Department of Pediatrics, College of Physicians and Surgeons, Columbia University, USA). A hearing of the expert panel was held on 5 January 2022.
Call for tender OC/EFSA/NUTRI/2021/01.
See Table 8 of OHAT's Handbook for Conducting Systematic Reviews for Health Effects Evaluations (OHAT/NTP, 2019).
Working Group consisting of representatives of 27 EU Member States and Norway.
The Mintel GNPD contains information on over three million food and beverage products, of which more than one million are or have been available on the European food market. Twenty‐five out of the 27 EU Member States and Norway are present in the database. The database provides the compulsory ingredient information reported on product labels and the nutrition declaration when available. http://www.mintel.com/globalnew‐products‐database.
Regulation (EC) No 1925/2006 of the European Parliament and of the Council of 20 December 2006 on the addition of vitamins and minerals and of certain other substances to foods. OJ L 404, 30.12.2006, p. 26–38.
Directive 2002/46/EC of the European Parliament and of the Council of 10 June 2002 on the approximation of the laws of the Member States relating to food supplements. OJ L 183, 12.7.2002, p. 51–57.
Commission Delegated Regulation (EU) 2016/127 of 25 September 2015 supplementing Regulation (EU) No 609/2013 of the European Parliament and of the Council as regards the specific compositional and information requirements for infant formula and follow‐on formula and as regards requirements on information relating to infant and young child feeding. OJ L 25, 2.2.2016, p. 1–29.
Commission Directive 2006/125/EC of 5 December 2006 on processed cereal‐based foods and baby foods for infants and young children, OJ L 339, 06.12.2006, p. 16–35.
The Mintel GNPD provides data on the content of supplements per serving which may not always reflect the daily dose recommended by the manufacturer.
Reference values used for food labelling.
Indicatively, 2.4% of the overall eating occasions reported a fortification descriptor (e.g. ‘F09.Fortification agent’) in the latest version of the Comprehensive Database (updated in December 2022), of which 0.2% report an iron‐related fortification descriptor, for foods such as biscuits, cereal flakes, infant and follow‐on formulae.
Fonseca‐Nunes et al. (2014) also reported on breast cancer but only included three studies while Chang et al. (2019) included six studies in the meta‐analysis. All studies used by Fonseca‐Nunes et al. (2014) were either included in the meta‐analysis or had been described narratively by Chang et al. (2019). Therefore, the results are only reported for the publication by Chang et al. (2019).
REFERENCES
- Adams, P. C. , Jeffrey, G. , & Ryan, J. (2023). Haemochromatosis. Lancet, 401, 1811–1821. 10.1016/s0140-6736(23)00287-8 [DOI] [PubMed] [Google Scholar]
- Alizadeh, L. , & Salehi, L. (2016). Is routine iron supplementation necessary in pregnant women with high hemoglobin? Iranian Red Crescent Medical Journal, 18, e22761. 10.5812/ircmj.22761 [DOI] [PMC free article] [PubMed] [Google Scholar]
- Baker, B. C. , Hayes, D. J. L. , & Jones, R. L. (2018). Effects of micronutrients on placental function: Evidence from clinical studies to animal models. Reproduction, 156, R69–R82. 10.1530/rep-18-0130 [DOI] [PubMed] [Google Scholar]
- Balder, H. F. , Vogel, J. , Jansen, M. C. , Weijenberg, M. P. , van den Brandt, P. A. , Westenbrink, S. , van der Meer, R. , & Goldbohm, R. A. (2006). Heme and chlorophyll intake and risk of colorectal cancer in The Netherlands cohort study. Cancer Epidemiology, Biomarkers & Prevention, 15, 717–725. 10.1158/1055-9965.EPI-05-0772 [DOI] [PubMed] [Google Scholar]
- Bao, W. , Chavarro, J. E. , Tobias, D. K. , Bowers, K. , Li, S. , Hu, F. B. , & Zhang, C. (2016). Long‐term risk of type 2 diabetes in relation to habitual iron intake in women with a history of gestational diabetes: A prospective cohort study. American Journal of Clinical Nutrition, 103, 375–381. 10.3945/ajcn.115.108712 [DOI] [PMC free article] [PubMed] [Google Scholar]
- Bao, W. , Rong, Y. , Rong, S. , & Liu, L. G. (2012). Dietary iron intake, body iron stores, and the risk of type 2 diabetes: A systematic review and meta‐analysis. BMC Medicine, 10. 10.1186/1741-7015-10-119 [DOI] [PMC free article] [PubMed] [Google Scholar]
- Barton, J. C. , Lee, P. L. , West, C. , & Bottomley, S. S. (2006). Iron overload and prolonged ingestion of iron supplements: Clinical features and mutation analysis of hemochromatosis‐associated genes in four cases. American Journal of Hematology, 81, 760–767. 10.1002/ajh.20714 [DOI] [PubMed] [Google Scholar]
- Beard, J. (2002). Dietary iron intakes and elevated iron stores in the elderly: Is it time to abandon the set‐point hypothesis of regulation of iron absorption? American Journal of Clinical Nutrition, 76, 1189–1190. 10.1093/ajcn/76.6.1189 [DOI] [PubMed] [Google Scholar]
- Behboudi‐Gandevani, S. , Safary, K. , Moghaddam‐Banaem, L. , Lamyian, M. , Goshtasebi, A. , & Alian‐Moghaddam, N. (2013). The relationship between maternal serum iron and zinc levels and their nutritional intakes in early pregnancy with gestational diabetes. Biological Trace Element Research, 154, 7–13. 10.1007/s12011-013-9703-y [DOI] [PubMed] [Google Scholar]
- Bell, H. , Berg, J. P. , Undlien, D. E. , Distante, S. , Raknerud, N. , Heier, H. E. , Try, K. , Thomassen, Y. , Haug, E. , Raha‐Chowdhury, R. , & Thorsby, E. (2000). The clinical expression of hemochromatosis in Oslo, Norway ‐ excessive oral iron intake may lead to secondary hemochromatosis even in HFE C282Y mutation negative subjects. Scandinavian Journal of Gastroenterology, 35, 1301–1307. [DOI] [PubMed] [Google Scholar]
- Blanco‐Rojo, R. , & Vaquero, M. P. (2019). Iron bioavailability from food fortification to precision nutrition. A review. Innovative Food Science & Emerging Technologies, 51, 126–138. 10.1016/j.ifset.2018.04.015 [DOI] [Google Scholar]
- Blomhoff, R. , Andersen, R. , Arnesen, E. K. , Christensen, J. J. , Eneroth, H. , Erkkola, M. , Gudanaviciene, I. , Halldorsson, T. I. , Høyer‐Lund, A. , Lemming, E. W. , Meltzer, H. M. , Pitsi, T. , Schwab, U. , Siksna, I. , Thorsdottir, I. , & Trolle, E. (2023). Nordic nutrition recommendations 2023 (p. 388). Nordic Council of Ministers. 10.6027/nord2023-003 [DOI] [Google Scholar]
- Blot, I. , Papiernik, E. , Kaltwasser, J. P. , Werner, E. , & Tchernia, G. (1981). Influence of routine administration of folic acid and iron during pregnancy. Gynecologic and Obstetric Investigation, 12, 294–304. 10.1159/000299659 [DOI] [PubMed] [Google Scholar]
- Borch‐Iohnsen, B. , & Pettersson, G. K. (1995). Iron. In Oskarsson A. (Ed.), Risk evaluation of essential trace elements (pp. 67–110). Nordic Council of Ministers. [Google Scholar]
- Bothwell, T. H. , Baynes, R. D. , MacFarlane, B. J. , & MacPhail, A. P. (1989). Nutritional iron requirements and food iron absorption. Journal of Internal Medicine, 226, 357–365. 10.1111/j.1365-2796.1989.tb01409.x [DOI] [PubMed] [Google Scholar]
- Bowers, K. , Yeung, E. , Williams, M. A. , Qi, L. , Tobias, D. K. , Hu, F. B. , & Zhang, C. (2011). A prospective study of prepregnancy dietary iron intake and risk for gestational diabetes mellitus. Diabetes Care, 34, 1557–1563. [DOI] [PMC free article] [PubMed] [Google Scholar]
- Bries, A. E. , Wang, C. , Agbemafle, I. , Wels, B. , & Reddy, M. B. (2019). Assessment of acute serum iron, non‐transferrin‐bound iron, and gastrointestinal symptoms with 3‐week consumption of iron‐enriched aspergillus oryzae compared with ferrous sulfate. Current Developments in Nutrition, 3, nzz127. 10.1093/cdn/nzz127 [DOI] [PMC free article] [PubMed] [Google Scholar]
- Bro, S. , Sandström, B. , & Heydorn, K. (1990). Intake of essential and toxic trace elements in a random sample of Danish men as determined by the duplicate portion sampling technique. Journal of Trace Elements and Electrolytes in Health and Disease, 4, 147–155. [PubMed] [Google Scholar]
- Brock, C. , & Curry, H. (1985). Comparative incidence of side effects of a wax‐matrix and a sustained‐release iron preparation. Clinical Therapeutics, 7, 492–496. [PubMed] [Google Scholar]
- Brock, C. , Curry, H. , Hanna, C. , Knipfer, M. , & Taylor, L. (1985). Adverse effects of iron supplementation: A comparative trial of a wax‐matrix iron preparation and conventional ferrous sulfate tablets. Clinical Therapeutics, 7, 568–573. [PubMed] [Google Scholar]
- Burman, D. (1972). Haemoglobin levels in normal infants aged 3 to 24 months, and the effect of iron. Archives of Disease in Childhood, 47, 261–271. 10.1136/adc.47.252.261 [DOI] [PMC free article] [PubMed] [Google Scholar]
- Camaschella, C. , Nai, A. , & Silvestri, L. (2020). Iron metabolism and iron disorders revisited in the hepcidin era. Haematologica, 105, 260–272. 10.3324/haematol.2019.232124 [DOI] [PMC free article] [PubMed] [Google Scholar]
- Canavesi, E. , Alfieri, C. , Pelusi, S. , & Valenti, L. (2012). Hepcidin and HFE protein: Iron metabolism as a target for the anemia of chronic kidney disease. World Journal of Nephrology, 1, 166–176. 10.5527/wjn.v1.i6.166 [DOI] [PMC free article] [PubMed] [Google Scholar]
- Cancelo‐Hidalgo, M. J. , Castelo‐Branco, C. , Palacios, S. , Haya‐Palazuelos, J. , Ciria‐Recasens, M. , Manasanch, J. , & Perez‐Edo, L. (2013). Tolerability of different oral iron supplements: A systematic review. Current Medical Research and Opinion, 29, 291–303. 10.1185/03007995.2012.761599 [DOI] [PubMed] [Google Scholar]
- Cao, H. , Wang, C. , Chai, R. , Dong, Q. , & Tu, S. (2017). Iron intake, serum iron indices and risk of colorectal adenomas: A meta‐analysis of observational studies. European Journal of Cancer Care, 26, e12486. 10.1111/ecc.12486 [DOI] [PubMed] [Google Scholar]
- Carrier, J. , Aghdassi, E. , Cullen, J. , & Allard, J. P. (2002). Iron supplementation increases disease activity and vitamin E ameliorates the effect in rats with dextran sulfate sodium‐induced colitis. Journal of Nutrition, 132, 3146–3150. 10.1093/jn/131.10.3146 [DOI] [PubMed] [Google Scholar]
- Chan, K. K. L. , Chan, B. C. P. , Lam, K. F. , Tam, S. , & Lao, T. T. (2009). Iron supplement in pregnancy and development of gestational diabetes‐a randomised placebo‐controlled trial. Bjog‐an International Journal of Obstetrics and Gynaecology, 116, 789–798. 10.1111/j.1471-0528.2008.02014.x [DOI] [PubMed] [Google Scholar]
- Chang, V. C. , Cotterchio, M. , & Khoo, E. (2019). Iron intake, body iron status, and risk of breast cancer: A systematic review and meta‐analysis. BMC Cancer, 19, 543. 10.1186/s12885-019-5642-0 [DOI] [PMC free article] [PubMed] [Google Scholar]
- Chang, X. , Lv, C. , & Zhao, G. (2023). A dual function of ferritin (animal and plant): Its holo form for iron supplementation and apo form for delivery systems. Annual Review of Food Science and Technology, 14, 113–133. 10.1146/annurev-food-060721-024902 [DOI] [PubMed] [Google Scholar]
- Cheng, P. , Yu, J. , Huang, W. , Bai, S. , Zhu, X. , Qi, Z. , Shao, W. , & Xie, P. (2015). Dietary intake of iron, zinc, copper, and risk of Parkinson's disease: A meta‐analysis. Neurological Sciences, 36, 2269–2275. 10.1007/s10072-015-2349-0 [DOI] [PubMed] [Google Scholar]
- Chung, C. S. , Nagey, D. A. , Veillon, C. , Patterson, K. Y. , Jackson, R. T. , & Moser‐Veillon, P. B. (2002). A single 60‐mg iron dose decreases zinc absorption in lactating women. Journal of Nutrition, 132, 1903–1905. 10.1093/jn/132.7.1903 [DOI] [PubMed] [Google Scholar]
- Cook, J. D. , Barry, W. E. , Hershko, C. , Fillet, G. , & Finch, C. A. (1973). Iron kinetics with emphasis on iron overload. American Journal of Pathology, 72, 337–344. [PMC free article] [PubMed] [Google Scholar]
- Coplin, M. , Schuette, S. , Leichtmann, G. , & Lashner, B. (1991). Tolerability of iron: A comparison of bis‐glycino iron II and ferrous sulfate. Clinical Therapeutics, 13, 606–612. [PubMed] [Google Scholar]
- Creighton Mitchell, T. , & McClain, D. A. (2014). Diabetes and hemochromatosis. Current Diabetes Reports, 14, 488. 10.1007/s11892-014-0488-y [DOI] [PubMed] [Google Scholar]
- Cross, A. J. , Harnly, J. M. , Ferrucci, L. M. , Risch, A. , Mayne, S. T. , & Sinha, R. (2012). Developing a heme iron database for meats according to meat type, cooking method and doneness level. Food and Nutrition Sciences, 3, 905–913. 10.4236/fns.2012.37120 [DOI] [PMC free article] [PubMed] [Google Scholar]
- Cubadda, F. (2021). The 2012–2014 Italian TDS. Italian National Institute of health. Department of food safety, nutrition and veterinary public health. [Google Scholar]
- Cullis, J. O. , Fitzsimons, E. J. , Griffiths, W. J. , Tsochatzis, E. , & Thomas, D. W. (2018). Investigation and management of a raised serum ferritin. British Journal of Haematology, 181, 331–340. 10.1111/bjh.15166 [DOI] [PubMed] [Google Scholar]
- Das, S. K. , Patel, V. B. , Basu, R. , Wang, W. , DesAulniers, J. , Kassiri, Z. , & Oudit, G. Y. (2017). Females are protected from iron‐overload cardiomyopathy independent of iron metabolism: Key role of oxidative stress. Journal of the American Heart Association, 6, e003456. 10.1161/JAHA.116.003456 [DOI] [PMC free article] [PubMed] [Google Scholar]
- Davidsson, L. , Almgren, A. , Sandstrom, B. , & Hurrell, R. F. (1995). Zinc absorption in adult humans: The effect of iron fortification. British Journal of Nutrition, 74, 417–425. 10.1079/BJN19950145 [DOI] [PubMed] [Google Scholar]
- de Jong, M. H. , Nawijn, E. L. , & Verkaik‐Kloosterman, J. (2022). Contribution of voluntary fortified foods to micronutrient intake in The Netherlands. European Journal of Nutrition, 61, 1649–1663. 10.1007/s00394-021-02728-4 [DOI] [PMC free article] [PubMed] [Google Scholar]
- De Sanctis, V. , Soliman, A. , Tzoulis, P. , Daar, S. , Fiscina, B. , & Kattamis, C. (2021). The pancreatic changes affecting glucose homeostasis in transfusion dependent β‐ thalassemia (TDT): A short review. Acta Biomed, 92, e2021232. 10.23750/abm.v92i3.11685 [DOI] [PMC free article] [PubMed] [Google Scholar]
- Dewey, K. , Bazzano, L. , Davis, T. , Donovan, S. , Taveras, E. , Kleinman, R. , Güngör, D. , Venkatramanan, S. , Madan, E. , English, L. , Terry, N. , Butera, G. , & Obbagy, J. (2020). Iron from supplements consumed during infancy and toddlerhood and growth, size, and body composition: A systematic review. U.S. Department of Agriculture, Food and Nutrition Service, Center for Nutrition Policy and Promotion, Nutrition Evidence Systematic Review, 56. 10.52570/NESR.DGAC2020.SR0303 [DOI] [PubMed] [Google Scholar]
- Dewey, K. G. , Domellöf, M. , Cohen, R. J. , Landa Rivera, L. , Hernell, O. , & Lönnerdal, B. (2002). Iron supplementation affects growth and morbidity of breast‐fed infants: Results of a randomized trial in Sweden and Honduras. The Journal of Nutrition, 132, 3249–3255. 10.1093/jn/132.11.3249 [DOI] [PubMed] [Google Scholar]
- Dewey, K. G. , & Oaks, B. M. (2017). U‐shaped curve for risk associated with maternal hemoglobin, iron status, or iron supplementation. American Journal of Clinical Nutrition, 106, 1694S–1702S. 10.3945/ajcn.117.156075 [DOI] [PMC free article] [PubMed] [Google Scholar]
- Domellöf, M. , Cohen, R. J. , Dewey, K. G. , Hernell, O. , Rivera, L. L. , & Lonnerdal, B. (2001). Iron supplementation of breast‐fed Honduran and Swedish infants from 4 to 9 months of age. Journal of Pediatrics, 138, 679–687. 10.1067/mpd.2001.112895 [DOI] [PubMed] [Google Scholar]
- Domellöf, M. , Hernell, O. , Abrams, S. A. , Chen, Z. , & Lönnerdal, B. (2009). Iron supplementation does not affect copper and zinc absorption in breastfed infants. The American Journal of Clinical Nutrition, 89, 185–190. 10.3945/ajcn.2008.26887 [DOI] [PubMed] [Google Scholar]
- Donker, A. E. , van der Staaij, H. , & Swinkels, D. W. (2021). The critical roles of iron during the journey from fetus to adolescent: Developmental aspects of iron homeostasis. Blood Reviews, 50, 100866. 10.1016/j.blre.2021.100866 [DOI] [PubMed] [Google Scholar]
- Dostal, A. , Baumgartner, J. , Riesen, N. , Chassard, C. , Smuts, C. M. , Zimmermann, M. B. , & Lacroix, C. (2014). Effects of iron supplementation on dominant bacterial groups in the gut, faecal SCFA and gut inflammation: A randomised, placebo‐controlled intervention trial in south African children. British Journal of Nutrition, 112, 547–556. 10.1017/s0007114514001160 [DOI] [PubMed] [Google Scholar]
- Duck, K. A. , & Connor, J. R. (2016). Iron uptake and transport across physiological barriers. Biometals, 29, 573–591. 10.1007/s10534-016-9952-2 [DOI] [PMC free article] [PubMed] [Google Scholar]
- Durrani, L. , Ejaz, S. , Tavares, L. B. , Mohyeldin, M. , Abureesh, D. , Boorenie, M. , & Khan, S. (2021). Correlation between high serum ferritin level and gestational diabetes: A systematic review. Cureus, 13, e18990. 10.7759/cureus.18990 [DOI] [PMC free article] [PubMed] [Google Scholar]
- EASL (European Association for the Study of the Liver) . (2010). EASL (European Association for the Study of the liver) clinical practice guidelines for HFE hemochromatosis. Journal of Hepatology, 53, 3–22. 10.1016/j.jhep.2010.03.001 [DOI] [PubMed] [Google Scholar]
- EASL (European Association for the Study of the Liver) . (2022). EASL (European Association for the Study of the liver) clinical practice guidelines on haemochromatosis. Journal of Hepatology, 77, 479–502. 10.1016/j.jhep.2022.03.033 [DOI] [PubMed] [Google Scholar]
- East, P. L. , Reid, B. , Blanco, E. , Burrows, R. , Lozoff, B. , & Gahagan, S. (2021). Iron supplementation given to nonanemic infants: Neurocognitive functioning at 16 years. Nutritional Neuroscience, 26, 40–49. 10.1080/1028415x.2021.2013399 [DOI] [PMC free article] [PubMed] [Google Scholar]
- EFSA (European Food Safety Authority) . (2004). Opinion of the scientific panel on dietetic products, nutrition and allergies [NDA] related to the tolerable upper intake level of iron. EFSA Journal, 2(11), 125. 10.2903/j.efsa.2004.125 [DOI] [Google Scholar]
- EFSA (European Food Safety Authority) . (2010). Application of systematic review methodology to food and feed safety assessments to support decision making. EFSA Journal, 8(6), 1637. 10.2903/j.efsa.2010.1637 [DOI] [PMC free article] [PubMed] [Google Scholar]
- EFSA (European Food Safety Authority) . (2011). Use of the EFSA comprehensive European food consumption database in exposure assessment. EFSA Journal, 9(3), 2097. 10.2903/j.efsa.2011.2097 [DOI] [Google Scholar]
- EFSA (European Food Safety Authority) . (2012). Conclusion on the peer review of the pesticide risk assessment of the active substance iron sulfate. EFSA Journal, 10(1), 2521. 10.2903/j.efsa.2012.2521 [DOI] [PMC free article] [PubMed] [Google Scholar]
- EFSA (European Food Safety Authority) . (2015a). Conclusion on the peer review of the pesticide risk assessment of the active substance ferric phosphate. EFSA Journal, 13(1), 3973. 10.2903/j.efsa.2015.3973 [DOI] [PMC free article] [PubMed] [Google Scholar]
- EFSA (European Food Safety Authority) . (2015b). Scientific report on principles and process for dealing with data and evidence in scientific assessments. EFSA Journal, 13(5), 4121. 10.2903/j.efsa.2015.4121 [DOI] [Google Scholar]
- EFSA (European Food Safety Authority) . (2020). Peer review of the pesticide risk assessment of the active substance ferric pyrophosphate. EFSA Journal, 18(1), 5986. 10.2903/j.efsa.2020.5986 [DOI] [PMC free article] [PubMed] [Google Scholar]
- EFSA (European Food Safety Authority) . (2022). Protocol for the intake assessments performed in the context of the revision of tolerable upper intake levels for selected nutrients. EFSA Supporting Publication, 19(8), e200801. 10.2903/sp.efsa.2022.e200801 [DOI] [Google Scholar]
- EFSA AFC Panel (Scientific Panel on Food Additives, Flavourings, Processing Aids and Materials in Contact with Food) . (2006). Opinion of the scientific panel on food additives, flavourings, processing aids and materials in contact with food (AFC) related to ferrous bisglycinate as a source of iron for use in the manufacturing of foods ad in food supplements. EFSA Journal, 299. 10.2903/j.efsa.2006.299 [DOI] [Google Scholar]
- EFSA AFC Panel (Scientific Panel on Food Additives, Flavourings, Processing Aids and Materials in Contact with Food ) . (2007). Opinion of the scientific panel on food additives, flavourings, processing aids and materials in contact with food (AFC) related to calcium, iron, magnesium, potassium and zinc l‐pidolate as sources for calcium, iron, magnesium, potassium and zinc added for nutritional purposes to food supplements and to foods intended for particular nutritional uses. EFSA Journal, 495–503, 10. 10.2903/j.efsa.2007.495 [DOI] [Google Scholar]
- EFSA ANS Panel (Scientific Panel on Food Additives and Nutrient Sources added to Food) . (2009a). Ferrous phosphate added for nutritional purposes to food supplement. EFSA Journal, 7(2), 951. 10.2903/j.efsa.2009.951 [DOI] [Google Scholar]
- EFSA ANS Panel (Scientific Panel on Food Additives and Nutrient Sources added to Food) . (2009b). Iron (II) taurate, magnesium taurate and magnesium acetyl taurate as sources of iron or magnesium added for nutritional purposes in food supplements. EFSA Journal, 947. 10.2903/j.efsa.2009.947 [DOI] [Google Scholar]
- EFSA ANS Panel (Scientific Panel on Food Additives and Nutrient Sources added to Food) . (2010a). Scientific Opinion on the safety of ferrous ammonium phosphate as a source of iron added for nutritional purposes to foods for the general population (including food supplements) and to foods for particular nutritional uses. EFSA Journal, 8(5), 1584. 10.2903/j.efsa.2010.1584 [DOI] [PMC free article] [PubMed] [Google Scholar]
- EFSA ANS Panel (Scientific Panel on Food Additives and Nutrient Sources added to Food) . (2010b). Scientific opinion on the use of ferric sodium EDTA as a source of iron added for nutritional purposes to foods for the general population (including food supplements) and to foods for particular nutritional uses. EFSA Journal, 8(1), 1414. 10.2903/j.efsa.2010.1414 [DOI] [PMC free article] [PubMed] [Google Scholar]
- EFSA NDA Panel (EFSA Panel on Dietetic Products, Nutrition and Allergies) . (2004). Opinion related to the tolerable upper intake level of iron. EFSA Journal, 125. 10.2903/j.efsa.2004.125 [DOI] [Google Scholar]
- EFSA NDA Panel (EFSA Panel on Dietetic Products, Nutrition and Allergies) . (2015). Scientific opinion on dietary reference values for iron. EFSA Journal, 13(10), 4254. 10.2903/j.efsa.2015.4254 [DOI] [PMC free article] [PubMed] [Google Scholar]
- EFSA NDA Panel (EFSA Panel on Nutrition, Novel Foods and Food Allergens) . (2021). Safety of iron hydroxide adipate tartrate as a novel food pursuant to regulation (EU) 2015/2283 and as a source of iron in the context of directive 2002/46/EC. EFSA Journal, 19(12), 6935. 10.2903/j.efsa.2021.6935 [DOI] [PMC free article] [PubMed] [Google Scholar]
- EFSA NDA Panel (EFSA Panel on Nutrient, Novel Foods and Food Allergens) . (2022a). Guidance for establishing and applying tolerable upper intake levels for vitamins and essential minerals. EFSA Journal, 20(1), e200102. 10.2903/j.efsa.2022.e200102 [DOI] [PMC free article] [PubMed] [Google Scholar]
- EFSA NDA Panel (EFSA Panel on Nutrition, Novel Foods and Food Allergens) . (2022b). Safety of iron milk proteinate as a novel food pursuant to regulation (EU) 2015/2283 and bioavailability of iron from this source in the context of directive 2002/46/EC. EFSA Journal, 20(9), 7549. 10.2903/j.efsa.2022.7549 [DOI] [PMC free article] [PubMed] [Google Scholar]
- EFSA Scientific Committee . (2011). Statistical significance and biological relevance. EFSA Journal, 9(9), 2372. 10.2903/j.efsa.2011.2372 [DOI] [Google Scholar]
- EFSA Scientific Committee . (2012). Guidance on selected default values to be used by the EFSA scientific committee, scientific panels and units in the absence of actual measured data. EFSA Journal, 10(3), 2579. 10.2903/j.efsa.2012.2579 [DOI] [PMC free article] [PubMed] [Google Scholar]
- EFSA Scientific Committee . (2017a). Guidance on the assessment of the biological relevance of data in scientific assessments. EFSA Journal, 15(8), 4970. 10.2903/j.efsa.2017.4970 [DOI] [PMC free article] [PubMed] [Google Scholar]
- EFSA Scientific Committee . (2017b). Guidance on the use of the weight of evidence approach in scientific assessments. EFSA Journal, 15(8), 4971. 10.2903/j.efsa.2017.4971 [DOI] [PMC free article] [PubMed] [Google Scholar]
- EFSA Scientific Committee . (2018). Guidance on uncertainty analysis in scientific assessments. EFSA Journal, 16(1), 5123. 10.2903/j.efsa.2018.5123 [DOI] [PMC free article] [PubMed] [Google Scholar]
- EFSA Scientific Committee . (2020). Draft for internal testing scientific committee guidance on appraising and integrating evidence from epidemiological studies for use in EFSA's scientific assessments. EFSA Journal, 18(8), 6221. 10.2903/j.efsa.2020.6221 [DOI] [PMC free article] [PubMed] [Google Scholar]
- Ems, T. , St Lucia, K. , & Huecker, M. R. (2022). Biochemistry, iron absorption, StatPearls [internet]. StatPearls Publishing. [PubMed] [Google Scholar]
- Esamai, F. , Liechty, E. , Ikemeri, J. , Westcott, J. , Kemp, J. , Culbertson, D. , Miller, L. V. , Hambidge, K. M. , & Krebs, N. F. (2014). Zinc absorption from micronutrient powder is low but is not affected by iron in Kenyan infants. Nutrients, 6, 5636–5651. 10.3390/nu6125636 [DOI] [PMC free article] [PubMed] [Google Scholar]
- Eshak, E. S. , Iso, H. , Maruyama, K. , Muraki, I. , & Tamakoshi, A. (2018). Associations between dietary intakes of iron, copper and zinc with risk of type 2 diabetes mellitus: A large population‐based prospective cohort study. Clinical Nutrition, 37, 667–674. 10.1016/j.clnu.2017.02.010 [DOI] [PubMed] [Google Scholar]
- Etcheverry, P. , Carstens, G. E. , Brown, E. , Hawthorne, K. M. , Chen, Z. , & Griffin, I. J. (2007). Production of stable‐isotope‐labeled bovine heme and its use to measure heme‐iron absorption in children. The American Journal of Clinical Nutrition, 85, 452–459. 10.1093/ajcn/85.2.452 [DOI] [PubMed] [Google Scholar]
- European Commission . (2023). unpublished). National provisions on the mandatory and voluntary addition of vitamins and minerals to food.
- EVM (Expert Group on Vitamins and Minerals; UK Food Standards Agency) . (2003). Safe upper levels for vitamins and minerals. Publications FSA. https://www.food.gov.uk/multimedia/pdfs/vitmin2003.pdf [Google Scholar]
- FAO/WHO (Food and Agriculture Organization of the United Nations/World Health Organization) . (2009). In: Principles and methods for the risk assessment of chemicals in food. Environmental Health Criteria 240. WHO, Geneva. 34 pp. Available online: https://www.who.int/publications/i/item/9789241572408 [Google Scholar]
- Fairweather‐Tait, S. J. , & Teucher, B. (2002). Iron and calcium bioavailability of fortified foods and dietary supplements. Nutrition Reviews, 60, 360–367. 10.1301/00296640260385801 [DOI] [PubMed] [Google Scholar]
- Fairweather‐Tait, S. J. , Wharf, S. G. , & Fox, T. E. (1995). Zinc absorption in infants fed iron‐fortified weaning food. American Journal of Clinical Nutrition, 62, 785–789. 10.1093/ajcn/62.4.785 [DOI] [PubMed] [Google Scholar]
- Falahi, E. , Akbari, S. , Ebrahimzade, F. , & Gargari, B. P. (2011). Impact of prophylactic iron supplementation in healthy pregnant women on maternal iron status and birth outcome. Food and Nutrition Bulletin, 32, 213–217. 10.1177/156482651103200305 [DOI] [PubMed] [Google Scholar]
- Fang, X. , An, P. , Wang, H. , Wang, X. , Shen, X. , Li, X. , Min, J. , Liu, S. , & Wang, F. (2015). Dietary intake of heme iron and risk of cardiovascular disease: A dose‐response meta‐analysis of prospective cohort studies. Nutrition, Metabolism, and Cardiovascular Diseases, 25, 24–35. 10.1016/j.numecd.2014.09.002 [DOI] [PubMed] [Google Scholar]
- Farquhar, J. D. (1963). Iron supplementation during first year of life. American Journal of Diseases of Children, 106, 201–206. 10.1001/archpedi.1963.02080050203014 [DOI] [PubMed] [Google Scholar]
- Faruqi, A. , & Mukkamalla, S. K. R. (2023). Iron binding capacity. StatPearls. https://www.ncbi.nlm.nih.gov/books/NBK559119/ [PubMed] [Google Scholar]
- Fernandez‐Cao, J. C. , Aranda, N. , Ribot, B. , Tous, M. , & Arija, V. (2017). Elevated iron status and risk of gestational diabetes mellitus: A systematic review and meta‐analysis. Maternal & Child Nutrition, 13, e12400. 10.1111/mcn.12400 [DOI] [PMC free article] [PubMed] [Google Scholar]
- Fitzsimons, E. J. , Cullis, J. O. , Thomas, D. W. , Tsochatzis, E. , & Griffiths WJH and the British Society for Haematology . (2018). Diagnosis and therapy of genetic haemochromatosis (review and 2017 update). British Journal of Haematology, 181, 293–303. 10.1111/bjh.15164 [DOI] [PubMed] [Google Scholar]
- Fleming, D. J. , Tucker, K. L. , Jacques, P. F. , Dallal, G. E. , Wilson, P. W. , & Wood, R. J. (2002). Dietary factors associated with the risk of high iron stores in the elderly Framingham heart study cohort. American Journal of Clinical Nutrition, 76, 1375–1384. 10.1093/ajcn/76.6.1375 [DOI] [PubMed] [Google Scholar]
- Fonseca‐Nunes, A. , Jakszyn, P. , & Agudo, A. (2014). Iron and cancer risk‐a systematic review and meta‐analysis of the epidemiological evidence. Cancer Epidemiology, Biomarkers & Prevention, 23, 12–31. 10.1158/1055-9965.Epi-13-0733 [DOI] [PubMed] [Google Scholar]
- Frazer, D. M. , & Anderson, G. J. (2003). The orchestration of body iron intake: How and where do enterocytes receive their cues? Blood Cells, Molecules, and Diseases, 30, 288–297. 10.1016/s1079-9796(03)00039-1 [DOI] [PubMed] [Google Scholar]
- Friling, M. , García‐Muñoz, A. M. , Perrinjaquet‐Moccetti, T. , Victoria‐Montesinos, D. , Pérez‐Piñero, S. , Abellán‐Ruiz, M. S. , Luque‐Rubia, A. J. , García‐Guillén, A. I. , Cánovas, F. , & Ivanir, E. (2022). Tolerability of oral supplementation with microencapsulated ferric saccharate compared to ferrous sulphate in healthy premenopausal woman: A crossover, randomized, double‐blind clinical trial. International Journal of Molecular Sciences, 23, 12282. 10.3390/ijms232012282 [DOI] [PMC free article] [PubMed] [Google Scholar]
- Frykman, E. , Bystrom, M. , Jansson, U. , Edberg, A. , & Hansen, T. (1994). Side effects of iron supplements in blood donors: Superior tolerance of heme iron. Journal of Laboratory and Clinical Medicine, 123, 561–564. [PubMed] [Google Scholar]
- Fu, S. M. , Li, F. F. , Zhou, J. G. , & Liu, Z. P. (2016). The relationship between body iron status, iron intake and gestational diabetes a systematic review and meta‐analysis. Medicine, 95, e2383. 10.1097/md.0000000000002383 [DOI] [PMC free article] [PubMed] [Google Scholar]
- Fung, E. B. , Ritchie, L. D. , Woodhouse, L. R. , Roehl, R. , & King, J. C. (1997). Zinc absorption in women during pregnancy and lactation: A longitudinal study. American Journal of Clinical Nutrition, 66, 80–88. 10.1093/ajcn/66.1.80 [DOI] [PubMed] [Google Scholar]
- Gabrielsen, J. S. , Lamb, D. J. , & Lipshultz, L. I. (2018). Iron and a man's reproductive health: The good, the bad, and the ugly. Current Urology Reports, 19, 60. 10.1007/s11934-018-0808-x [DOI] [PMC free article] [PubMed] [Google Scholar]
- Gahagan, S. , Delker, E. , Blanco, E. , Burrows, R. , & Lozoff, B. (2019). Randomized controlled trial of iron‐fortified versus low‐iron infant formula: Developmental outcomes at 16 years. Journal of Pediatrics, 212, 124–130. 10.1016/j.jpeds.2019.05.030 [DOI] [PMC free article] [PubMed] [Google Scholar]
- Gahagan, S. , Yu, S. , Kaciroti, N. , Castillo, M. , & Lozoff, B. (2009). Linear and ponderal growth trajectories in well‐nourished, iron‐sufficient infants are unimpaired by iron supplementation. Journal of Nutrition, 139, 2106–2112. 10.3945/jn.108.100735 [DOI] [PMC free article] [PubMed] [Google Scholar]
- Galetti, V. , Stoffel, N. U. , Sieber, C. , Zeder, C. , Moretti, D. , & Zimmermann, M. B. (2021). Threshold ferritin and hepcidin concentrations indicating early iron deficiency in young women based on upregulation of iron absorption. EClinicalMedicine, 39, 101052. 10.1016/j.eclinm.2021.101052 [DOI] [PMC free article] [PubMed] [Google Scholar]
- Galy, B. , Conrad, M. , & Muckenthaler, M. (2024). Mechanisms controlling cellular and systemic iron homeostasis. Nature Reviews Molecular Cell Biology, 25, 133–155. 10.1038/s41580-023-00648-1 [DOI] [PubMed] [Google Scholar]
- Gangaidzo, I. T. , & Gordeuk, V. R. (1995). Hepatocellular carcinoma and African iron overload. Gut, 37, 727–730. 10.1136/gut.37.5.727 [DOI] [PMC free article] [PubMed] [Google Scholar]
- Ganz, T. (2013). Systemic iron homeostasis. Physiological Reviews, 93, 1721–1741. 10.1152/physrev.00008.2013 [DOI] [PubMed] [Google Scholar]
- Garcia‐Casal, M. N. , Pasricha, S. R. , Martinez, R. X. , Lopez‐Perez, L. , & Peña‐Rosas, J. P. (2021). Serum or plasma ferritin concentration as an index of iron deficiency and overload. Cochrane Database of Systematic Reviews, 5, Cd011817. 10.1002/14651858.CD011817.pub2 [DOI] [PMC free article] [PubMed] [Google Scholar]
- Gattermann, N. , Muckenthaler, M. U. , Kulozik, A. E. , Metzgeroth, G. , & Hastka, J. (2021). The evaluation of iron deficiency and iron overload. Deutsches Ärzteblatt International, 118, 847–856. 10.3238/arztebl.m2021.0290 [DOI] [PMC free article] [PubMed] [Google Scholar]
- Georgieff, M. K. , Krebs, N. F. , & Cusick, S. E. (2019). The benefits and risks of iron supplementation in pregnancy and childhood. Annual Review of Nutrition, 21, 121–146. 10.1146/annurev-nutr-082018-124213 [DOI] [PMC free article] [PubMed] [Google Scholar]
- Gong, L. , Sun, J. , & Cong, S. (2023). Levels of iron and iron‐related proteins in Alzheimer's disease: A systematic review and meta‐analysis. Journal of Trace Elements in Medicine and Biology, 80, 127304. 10.1016/j.jtemb.2023.127304 [DOI] [PubMed] [Google Scholar]
- Gräsbeck, R. , Kouvonen, I. , Lundberg, M. , & Tenhunen, R. (1979). An intestinal receptor for heme. Scandinavian Journal of Haematology, 23, 5–9. 10.1111/j.1600-0609.1979.tb02845.x [DOI] [PubMed] [Google Scholar]
- Green, P. , Eviatar, J. M. , Sirota, P. , & Avidor, I. (1989). Secondary hemochromatosis due to prolonged iron ingestion. Israel Journal of Medical Sciences, 25, 199–201. [PubMed] [Google Scholar]
- Grosse, S. D. , Gurrin, L. C. , Bertalli, N. A. , & Allen, K. J. (2018). Clinical penetrance in hereditary hemochromatosis: Estimates of the cumulative incidence of severe liver disease among HFE C282Y homozygotes. Genetics in Medicine, 20, 383–389. 10.1038/gim.2017.121 [DOI] [PMC free article] [PubMed] [Google Scholar]
- Grubić Kezele, T. , & Ćurko‐Cofek, B. (2020). Age‐related changes and sex‐related differences in brain iron metabolism. Nutrients, 12(9), 2601. 10.3390/nu12092601 [DOI] [PMC free article] [PubMed] [Google Scholar]
- Gruenheid, S. , Cellier, M. , Vidal, S. , & Gros, P. (1995). Identification and characterization of a second mouse Nramp gene. Genomics, 25, 514–525. 10.1016/0888-7543(95)80053-O [DOI] [PubMed] [Google Scholar]
- Hacihamdioglu, D. , Kurekci, A. E. , Gursel, O. , Atay, A. A. , Balamtekin, N. , Aydin, A. , Haşimi, A. , & Ozcan, O. (2013). Evaluation of lipid peroxidation and antioxidant system in healthy iron‐replete infants receiving iron prophylaxis. Nutrition, 29, 138–142. 10.1016/j.nut.2012.05.009 [DOI] [PubMed] [Google Scholar]
- Haig, A. , & Driman, D. K. (2006). Iron‐induced mucosal injury to the upper gastrointestinal tract. Histopathology, 48, 808–812. 10.1111/j.1365-2559.2006.02448.x [DOI] [PubMed] [Google Scholar]
- Hallberg, L. , Hulthén, L. , & Garby, L. (1998). Iron stores in man in relation to diet and iron requirements. European Journal of Clinical Nutrition, 52, 623–631. 10.1038/sj.ejcn.1600623 [DOI] [PubMed] [Google Scholar]
- Hallberg, L. , Ryttinger, L. , & Solvell, L. (1966). Side‐effects of oral iron therapy. A double‐blind study of different iron compounds in tablet form. Acta Medica Scandinavica Supplementum, 459, 3–10. 10.1111/j.0954-6820.1966.tb19403.x [DOI] [PubMed] [Google Scholar]
- Hamdeh, S. , Micic, D. , & Hanauer, S. (2021). Review article: Drug‐induced small bowel injury. Alimentary Pharmacology and Therapeutics, 54, 1370–1388. 10.1111/apt.16642 [DOI] [PubMed] [Google Scholar]
- Han, M. H. , Guan, L. , Ren, Y. C. , Zhao, Y. , Liu, D. C. , Zhang, D. D. , Liu, L. L. , Liu, F. Y. , Chen, X. , Cheng, C. , Li, Q. M. , Guo, C. M. , Zhou, Q. G. , Tian, G. , Qie, R. R. , Huang, S. B. , Wu, X. Y. , Liu, Y. , Li, H. H. , … Lu, J. (2020). Dietary iron intake and risk of death due to cardiovascular diseases: A systematic review and dose‐response meta‐analysis of prospective cohort studies. Asia Pacific Journal of Clinical Nutrition, 29, 309–321. 10.6133/apjcn.202007_29(2).0014 [DOI] [PubMed] [Google Scholar]
- Harrison, A. V. , Lorenzo, F. R. , & McClain, D. A. (2023). Iron and the pathophysiology of diabetes. Annual Review of Physiology, 85, 339–362. 10.1146/annurev-physiol-022522-102832 [DOI] [PMC free article] [PubMed] [Google Scholar]
- Harvey, L. J. , Dainty, J. R. , Hollands, W. J. , Bull, V. J. , Hoogewerff, J. A. , Foxall, R. J. , McAnena, L. , Strain, J. J. , & Fairweather‐Tait, S. J. (2007). Effect of high‐dose iron supplements on fractional zinc absorption and status in pregnant women. American Journal of Clinical Nutrition, 85, 131–136. 10.1093/ajcn/85.1.131 [DOI] [PubMed] [Google Scholar]
- Haschke, F. , Ziegler, E. E. , Edwards, B. B. , & Fomon, S. J. (1986). Effect of iron fortification of infant formula on trace mineral absorption. Journal of Pediatric Gastroenterology and Nutrition, 5, 768–773. [DOI] [PubMed] [Google Scholar]
- He, J. , Fang, A. , Yu, S. , Shen, X. , & Li, K. (2020). Dietary nonheme, heme, and total iron intake and the risk of diabetes in adults: Results from the China health and nutrition survey. Diabetes Care, 43, 776–784. 10.2337/dc19-2202 [DOI] [PMC free article] [PubMed] [Google Scholar]
- Helin, A. , Kinnunen, T. I. , Raitanen, J. , Ahonen, S. , Virtanen, S. M. , & Luoto, R. (2012). Iron intake, haemoglobin and risk of gestational diabetes: A prospective cohort study. BMJ Open, 2, e001730. 10.1136/bmjopen-2012-001730 [DOI] [PMC free article] [PubMed] [Google Scholar]
- Hettiarachchi, M. , Liyanage, C. , Hilmers, D. , Griffin, I. , & Abrams, S. A. (2010). Changing the zinc:Iron ratio in a cereal‐based nutritional supplement has no effect on percent absorption of iron and zinc in Sri Lankan children. British Journal of Nutrition, 103, 1015–1022. 10.1017/S0007114509992728 [DOI] [PubMed] [Google Scholar]
- Heuer, T. , Walter, C. , Krems, C. , & Hoffmann, I. (Max Rubner‐Institut). (2012). Nährstoffzufuhr über Supplemente – Ergebnisse der Nationalen Verzehrsstudie II. In P. Stehle (Ed.), 12. Ernährungsbericht 2012 (pp. 86–97). Deutsche Gesellschaft für Ernährung (DGE) [Google Scholar]
- Hindborg H (DTU Food National Institute) . (2015). Unpublished. Dietary supplements may contribute to an adequate micronutrient intake in Danish adults but increase the risk of overdose in children.
- Idjradinata, P. , & Pollitt, E. (1993). Reversal of developmental delays in iron‐deficient anaemic infants treated with iron. Lancet, 341, 1–4. 10.1016/0140-6736(93)92477-b [DOI] [PubMed] [Google Scholar]
- Idjradinata, P. , Watkins, W. E. , & Pollitt, E. (1994). Adverse effect of iron supplementation on weight gain of iron‐replete young children. Lancet, 343, 1252–1254. 10.1016/s0140-6736(94)92151-2 [DOI] [PubMed] [Google Scholar]
- IOM (Institute of Medicine, Food and Nutrition Board) . (2001). Dietary reference intakes for vitamin a, vitamin K, arsenic, boron, chromium, copper, iodine, iron, manganese, molybdenum, nickel, silicon, vanadium, and zinc: A report of the panel on micronutrients. Press NA. [Google Scholar]
- Iqbal, S. , & Ekmekcioglu, C. (2019). Maternal and neonatal outcomes related to iron supplementation or iron status: A summary of meta‐analyses. The Journal of Maternal‐Fetal & Neonatal Medicine, 32, 1528–1540. 10.1080/14767058.2017.1406915 [DOI] [PubMed] [Google Scholar]
- Jaeggi, T. , Kortman, G. A. M. , Moretti, D. , Chassard, C. , Holding, P. , Dostal, A. , Boekhorst, J. , Timmerman, H. M. , Swinkels, D. W. , Tjalsma, H. , Njenga, J. , Mwangi, A. , Kvalsvig, J. , Lacroix, C. , & Zimmermann, M. B. (2015). Iron fortification adversely affects the gut microbiome, increases pathogen abundance and induces intestinal inflammation in Kenyan infants. Gut, 64, 731–742. 10.1136/gutjnl-2014-307720 [DOI] [PubMed] [Google Scholar]
- Jakszyn, P. , Lujan‐Barroso, L. , Agudo, A. , Bueno‐de‐Mesquita, H. B. , Molina, E. , Sanchez, M. J. , Fonseca‐Nunes, A. , Siersema, P. D. , Matiello, A. , Tumino, R. , Saieva, C. , Pala, V. , Vineis, P. , Boutron‐Ruault, M. C. , Racine, A. , Bastide, N. , Travis, R. C. , Khaw, K. T. , Riboli, E. , … Gonzalez, C. A. (2013). Meat and heme iron intake and esophageal adenocarcinoma in the European prospective investigation into cancer and nutrition study. International Journal of Cancer, 133, 2744–2750. 10.1002/ijc.28291 [DOI] [PubMed] [Google Scholar]
- Jayasinghe, C. , Polson, R. , van Woerden, H. C. , & Wilson, P. (2018). The effect of universal maternal antenatal iron supplementation on neurodevelopment in offspring: A systematic review and meta‐analysis. BMC Pediatrics, 18, 150. 10.1186/s12887-018-1118-7 [DOI] [PMC free article] [PubMed] [Google Scholar]
- JECFA (Joint FAO/WHO Expert Committee on Food Additives) . (1983). Evaluation of certain food additives and contaminants. WHO Technical Report Series 696. sWHO. https://iris.who.int/bitstream/handle/10665/39165/WHO_TRS_696.pdf?sequence=1 [PubMed] [Google Scholar]
- Ji, H. , & Yardley, J. H. (2004). Iron medication‐associated gastric mucosal injury. Archives of Pathology and Laboratory Medicine, 128, 821–822. 10.5858/2004-128-821-imgmi [DOI] [PubMed] [Google Scholar]
- Jiang, R. , Ma, J. , Ascherio, A. , Stampfer, M. J. , Willett, W. C. , & Hu, F. B. (2004). Dietary iron intake and blood donations in relation to risk of type 2 diabetes in men: A prospective cohort study. American Journal of Clinical Nutrition, 79, 70–75. [DOI] [PubMed] [Google Scholar]
- Jiao, J. , Guo, H. , He, Y. , Wang, J. , Yuan, J. , & Hu, W. (2016). Meta‐analysis of the association between serum iron levels and Parkinson's disease: Evidence from 11 publications. Brain Research, 1646, 490–493. 10.1016/j.brainres.2016.06.044 [DOI] [PubMed] [Google Scholar]
- Jiménez‐Jiménez, F. J. , Alonso‐Navarro, H. , García‐Martín, E. , & Agúndez, J. A. G. (2021). Biological fluid levels of iron and iron‐related proteins in Parkinson's disease: Review and meta‐analysis. European Journal of Neurology, 28, 1041–1055. 10.1111/ene.14607 [DOI] [PubMed] [Google Scholar]
- Jung, D. H. , Hong, K. W. , Park, B. , & Lee, Y. J. (2021). Dietary iron to total energy intake ratio and type 2 diabetes incidence in a longitudinal 12‐year analysis of the Korean genome and epidemiology cohort study. European Journal of Nutrition, 60, 4453–4461. 10.1007/s00394-021-02596-y [DOI] [PubMed] [Google Scholar]
- Kataria, Y. , Wu, Y. X. , Horskjaer, P. D. , Mandrup‐Poulsen, T. , & Ellervik, C. (2018). Iron status and gestational diabetes: A meta‐analysis. Nutrients, 10(5), 621. 10.3390/nu10050621 [DOI] [PMC free article] [PubMed] [Google Scholar]
- Kaye, P. , Abdulla, K. , Wood, J. , James, P. , Foley, S. , Ragunath, K. , & Atherton, J. (2008). Iron‐induced mucosal pathology of the upper gastrointestinal tract: A common finding in patients on oral iron therapy. Histopathology, 53, 311–317. 10.1111/j.1365-2559.2008.03081.x [DOI] [PubMed] [Google Scholar]
- Kehoe, L. , & Walton, J. (2022). Report on the intake of micronutrients (vitamin A, β‐carotene, retinol, vitamin D, vitamin E, vitamin B6, folic acid, iron and manganese) from food supplements in the Irish population (p. 7). Department of Biological Sciences, Munster Technological University, Report commissioned by the Food Safety Authority of Ireland. [Google Scholar]
- Kew, M. C. (2014). Hepatic iron overload and hepatocellular carcinoma. Liver Cancer, 3, 31–40. 10.1159/000343856 [DOI] [PMC free article] [PubMed] [Google Scholar]
- Kew, M. C. , & Asare, G. A. (2007). Dietary iron overload in the African and hepatocellular carcinoma. Liver International, 27, 735–741. 10.1111/j.1478-3231.2007.01515.x [DOI] [PubMed] [Google Scholar]
- Kim, J. , Kim, M. K. , Jung, S. , Lim, J. E. , Shin, M. H. , Kim, Y. J. , & Oh, B. (2017). Interaction of iron status with single nucleotide polymorphisms on incidence of type 2 diabetes. PLoS One, 12, e0175681. 10.1371/journal.pone.0175681 [DOI] [PMC free article] [PubMed] [Google Scholar]
- Kundrapu, S. , & Noguez, J. (2018). Chapter six ‐ laboratory assessment of anemia. In Makowski G. S. (Ed.), Advances in clinical chemistry (pp. 197–225). Elsevier. [DOI] [PubMed] [Google Scholar]
- Laine, L. A. , Bentley, E. , & Chandrasoma, P. (1988). Effect of oral iron therapy on the upper gastrointestinal tract. A prospective evaluation. Digestive Diseases and Sciences, 33, 172–177. 10.1007/bf01535729 [DOI] [PubMed] [Google Scholar]
- Lands, R. , & Isang, E. (2017). Secondary hemochromatosis due to chronic oral iron supplementation. Case Reports in Hematology, 2017, 2494167. 10.1155/2017/2494167 [DOI] [PMC free article] [PubMed] [Google Scholar]
- Lane, D. J. , Bae, D. H. , Merlot, A. M. , Sahni, S. , & Richardson, D. R. (2015). Duodenal cytochrome b (DCYTB) in iron metabolism: An update on function and regulation. Nutrients, 7, 2274–2296. 10.3390/nu7042274 [DOI] [PMC free article] [PubMed] [Google Scholar]
- Lee, D. H. , Folsom, A. R. , & Jacobs, D. R. (2004). Dietary iron intake and type 2 diabetes incidence in postmenopausal women: The Iowa Women's health study. Diabetologia, 47, 185–194. 10.1007/s00125-003-1307-1 [DOI] [PubMed] [Google Scholar]
- Li, M. , Wu, J. , Ren, T. , Wang, R. , Li, W. , Piao, J. , Wang, J. , & Yang, X. (2015). Effect of NaFeEDTA‐fortified soy sauce on zinc absorption in children. Food & Function, 6, 788–792. 10.1039/c4fo00722k [DOI] [PubMed] [Google Scholar]
- Li, S. Y. , Wang, F. , Lu, X. T. , Zhong, R. H. , Long, J. A. , Fang, A. P. , & Zhu, H. L. (2021). Dietary iron intake and the risk of type 2 diabetes mellitus in middle‐aged and older adults in urban China: A prospective cohort study. British Journal of Nutrition, 126, 1091–1099. 10.1017/S0007114520005048 [DOI] [PubMed] [Google Scholar]
- Liguori, L. (1993). Iron protein succinylate in the treatment of iron deficiency: Controlled, double‐blind, multicenter clinical trial on over 1,000 patients. International Journal of Clinical Pharmacology, Therapy, and Toxicology, 31, 103–123. [PubMed] [Google Scholar]
- Lind, T. , Seswandhana, R. , Persson, L. A. , & Lonnerdal, B. (2008). Iron supplementation of iron‐replete Indonesian infants is associated with reduced weight‐for‐age. Acta Paediatrica, 97, 770–775. 10.1111/j.1651-2227.2008.00773.x [DOI] [PubMed] [Google Scholar]
- Liu, X. N. , & Pang, J. (2018). A retrospective study of supplemental iron intake in singleton pregnancy women with risk of developing gestational diabetes mellitus. Medicine, 97, e10819. 10.1097/md.0000000000010819 [DOI] [PMC free article] [PubMed] [Google Scholar]
- Lökken, P. , & Birkeland, J. M. (1979). Dental discolorations and side effects with iron and placebo tablets. Scandinavian Journal of Dental Research, 87, 275–278. 10.1111/j.1600-0722.1979.tb00682.x [DOI] [PubMed] [Google Scholar]
- Lönnerdal, B. (2017). Excess iron intake as a factor in growth, infections, and development of infants and young children. American Journal of Clinical Nutrition, 106, 1681S–1687S. 10.3945/ajcn.117.156042 [DOI] [PMC free article] [PubMed] [Google Scholar]
- Lönnerdal, B. , Georgieff, M. K. , & Hernell, O. (2015). Developmental physiology of iron absorption, homeostasis, and metabolism in the healthy term infant. Journal of Pediatrics, 167, S8–S14. 10.1016/j.jpeds.2015.07.014 [DOI] [PMC free article] [PubMed] [Google Scholar]
- Lopes da Silva, S. , Vellas, B. , Elemans, S. , Luchsinger, J. , Kamphuis, P. , Yaffe, K. , Sijben, J. , Groenendijk, M. , & Stijnen, T. (2014). Plasma nutrient status of patients with Alzheimer's disease: Systematic review and meta‐analysis. Alzheimers Dement, 10, 485–502. 10.1016/j.jalz.2013.05.1771 [DOI] [PubMed] [Google Scholar]
- Lozoff, B. , Castillo, M. , Clark, K. M. , & Smith, J. B. (2012). Iron‐fortified vs low‐iron infant formula: Developmental outcome at 10 years. Archives of Pediatrics & Adolescent Medicine, 166, 208–215. 10.1001/archpediatrics.2011.197 [DOI] [PMC free article] [PubMed] [Google Scholar]
- Lozoff, B. , De Andraca, I. , Castillo, M. , Smith, J. B. , Walter, T. , & Pino, P. (2003). Behavioral and developmental effects of preventing iron‐deficiency anemia in healthy full‐term infants. Pediatrics, 112, 846–854. [PubMed] [Google Scholar]
- Lund, E. K. , Wharf, S. G. , Fairweather‐Tait, S. J. , & Johnson, I. (1999). Oral ferrous sulfate supplements increase the free radical‐generating capacity of feces from healthy volunteers. American Journal of Clinical Nutrition, 69, 250–255. [DOI] [PubMed] [Google Scholar]
- Ma, J. F. , Li, Q. W. , Fang, X. X. , Chen, L. Y. , Qiang, Y. Z. , Wang, J. Y. , Wang, Q. Q. , Min, J. X. , Zhang, S. S. , & Wang, F. D. (2018). Increased total iron and zinc intake and lower heme iron intake reduce the risk of esophageal cancer: A dose‐response meta‐analysis. Nutrition Research, 59, 16–28. 10.1016/j.nutres.2018.07.007 [DOI] [PubMed] [Google Scholar]
- MacPhail, A. P. , Mandishona, E. M. , Bloom, P. D. , Paterson, A. C. , Rouault, T. A. , & Gordeuk, V. R. (1999). Measurements of iron status and survival in African iron overload. South African Medical Journal, 89, 966–972. [PubMed] [Google Scholar]
- Mahalhal, A. , Williams, J. M. , Johnson, S. , Ellaby, N. , Duckworth, C. A. , Burkitt, M. D. , Liu, X. , Hold, G. L. , Campbell, B. J. , Pritchard, D. M. , & Probert, C. S. (2018). Oral iron exacerbates colitis and influences the intestinal microbiome. PLoS One, 13, e0202460. 10.1371/journal.pone.0202460 [DOI] [PMC free article] [PubMed] [Google Scholar]
- Majumdar, I. , Paul, P. , Talib, V. H. , & Ranga, S. (2003). The effect of iron therapy on the growth of iron‐replete and iron‐deplete children. Journal of Tropical Pediatrics, 49, 84–88. 10.1093/tropej/49.2.84 [DOI] [PubMed] [Google Scholar]
- Makrides, M. , Crowther, C. A. , Gibson, R. A. , Gibson, R. S. , & Skeaff, C. M. (2003). Efficacy and tolerability of low‐dose iron supplements during pregnancy: A randomized controlled trial. The American Journal of Clinical Nutrition, 78, 145–153. 10.1093/ajcn/78.1.145 [DOI] [PubMed] [Google Scholar]
- Marginean, E. C. , Bennick, M. , Cyczk, J. , Robert, M. E. , & Jain, D. (2006). Gastric siderosis: Patterns and significance. American Journal of Surgical Pathology, 30, 514–520. 10.1097/00000478-200604000-00013 [DOI] [PubMed] [Google Scholar]
- Marí‐Sanchis, A. , Díaz‐Jurado, G. , Basterra‐Gortari, F. J. , de la Fuente‐Arrillaga, C. , Martínez‐González, M. A. , & Bes‐Rastrollo, M. (2018). Association between pre‐pregnancy consumption of meat, iron intake, and the risk of gestational diabetes: The SUN project. European Journal of Nutrition, 57, 939–949. 10.1007/s00394-017-1377-3 [DOI] [PubMed] [Google Scholar]
- McKenna, D. , Spence, D. , Haggan, S. E. , McCrum, E. , Dornan, J. C. , & Lappin, T. R. (2003). A randomized trial investigating an iron‐rich natural mineral water as a prophylaxis against iron deficiency in pregnancy. Clinical and Laboratory Haematology, 25, 99–103. 10.1046/j.1365-2257.2003.00501.x [DOI] [PubMed] [Google Scholar]
- McKie, A. T. , Barrow, D. , Latunde‐Dada, G. O. , Rolfs, A. , Sager, G. , Mudaly, E. , Mudaly, M. , Richardson, C. , Barlow, D. , Bomford, A. , Peters, T. J. , Raja, K. B. , Shirali, S. , Hediger, M. A. , Farzaneh, F. , & Simpson, R. J. (2001). An iron‐regulated ferric reductase associated with the absorption of dietary iron. Science, 291, 1755–1759. 10.1126/science.1057206 [DOI] [PubMed] [Google Scholar]
- Milman, N. (2011). Iron in pregnancy: How do we secure an appropriate iron status in the mother and child? Annals of Nutrition and Metabolism, 59, 50–54. 10.1159/000332129 [DOI] [PubMed] [Google Scholar]
- Milman, N. , Byg, K. E. , Bergholt, T. , & Eriksen, L. (2006). Side effects of oral iron prophylaxis in pregnancy–myth or reality? Acta Haematologica, 115, 53–57. 10.1159/000089466 [DOI] [PubMed] [Google Scholar]
- Milman, N. , Jønsson, L. , Dyre, P. , Pedersen, P. L. , & Larsen, L. G. (2014). Ferrous bisglycinate 25 mg iron is as effective as ferrous sulfate 50 mg iron in the prophylaxis of iron deficiency and anemia during pregnancy in a randomized trial. Journal of Perinatal Medicine, 42, 197–206. 10.1515/jpm-2013-0153 [DOI] [PubMed] [Google Scholar]
- Miranda, V. I. A. , Pizzol, T. , Jesus, P. R. , Silveira, M. P. T. , & Bertoldi, A. D. (2022). Iron salts, high levels of hemoglobin and ferritin in pregnancy, and development of gestational diabetes: A systematic review. Revista Brasileira de Ginecologia e Obstetrícia, 44, 1059–1069. 10.1055/s-0042-1755460 [DOI] [PMC free article] [PubMed] [Google Scholar]
- Montalbetti, N. , Simonin, A. , Kovacs, G. , & Hediger, M. A. (2013). Mammalian iron transporters: Families SLC11 and SLC40. Molecular Aspects of Medicine, 34, 270–287. 10.1016/j.mam.2013.01.002 [DOI] [PubMed] [Google Scholar]
- Mostile, G. , Cicero, C. E. , Giuliano, L. , Zappia, M. , & Nicoletti, A. (2017). Iron and Parkinson's disease: A systematic review and meta‐analysis. Molecular Medicine Reports, 15, 3383–3389. 10.3892/mmr.2017.6386 [DOI] [PubMed] [Google Scholar]
- Muñoz, M. , García‐Erce, J. A. , & Remacha, Á. F. (2011). Disorders of iron metabolism. Part II: Iron deficiency and iron overload. Journal of Clinical Pathology, 64, 287–296. 10.1136/jcp.2010.086991 [DOI] [PubMed] [Google Scholar]
- NHMRC (National Health and Medical Research Council) , 2006. Nutrient reference values for Australia and New Zealand including recommended dietary intakes. 1864962437. . [Google Scholar]
- Nordic Council of Ministers (Nordic Nutrition Recommendations) . (2014). Nordic nutrition recommendations 2012. Integrating Nutrition and Physical Activity, 629. [Google Scholar]
- O'Brien, K. O. , Zavaleta, N. , Caulfield, L. E. , Wen, J. P. , & Abrams, S. A. (2000). Prenatal iron supplements impair zinc absorption in pregnant Peruvian women. Journal of Nutrition, 130, 2251–2255. 10.1093/jn/130.9.2251 [DOI] [PubMed] [Google Scholar]
- Oh, C. K. , & Moon, Y. (2019). Dietary and sentinel factors leading to hemochromatosis. Nutrients, 11(5), 1047. 10.3390/nu11051047 [DOI] [PMC free article] [PubMed] [Google Scholar]
- OHAT/NTP (Office of Health Assessment and Translation, Division of the National Toxicology Program) . (2015). OHAT risk of bias rating tool for human and animal studies (p. 37). https://ntp.niehs.nih.gov/ntp/ohat/pubs/riskofbiastool_508.pdf [Google Scholar]
- OHAT/NTP (Office of Health Assessment and Translation, Division of the National Toxicology Program) . (2019). Handbook for conducting a literature‐based health assessment using OHAT approach for systematic review and evidence integration (p. 102). https://ntp.niehs.nih.gov/ntp/ohat/pubs/handbookmarch2019_508.pdf [Google Scholar]
- Olynyk, J. K. , & Ramm, G. A. (2022). Hemochromatosis. The New England Journal of Medicine, 387, 2159–2170. 10.1056/NEJMra2119758 [DOI] [PubMed] [Google Scholar]
- Orozco, M. N. , Arriaga, C. , Solomons, N. W. , & Schümann, K. (2012). Equivalent effects on fecal reactive oxygen species generation with oral supplementation of three iron compounds: Ferrous sulfate, sodium iron EDTA and iron polymaltose. Annals of Nutrition and Metabolism, 60, 108–114. 10.1159/000336181 [DOI] [PubMed] [Google Scholar]
- Ouladsahebmadarek, E. , Sayyah‐Melli, M. , Taghavi, S. , Abbasalizadeh, S. , & Seyedhejazie, M. (2011). The effect of supplemental iron elimination on pregnancy outcome. Pakistan Journal of Medical Sciences, 27, 641–645. [Google Scholar]
- Paganini, D. , Uyoga, M. A. , Kortman, G. A. M. , Cercamondi, C. I. , Moretti, D. , Barth‐Jaeggi, T. , Schwab, C. , Boekhorst, J. , Timmerman, H. M. , Lacroix, C. , Karanja, S. , & Zimmermann, M. B. (2017). Prebiotic galacto‐oligosaccharides mitigate the adverse effects of iron fortification on the gut microbiome: A randomised controlled study in Kenyan infants. Gut, 66, 1956–1967. 10.1136/gutjnl-2017-314418 [DOI] [PubMed] [Google Scholar]
- Paganini, D. , & Zimmermann, M. B. (2017). The effects of iron fortification and supplementation on the gut microbiome and diarrhea in infants and children: A review. American Journal of Clinical Nutrition, 106, 1688S–1693S. 10.3945/ajcn.117.156067 [DOI] [PMC free article] [PubMed] [Google Scholar]
- Parfitt, J. R. , & Driman, D. K. (2007). Pathological effects of drugs on the gastrointestinal tract: A review. Human Pathology, 38, 527–536. 10.1016/j.humpath.2007.01.014 [DOI] [PubMed] [Google Scholar]
- Parisi, F. , Berti, C. , Mandò, C. , Martinelli, A. , Mazzali, C. , & Cetin, I. (2017). Effects of different regimens of iron prophylaxis on maternal iron status and pregnancy outcome: A randomized control trial. The Journal of Maternal‐Fetal & Neonatal Medicine, 30, 1787–1792. 10.1080/14767058.2016.1224841 [DOI] [PubMed] [Google Scholar]
- Parlesak, A. , Masino, T. T. , Rei, K. D. , Filskov Petersen, C. , Christensen, J. J. , Olsen, T. , & Tetens, I. (2024). Preparatory work for the update of the tolerable upper intake levels for iron. EFSA Supporting Publications, EN‐8661. 10.2903/sp.efsa.2024.EN-8661 [DOI] [Google Scholar]
- Pasricha, S. R. , Hayes, E. , Kalumba, K. , & Biggs, B. A. (2013). Effect of daily iron supplementation on health in children aged 4–23 months: A systematic review and meta‐analysis of randomised controlled trials. The Lancet Global Health, 1, E77–E86. 10.1016/s2214-109x(13)70046-9 [DOI] [PubMed] [Google Scholar]
- Pereira, D. I. , Couto Irving, S. S. , Lomer, M. C. , & Powell, J. J. (2014). A rapid, simple questionnaire to assess gastrointestinal symptoms after oral ferrous sulphate supplementation. BMC Gastroenterology, 14, 103. 10.1186/1471-230x-14-103 [DOI] [PMC free article] [PubMed] [Google Scholar]
- Perlitz, H. , Mensink, G. B. M. , Lage Barbosa, C. , Richter, A. , Brettschneider, A. K. , Lehmann, F. , Patelakis, E. , Frank, M. , Heide, K. , & Haftenberger, M. (2019). Use of vitamin and mineral supplements among adolescents living in Germany‐results from EsKiMo II. Nutrients, 11(6), 1208. 10.3390/nu11061208 [DOI] [PMC free article] [PubMed] [Google Scholar]
- Petry, C. J. (2022). Iron supplementation in pregnancy and risk of gestational diabetes: A narrative review. Nutrients, 14(22), 4791. 10.3390/nu14224791 [DOI] [PMC free article] [PubMed] [Google Scholar]
- Piskin, E. , Cianciosi, D. , Gulec, S. , Tomas, M. , & Capanoglu, E. (2022). Iron absorption: Factors, limitations, and improvement methods. ACS Omega, 7, 20441–20456. 10.1021/acsomega.2c01833 [DOI] [PMC free article] [PubMed] [Google Scholar]
- Pizarro, F. , Olivares, M. , Hertrampf, E. , Mazariegos, D. I. , & Arredondo, M. (2003). Research communication: Heme‐iron absorption is saturable by heme‐iron dose in women. The Journal of Nutrition, 133, 2214–2217. 10.1093/jn/133.7.2214 [DOI] [PubMed] [Google Scholar]
- Quezada‐Pinedo, H. G. , Cassel, F. , Duijts, L. , Muckenthaler, M. U. , Gassmann, M. , Jaddoe, V. W. V. , Reiss, I. K. M. , & Vermeulen, M. J. (2021). Maternal iron status in pregnancy and child health outcomes after birth: A systematic review and meta‐analysis. Nutrients, 13(7), 2221. 10.3390/nu13072221 [DOI] [PMC free article] [PubMed] [Google Scholar]
- Rajpathak, S. , Ma, J. , Manson, J. , Willett, W. C. , & Hu, F. B. (2006). Iron intake and the risk of type 2 diabetes in women ‐ a prospective cohort study. Diabetes Care, 29, 1370–1376. 10.2337/dc06-0119 [DOI] [PubMed] [Google Scholar]
- Rasmussen, S. E. , Andersen, N. L. , Dragsted, L. O. , & Larsen, J. C. (2006). A safe strategy for addition of vitamins and minerals to foods. European Journal of Nutrition, 45, 123–135. 10.1007/s00394-005-0580-9 [DOI] [PubMed] [Google Scholar]
- Ravanfar, P. , Loi, S. M. , Syeda, W. T. , Van Rheenen, T. E. , Bush, A. I. , Desmond, P. , Cropley, V. L. , Lane, D. J. R. , Opazo, C. M. , Moffat, B. A. , Velakoulis, D. , & Pantelis, C. (2021). Systematic review: Quantitative susceptibility mapping (QSM) of brain iron profile in neurodegenerative diseases. Frontiers in Neuroscience, 15, 618435. 10.3389/fnins.2021.618435 [DOI] [PMC free article] [PubMed] [Google Scholar]
- Reeves, J. D. , & Yip, R. (1985). Lack of adverse side effects of oral ferrous sulfate therapy in 1‐year‐old infants. Pediatrics, 75, 352–355. [PubMed] [Google Scholar]
- Restrepo‐Gallego, M. , Díaz, L. E. , & Rondó, P. H. C. (2021). Classic and emergent indicators for the assessment of human iron status. Critical Reviews in Food Science and Nutrition, 61, 2827–2840. 10.1080/10408398.2020.1787326 [DOI] [PubMed] [Google Scholar]
- Richardson, D. R. , Lane, D. J. R. , Becker, E. M. , Huang, M. L.‐H. , Whitnall, M. , Rahmanto, Y. S. , Sheftel, A. D. , & Ponka, P. (2010). Mitochondrial iron trafficking and the integration of iron metabolism between the mitochondrion and cytosol. Proceedings of the National Academy of Sciences, 107, 10775–10782. 10.1073/pnas.0912925107 [DOI] [PMC free article] [PubMed] [Google Scholar]
- Roe, M. A. , Bell, S. , Oseredczuk, M. , Christensen, T. , Westenbrink, S. , Pakkala, H. , Presser, K. , Finglas, P. M. , & Consortium E . (2013). Updated food composition database for nutrient intake. EFSA Supporting Publications, 10(6), EN‐355. 10.2903/sp.efsa.2013.EN-355 [DOI] [Google Scholar]
- Rosenberg, D. W. , & Kappas, A. (1989). Characterization of heme oxygenase in the small intestinal epithelium. Archives of Biochemistry and Biophysics, 274, 471–480. 10.1016/0003-9861(89)90460-8 [DOI] [PubMed] [Google Scholar]
- Ruz, M. , Codoceo, J. , Rebolledo, A. , Vasquez, M. , Krebs, N. , Sian, L. , Westcott, J. , & Hambidge, K. M. (2002). The use of zinc stable isotopes in the study of iron‐zinc interactions in Chilean women. Food and Nutrition Bulletin, 23, 209–212. 10.1177/15648265020233 [DOI] [PubMed] [Google Scholar]
- Saito, H. (2014). Metabolism of iron stores. Nagoya Journal of Medical Science, 76, 235–254. [PMC free article] [PubMed] [Google Scholar]
- Sandström, B. , Davidsson, L. , Cederblad, A. , & Lönnerdal, B. (1985). Oral iron, dietary ligands and zinc absorption. Journal of Nutrition, 115, 411–414. 10.1093/jn/115.3.411 [DOI] [PubMed] [Google Scholar]
- Scarpignato, C. , & Bjarnason, I. (2019). Drug‐induced small bowel injury: A challenging and often forgotten clinical condition. Current Gastroenterology Reports, 21, 55. 10.1007/s11894-019-0726-1 [DOI] [PubMed] [Google Scholar]
- SCF (Scientific Committee on Food) . (2000). Opinion of the scientific committee on food on the tolerable upper intake level of iron (p. 15). [Google Scholar]
- Seril, D. N. , Liao, J. , Ho, K. L. , Warsi, A. , Yang, C. S. , & Yang, G. Y. (2002). Dietary iron supplementation enhances DSS‐induced colitis and associated colorectal carcinoma development in mice. Digestive Diseases and Sciences, 47, 1266–1278. 10.1023/a:1015362228659 [DOI] [PubMed] [Google Scholar]
- Shahinfar, H. , Jayedi, A. , & Shab‐Bidar, S. (2022). Dietary iron intake and the risk of type 2 diabetes: A systematic review and dose–response meta‐analysis of prospective cohort studies. European Journal of Nutrition, 61, 2279–2296. 10.1007/s00394-022-02813-2 [DOI] [PubMed] [Google Scholar]
- Sharp, P. , & Srai, S. K. (2007). Molecular mechanisms involved in intestinal iron absorption. World Journal of Gastroenterology, 13, 4716–4724. 10.3748/wjg.v13.i35.4716 [DOI] [PMC free article] [PubMed] [Google Scholar]
- Shastri, L. , Mishra, P. E. , Dwarkanath, P. , Thomas, T. , Duggan, C. , Bosch, R. , McDonald, C. M. , Thomas, A. , & Kurpad, A. V. (2015). Association of oral iron supplementation with birth outcomes in non‐anaemic south Indian pregnant women. European Journal of Clinical Nutrition, 69, 609–613. 10.1038/ejcn.2014.248 [DOI] [PubMed] [Google Scholar]
- Shayeghi, M. , Latunde‐Dada, G. O. , Oakhill, J. S. , Laftah, A. H. , Takeuchi, K. , Halliday, N. , Khan, Y. , Warley, A. , McCann, F. E. , Hider, R. C. , Frazer, D. M. , Anderson, G. J. , Vulpe, C. D. , Simpson, R. J. , & McKie, A. T. (2005). Identification of an intestinal heme transporter. Cell, 122, 789–801. 10.1016/j.cell.2005.06.025 [DOI] [PubMed] [Google Scholar]
- Simonyté Sjödin, K. , Domellöf, M. , Lagerqvist, C. , Hernell, O. , Lönnerdal, B. , Szymlek‐Gay, E. A. , Sjödin, A. , West, C. E. , & Lind, T. (2019). Administration of ferrous sulfate drops has significant effects on the gut microbiota of iron‐sufficient infants: A randomised controlled study. Gut, 68, 2095–2097. 10.1136/gutjnl-2018-316988 [DOI] [PMC free article] [PubMed] [Google Scholar]
- Singh, N. , Haldar, S. , Tripathi, A. K. , Horback, K. , Wong, J. , Sharma, D. , Beserra, A. , Suda, S. , Anbalagan, C. , Dev, S. , Mukhopadhyay, C. K. , & Singh, A. (2014). Brain iron homeostasis: From molecular mechanisms to clinical significance and therapeutic opportunities. Antioxidants and Redox Signaling, 20, 1324–1363. 10.1089/ars.2012.4931 [DOI] [PMC free article] [PubMed] [Google Scholar]
- Song, Y. , Buring, J. E. , Manson, J. E. , & Liu, S. M. (2004). A prospective study of red meat consumption and type 2 diabetes in middle‐aged and elderly women. Diabetes Care, 27, 2108–2115. 10.2337/diacare.27.9.2108 [DOI] [PubMed] [Google Scholar]
- Státní zdravotní ústav , 2021. Systém monitorování zdravotního stavu obyvatelstva ČR ve vztahu k životnímu prostředí, Subsystém IV, Zdravotní důsledky zátěže lidského organismu cizorodými látkami z potravinových řetězců, dietární expozice. 51 pp. Státní zdravotní ústav, Prague, Czech Republic. [Google Scholar]
- Stos, K. , Wozniak, A. , Rychlik, E. , Ziolkowska, I. , Glowala, A. , & Oltarzewski, M. (2021). Assessment of food supplement consumption in polish population of adults. Frontiers in Nutrition, 8, 733951. 10.3389/fnut.2021.733951 [DOI] [PMC free article] [PubMed] [Google Scholar]
- Szymlek‐Gay, E. A. , Domellof, M. , Hernell, O. , Hurrell, R. F. , Lind, T. , Lonnerdal, B. , Zeder, C. , & Egli, I. M. (2016). Mode of oral iron administration and the amount of iron habitually consumed do not affect iron absorption, systemic iron utilisation or zinc absorption in iron‐sufficient infants: A randomised trial. British Journal of Nutrition, 116, 1046–1060. 10.1017/s0007114516003032 [DOI] [PubMed] [Google Scholar]
- Tandara, L. , & Salamunic, I. (2012). Iron metabolism: Current facts and future directions. Biochemia Medica (Zagreb), 22, 311–328. 10.11613/bm.2012.034 [DOI] [PMC free article] [PubMed] [Google Scholar]
- Tao, Y. , Wang, Y. , Rogers, J. T. , & Wang, F. (2014). Perturbed iron distribution in Alzheimer's disease serum, cerebrospinal fluid, and selected brain regions: A systematic review and meta‐analysis. Journal of Alzheimer's Disease, 42, 679–690. 10.3233/JAD-140396 [DOI] [PubMed] [Google Scholar]
- Tiekou Lorinczova, H. , Begum, G. , Temouri, L. , Renshaw, D. , & Zariwala, M. G. (2022). Co‐administration of iron and bioavailable curcumin reduces levels of systemic markers of inflammation and oxidative stress in a placebo‐controlled randomised study. Nutrients, 14(3), 712. 10.3390/nu14030712 [DOI] [PMC free article] [PubMed] [Google Scholar]
- Tolkien, Z. , Stecher, L. , Mander, A. P. , Pereira, D. I. , & Powell, J. J. (2015). Ferrous sulfate supplementation causes significant gastrointestinal side‐effects in adults: A systematic review and meta‐analysis. PLoS One, 10, e0117383. 10.1371/journal.pone.0117383 [DOI] [PMC free article] [PubMed] [Google Scholar]
- Totland TH, Melnæs BK, Lundberg‐Hallén N, Helland‐Kigen KM, Lund‐Blix NA, Myhre JB, Wetting Johansen AM, Løken EB and Andersen LF (Universitetet i Oslo, Mattilsynet og Helsedirektoratet), 2012. Norkost 3 En landsomfattende kostholdsundersøkelse blant menn og kvinner i Norge i alderen 18–70 år, 2010–11. [Google Scholar]
- Troost, F. J. , Brummer, R.‐J. M. , Dainty, J. R. , Hoogewerff, J. A. , Bull, V. J. , & Saris, W. H. M. (2003). Iron supplements inhibit zinc but not copper absorption in vivo in ileostomy subjects. The American Journal of Clinical Nutrition, 78, 1018–1023. 10.1093/ajcn/78.5.1018 [DOI] [PubMed] [Google Scholar]
- Umbreit, J. N. , Conrad, M. E. , Moore, E. G. , & Latour, L. F. (1998). Iron absorption and cellular transport: The mobilferrin/paraferritin paradigm. Seminars in Hematology, 35, 13–26. [PubMed] [Google Scholar]
- Valberg, L. S. , Flanagan, P. R. , & Chamberlain, M. J. (1984). Effects of iron, tin, and copper on zinc absorption in humans. The American Journal of Clinical Nutrition, 40, 536–541. 10.1093/ajcn/40.3.536 [DOI] [PubMed] [Google Scholar]
- Valenti, L. , Corradini, E. , Adams, L. A. , Aigner, E. , Alqahtani, S. , Arrese, M. , Bardou‐Jacquet, E. , Bugianesi, E. , Fernandez‐Real, J.‐M. , Girelli, D. , Hagström, H. , Henninger, B. , Kowdley, K. , Ligabue, G. , McClain, D. , Lainé, F. , Miyanishi, K. , Muckenthaler, M. U. , Pagani, A. , … Zoller, H. (2023). Consensus statement on the definition and classification of metabolic hyperferritinaemia. Nature Reviews Endocrinology, 19, 299–310. 10.1038/s41574-023-00807-6 [DOI] [PMC free article] [PubMed] [Google Scholar]
- Valsta, L. , Kaartinen, N. , Tapanainen, H. , Männistö, S. , & Sääksjärvi, K. (National Institute for Health and Welfare). (2018). Nutrition in Finland: The National FinDiet 2017 Survey.
- van de Vijver, L. P. , Kardinaal, A. F. , Charzewska, J. , Rotily, M. , Charles, P. , Maggiolini, M. , Ando, S. , Väänänen, K. , Wajszczyk, B. , Heikkinen, J. , Deloraine, A. , & Schaafsma, G. (1999). Calcium intake is weakly but consistently negatively associated with iron status in girls and women in six European countries. The Journal of Nutrition, 129, 963–968. 10.1093/jn/129.5.963 [DOI] [PubMed] [Google Scholar]
- Van Rossum, C. T. M. , Buurma‐Rethans, E. J. M. , Dinnissen, C. S. , Beukers, M. H. , Brants, H. A. M. , Dekkers, A. L. M. , & Ocké, M. C. (National Institute for Public Health and the Environment). (2022). Intake and frequency of use of dietary supplements in The Netherlands. The diet of the Dutch. Results of the Dutch National Food Consumption Survey 2012–2016. RIVM. [Google Scholar]
- VKM (Norwegian Scientific Committee for Food Safety) . (2017). Assessment of iron intake in relation to tolerable upper intake levels. In Opinion of the panel on nutrition, dietetic products, novel food and allergy (Vol. 5, p. 28). Norwegian Scientific Committee for Food Safety. VKM Report 2017. [Google Scholar]
- Walters, G. O. , Miller, F. M. , & Worwood, M. (1973). Serum ferritin concentration and iron stores in normal subjects. Journal of Clinical Pathology, 26, 770–772. [DOI] [PMC free article] [PubMed] [Google Scholar]
- Werner, T. , Wagner, S. J. , Martínez, I. , Walter, J. , Chang, J. S. , Clavel, T. , Kisling, S. , Schuemann, K. , & Haller, D. (2011). Depletion of luminal iron alters the gut microbiota and prevents Crohn's disease‐like ileitis. Gut, 60, 325–333. 10.1136/gut.2010.216929 [DOI] [PubMed] [Google Scholar]
- Wessling‐Resnick, M. (2017). Excess iron: Considerations related to development and early growth. American Journal of Clinical Nutrition, 106, 1600S–1605S. 10.3945/ajcn.117.155879 [DOI] [PMC free article] [PubMed] [Google Scholar]
- WHO (World Health Organization) , 2020. WHO guideline on use of ferritin concentrations to assess iron status in individuals and populations. . https://www.who.int/publications/i/item/9789240000124 [PubMed] [Google Scholar]
- Yalçin, S. S. , Yurdakök, K. , Açikgöz, D. , & Ozmert, E. (2000). Short‐term developmental outcome of iron prophylaxis in infants. Pediatrics International, 42, 625–630. 10.1046/j.1442-200x.2000.01299.x [DOI] [PubMed] [Google Scholar]
- Yang, K. , Yang, Y. , Pan, B. , Fu, S. , Cheng, J. , & Liu, J. (2022). Relationship between iron metabolism and gestational diabetes mellitus: A systemic review and meta analysis. Asia Pacific Journal of Clinical Nutrition, 31, 242–254. 10.6133/apjcn.202206_31(2).0010 [DOI] [PubMed] [Google Scholar]
- Yiannikourides, A. , & Latunde‐Dada, G. O. (2019). A short review of iron metabolism and pathophysiology of iron disorders. Medicines (Basel), 6(3), 85. 10.3390/medicines6030085 [DOI] [PMC free article] [PubMed] [Google Scholar]
- Yu, J. , Liu, H. , He, S. , Li, P. , Ma, C. , Ma, M. , Liu, Y. , Lv, L. , Ping, F. , Zhang, H. , Li, W. , Sun, Q. , Xu, L. , & Li, Y. (2019). Sex‐specific negative association between iron intake and cellular aging markers: Mediation models involving TNFα. Oxidative Medicine and Cellular Longevity, 2019, 4935237. 10.1155/2019/4935237 [DOI] [PMC free article] [PubMed] [Google Scholar]
- Zhang, D.‐L. , Ghosh, M. C. , & Rouault, T. A. (2014). The physiological functions of iron regulatory proteins in iron homeostasis ‐ an update. Frontiers in Pharmacology, 5. 10.3389/fphar.2014.00124 [DOI] [PMC free article] [PubMed] [Google Scholar]
- Zhang, X. , Ouyang, J. , Wieczorek, R. , & DeSoto, F. (2009). Iron medication‐induced gastric mucosal injury. Pathology, Research and Practice, 205, 579–581. 10.1016/j.prp.2008.12.013 [DOI] [PubMed] [Google Scholar]
- Zhang, X. , Wu, M. , Zhong, C. , Huang, L. , Zhang, Y. , Chen, R. , Zhou, X. , Xu, S. , Li, Q. , & Cui, W. (2021). Association between maternal plasma ferritin concentration, iron supplement use, and the risk of gestational diabetes: A prospective cohort study. The American Journal of Clinical Nutrition, 114, 1100–1106. [DOI] [PubMed] [Google Scholar]
- Zhang, Y. , Xu, S. , Zhong, C. , Li, Q. , Wu, M. , Zhang, G. , Chen, R. , Liu, C. , Wu, J. , & Huang, L. (2021). Periconceptional iron supplementation and risk of gestational diabetes mellitus: A prospective cohort study. Diabetes Research and Clinical Practice, 176, 108853. [DOI] [PubMed] [Google Scholar]
- Zhao, L. , Lian, J. , Tian, J. , Shen, Y. , Ping, Z. , Fang, X. , Min, J. , & Wang, F. (2017). Dietary intake of heme iron and body iron status are associated with the risk of gestational diabetes mellitus: A systematic review and meta‐analysis. Asia Pacific Journal of Clinical Nutrition, 26, 1092–1106. 10.6133/apjcn.022017.09 [DOI] [PubMed] [Google Scholar]
- Zhao, Y. , Ray, A. , Portengen, L. , Vermeulen, R. , & Peters, S. (2023). Metal exposure and risk of Parkinson disease: A systematic review and meta‐analysis. American Journal of Epidemiology, 192, 1207–1223. 10.1093/aje/kwad082 [DOI] [PMC free article] [PubMed] [Google Scholar]
- Ziegler, E. E. , Nelson, S. E. , & Jeter, J. M. (2009). Iron status of breastfed infants is improved equally by medicinal iron and iron‐fortified cereal. American Journal of Clinical Nutrition, 90, 76–87. 10.3945/ajcn.2008.27350 [DOI] [PMC free article] [PubMed] [Google Scholar]
- Zimmermann, M. B. , Chassard, C. , Rohner, F. , Goran, E. K. N. , Nindjin, C. , Dostal, A. , Utzinger, J. , Ghattas, H. , Lacroix, C. , & Hurrell, R. F. (2010). The effects of iron fortification on the gut microbiota in African children a randomized controlled trial in Cote d'Ivoire. American Journal of Clinical Nutrition, 92, 1406–1415. 10.3945/ajcn.110.004564 [DOI] [PubMed] [Google Scholar]
- Zimmermann, M. B. , & Hurrell, R. F. (2007). Nutritional iron deficiency. The Lancet, 370, 511–520. 10.1016/S0140-6736(07)61235-5 [DOI] [PubMed] [Google Scholar]
Associated Data
This section collects any data citations, data availability statements, or supplementary materials included in this article.
Supplementary Materials
Protocol
EFSA’s intake assessment
Intake data from national authorities
References excluded at full text screening
Outcome of the public consultation