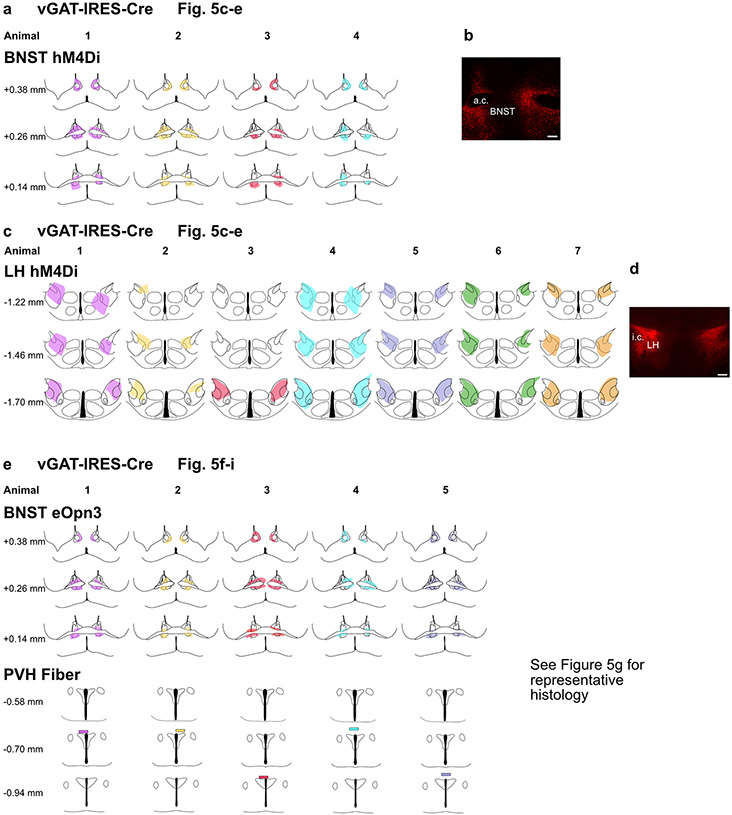
Extended Data Fig. 9. Schematic of AAV spread and fiber placements in vGAT-IRES-Cre mice.
a, Schematics representing AAV spread (shaded regions) for every animal related to experiments in Fig. 5c-e. Each animal is represented by a different colour. b, Representative image of hM4Di-mCherry expression in BNSTvGAT neuron somas. c, Schematics representing AAV spread (shaded regions) for every animal related to experiments in Fig. 5c-e. Each animal is represented by a different colour. d, Representative image of hM4Di-mCherry expression in LHvGAT neuron somas. e, Schematics representing AAV spread (shaded regions) and fiber placements (rectangles) for every animal related to experiments in Fig. 5f-i. Each animal is represented by a different colour. See Fig. 5g for a representative histological image. Scale bar = 200 μm. a.c. = anterior commisure, i.c. = internal capsule. The schematics were created using The Mouse Brain in Stereotaxic Coordinates Second Edition (Paxinos and Franklin).

