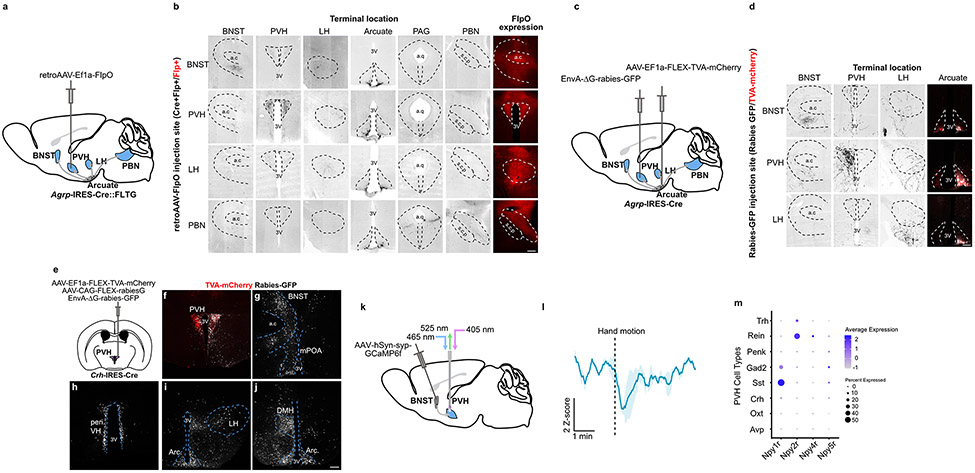
Extended Data Fig. 2. AgRP neuron collaterals and characterization of GABAergic afferents to PVHCrh neurons.
a, Schematic of collateral mapping via injection of retro-AAV-FlpO into Agrp-IRES-Cre::FLTG mice. b, AgRP neuron terminals detected upon injection of retro-AAV-FlpO into individual AgRP neuron efferent sites (denoted by row headings) in Agrp-IRES-Cre::FLTG mice. a.c: anterior commissure, 3V: third ventricle, a.q: aqueduct, s.c.p: superior cerebellar peduncle. c, Schematic of rabies-based collateral mapping. EnvA pseudotyped rabies-ΔG-GFP was injected into AgRP neuron terminal areas (PVH example) in Agrp-IRES-Cre mice that were previously injected with AAV-FLEX-TVA-mCherry in the arcuate. d, AgRP neuron terminals detected upon injection of EnvA pseudotyped rabies-ΔG-GFP into individual AgRP neuron efferent sites (denoted by row headings) in Agrp-IRES-Cre mice. e, Schematic of monosynaptic rabies mapping from PVHCrh neurons. f-j, Representative images of starter cells and putative afferents containing rabies-GFP labeled neurons in the PVH (f), BNST and mPOA (g), periventricular hypothalamus (h), LH and anterior arcuate nucleus (i) and DMH and posterior arcuate nucleus (j). PVH: paraventricular hypothalamus, a.c: anterior commissure, BNST: bed nucleus of the stria terminalis, mPOA: medial preoptic area, 3V: Third ventricle, peri VH: periventricular hypothalamus, LH: lateral hypothalamus, Arc: arcuate nucleus, DMH: dorsomedial hypothalamus. k, Schematic of recordings of BNST→PVH terminals. These mice are those used in Fig. 5j-o. l, BNST→PVH axons reduced activity in response to a looming hand motion stimulus over the animal (n = 3 mice). m, Expression of NPYRs in major PVH neuron cell types derived from single-cell RNA sequencing of PVH neurons43, plotted as average normalized expression level and fraction of cells in each cluster that express the receptor. Scale bar = 200 μm. Data represent = mean ± sem.

