Abstract
Background and Objectives
It is well known that more than 40% of patients in the convalescent rehabilitation settings suffer from malnutrition, and that appropriate nutrition management can improve rehabilitation outcomes.
Methods and Study Design
In this study, we used a change in motor score of Functional Independent Measure (FIM-M) of convalescent rehabilitation to investigate whether daily energy intake could influence the rehabilitation outcomes. Of the 217 patients hospitalized in our convalescent rehabilitation ward (CRW) between September 2016 and February 2017, 162 met the eligibility criteria for this study.
Results
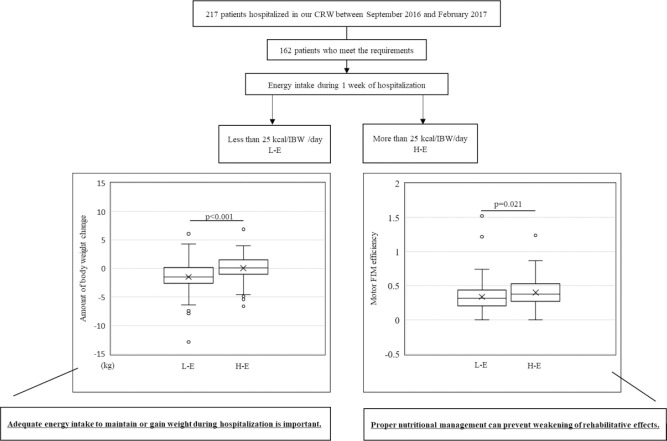
For a 25 kcal/ ideal body weight (IBW)/day cutoff point, 76 patients consumed more than 25 kcal/IBW/day of energy (H-E group), and 86 patients consumed up to 25 kcal/IBW/day of energy (L-E group). Patients in the L-E group had poorer nutritional status than those in the H-E group at CRW admission. Moreover, patients in the L-E group lost some body weight (BW) during hospitalization, whereas patients in the H-E group gained some BW. Furthermore, the FIM-M efficiency in the L-E group was significantly lower than that in the H-E group.
Conclusions
We concluded that appropriate nutritional management given to rehabilitation patients for adequate energy intake to maintain or gain their BW could maximize the outcome of convalescent rehabilitation.
Key Words: energy intake, protein intake, Functional Independent Measure (FIM), efficiency of rehabilitation, convalescent rehabilitation
Introduction
“Rehabilitation” is derived from “re” and “habilis” in Latin, which means “again” and “adaptation”, respectively.1 To date, rehabilitation is understood as an essential treatment strategy that assists patients in recovering after illnesses or traumas, and return to their daily activities to the best of their abilities. In Japan, rehabilitation is divided into three phases: 1) acute, 2) convalescent, and 3) community-based. Acute rehabilitation is done to preserve muscle strength and prevent disuse syndrome in patients cured from an illness. Convalescent rehabilitation is done to assist patients to resume their daily activities after their acute-phase treatment. Community-based rehabilitation is done to assist patients to maintain the quality or advance their daily following convalescent rehabilitation. Therefore, it is important for these rehabilitation programs to continue seamlessly.1
The convalescent rehabilitation ward (CRW) was officially first established in Japan in the year 2000 to conduct convalescent rehabilitation. Since then, the number of CRW have been increasing annually. Compared with regular wards, CRWs can provide rehabilitation services every day of the week, and can improve activities of daily living (ADL) to facilitate patient discharge. Additionally, nutritional management and intensive rehabilitation are important for enhancing the effectiveness of rehabilitation. For instance, post-stroke patients who were over weight (BMI between 25-27 kg/m2) could have a favorable functional recovery, which was indicated by the highest Functional Independent Measure (FIM) efficiency compared with the other BMI groups. Whereas, FIM efficiency was lowest in underweight post-stroke patients (BMI less than 18.5 kg/m2).2, 3 Nutritional interventions after surgery in elderly patients with hip fractures improved the postoperative outcomes and prevented declines in quality of life.4, 5 Patients whose condition was stable after the acute-phase treatment were hospitalized in a CRW for up to 6 months, whereas the length of stay in the acute hospital was 2 weeks or less. However, more than 40% of patients in the CRW suffer from malnutrition,6, 7, 8 and appropriate nutritional management can improve rehabilitation outcomes in CRW.
The food provided at most hospitals are prepared in accordance with the “Dietary Reference Intakes for Japanese (2015)”9 issued by the Minister of Health, Labor, and Welfare, and so, the food items provided to patients in a CRW would not be different between hospitals. In this study, the daily intakes of total energy and total protein were calculated for CRW patients based on the meal contents and dietary intake. We investigated a change in motor score in the FIM (FIM-M) during convalescent rehabilitation as a measure of the effect of daily dietary and energy intakes on rehabilitation outcomes.
Graphical abstract
Methods
Patients
We extracted data of patients aged >65 years, and were admitted to our CRW between September 2016 and February 2017. The following patients were excluded: 1) patients discharged to an acute hospital owing to sudden deterioration of their health which was too severe to continue rehabilitation, 2) patients whose body weight was not taken within a week after admission, and 3) patients whose body weight was not taken within a week before discharge.
Physical measurements
Within 3 days of admission, the body weight (BW) and height (H) of every patient were measured, and BMI were calculated (BMI = BW (kg)/ (H (m))2). During hospitalization, they were weighed every Saturday by medical staff. Patients' BW on the last Saturday of hospitalization was subtracted from that at admission, and was defined as the amount of BW change.
Nutritional screening
In our CRW, biochemical examination of blood, including serum albumin (Alb) (g/dL), was done for every patient on admission. The Geriatric Nutritional Risk Index (GNRI) was calculated using the BW, H, and Alb levels on the admission according to the following equation:
Ideal body weight (IBW) = (H (m))2 × 22
GNRI = (14.89 × Alb (g/dL)) + (41.7 × BW (kg) /IBW (kg))
If BW was more than IBW, BW/IBW was counted as “1”. Nutrition status in CRW patients was divided into 4 groups by GNRI: 1) GNRI < 82.0 was “Major risk”, 2) 82.0 ≤ GNRI ˂ 92.0 was “Moderate risk”, 3) 92.0 ≤ GNRI ˂ 98.0 was “Low risk”, and 4) GNRI ≥ 98.0 was “No risk”.
Calculation of functional independent measure
FIM consists of 13 items in the motor part and 5 items in the cognitive part, and is used to assess whether a patient has the ability to live at home. Each item is scored between 1 and 7, with the highest and lowest scores of 126 and 18, respectively. Thus, independence in ADL improves with the FIM score.
In CRW, FIM scores for each patient was evaluated upon admission, and once a week during hospitalization by all the staff members, including physicians, nurses, and therapists (physical, occupational, and speech). The difference between the FIM scores on admission and at discharge was defined as the FIM benefit. The FIM benefit divided by the number of days in the hospital was defined as the FIM efficiency. In this study, we extracted the FIM-M and used it as the FIM-M benefit and/or FIM-M efficiency.
Energy and protein intakes
In the CRW, nurses recorded the daily intake rate of staple food (SF) and accompanying dishes (AD) in three meals. Based on the intake rate of SF and AD and their contents, the total amount of energy (kcal) and protein (g) intake from SF and AD was calculated for one week (from the 2nd to the 8th day of admission). If any oral nutritional supplements (ONS) were administered during this time, it was assumed that patients ate at least 50% of the ONS because the nurses did not record intake rate of ONS. The daily intake of energy (EI, kcal/day) and protein (PI, g/day) was calculated by diving the total amount of energy and protein intake from meals and ONS taken over a week 7. The revised daily energy intake (revised EI, kcal/day/kg IBW) and protein intake (revised PI, g/day/kg IBW) was defined as EI and PI divided by IBW.
Statistical analysis
All analyses were performed using IBM®SPSS Statistics 28 (IBM Corporation, Armonk, NY, USA). Normally distributed data were reported as means ± standard deviation, and the Student's t-test was used to analyze differences between the two groups. The data that were not normally distributed were reported as medians with interquartile ranges, and differences between the two groups were analyzed using the Mann-Whitney U test. A p-value < 0.05 was considered statistically significant.
Ethics
All patients were informed of the proposed regimens of this study. Patients had the right to decline to participate in this study at any time. The study was conducted in accordance to the in the Declaration of Helsinki. All patient data were anonymized. This study was approved by the ethics committees of Doshisha Women's College (2020-01) and Jyujyo Takeda Rehabilitation Hospital (20180319-1).
Results
Of the 217 patients hospitalized in our CRW between September 2016 and February 2017, 34 patients were <65 years old. Fourteen patients left the CRW without completing their rehabilitation programs because of physical deconditioning. Seven did not get their body weights measured immediately after admission and/or prior to discharge. Finally, 162 patients were included in this study (Table 1).
Table 1.
Characteristics of the 162 patients in this study
| Causative disease | N (men/women) | % | Age (Mean ± SD) |
|---|---|---|---|
| Fracture due to osteoporosis | 52 (13/39) | 32.1 | 81.9±6.9 |
| Cerebrovascular disease | 51 (23/28) | 31.5 | 77.1±7.7 |
| Total hip arthroplasty | 21 (4/17) | 12.9 | 72.6±5.8 |
| Spine disorder | 15 (10/5) | 9.3 | 82.6±6.1 |
| Spinal cord injury | 7 (5/2) | 4.3 | 72.1±8.3 |
| Head trauma | 6 (4/2) | 3.7 | 76.0±7.5 |
| Disuse syndrome | 4 (2/2) | 2.5 | 81.8±5.6 |
| Others | 6 (3/3) | 3.7 | 82.0±8.9 |
|
| |||
| Total | 162 | 100 | 78.6±7.8 |
SD: Standard deviation
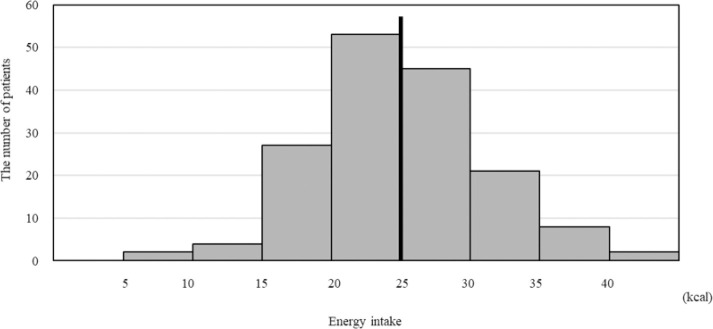
The average of the revised EI was 24.5 (kcal/IBW/day) among the 162 patients (Figure 1), and this was used to divide the eligible patients into two groups as follows: an average EI≥25, (rounding off 24.5 to the closest whole number) was classified as the high energy intake (H-E) group, and the others were classified as the low energy intake (L-E) group. The L-E and H-E groups comprised of 86 and 76 patients, respectively.
Figure 1.
Energy intake of each patient in this study. Among 162 patients, average of energy intake (EI) is 24.5 (kcal/IBW/day) (line). When 25 (kcal/IBW/day) was defined as cutline, EI of 76 patients are more than 25 (kcal/IBW/day), and EI of 86 patients are up to 25 (kcal/IBW/day)
Age, BMI, Alb, and BW change
There were no significant age difference in the patients in the H-E and L-E groups (78.7 ± 7.8 vs 78.6 ± 7.9, p=0.96, Table 2). BMI and Alb were higher in H-E group than in L-E group (BMI (kg/m2):22.6 ± 3.5 vs 20.9 ± 4.1, p=0.01; and Alb (g/dL):3.7 ± 0.5 vs 3.5 ± 0.5, p=0.01). Food intakes were higher in H-E group than in L-E group (SF:94.6 ± 7.7 vs 79.0 ± 22.7, p<0.001; AD:94.9 ± 6.2 vs 79.1 ± 16.7, p<0.001). The BW decreased for patients in the L-E group during CRW hospitalization, and increased for patients in the H-E group (−1.5 vs 0.15, p<0.01, Table 3).
Table 2.
Comparison of energy intake and physical characteristics at hospitalization between the two groups
| L-E group n=86 (men/women: 36/50) |
H-E group n=76 (men/women: 28/48) |
p | |||||||
|---|---|---|---|---|---|---|---|---|---|
| Mean± SD |
Percentile value |
Mean± SD |
Percentile value |
||||||
| 25 | 50 | 75 | 25 | 50 | 75 | ||||
| Age (y.o.)† | 78.6±7.9 | 71.8 | 79.0 | 85.0 | 78.7±7.8 | 73.3 | 78.0 | 84.0 | 0.96 |
| BMI (kg/m2)‡ | 20.9±4.1 | 17.6 | 20.1 | 23.2 | 22.6±3.5 | 19.5 | 23.2 | 25.0 | 0.01 |
| Serum Albumin (g/dL)‡ | 3.5±0.5 | 3.1 | 3.4 | 3.9 | 3.7±0.5§ | 3.4 | 3.7 | 4.1 | 0.01 |
| GNRI‡ | 89.1±9.5 | 81.8 | 89.2 | 96.5 | 94.1±9.3§ | 87.9 | 95.3 | 100 | <0.01 |
| Motor FIM† | 40.9±16.8 | 27.0 | 43.0 | 54.0 | 53.9±15.8 | 45.0 | 59.0 | 66.0 | <0.01 |
| Energy intake (kcal/IBW/day)‡ | 20.0±3.9 | 17.0 | 21.2 | 23.1 | 29.6±4.0 | 26.6 | 28.8 | 31.6 | <0.001 |
| Protein intake (g/IBW/day)‡ | 0.8±0.2 | 0.7 | 0.8 | 0.9 | 1.1±0.2 | 1.0 | 1.1 | 1.2 | <0.001 |
| Rate of staple food intake (%)† | 79.0±22.7 | 64.5 | 88.1 | 99.0 | 94.6±7.7 | 93.0 | 97.1 | 100 | <0.001 |
| Rate accompanying dish intake (%)† | 79.1±16.7 | 66.2 | 80.4 | 97.1 | 94.9±6.2 | 92.4 | 96.2 | 99.5 | <0.001 |
SD: Standard Deviation; BMI: Body Mass Index; GNRI: Geriatric Nutritional Risk Index
statistics significance by Mann-Whitney U test
statistics significance by T-test
The analysis was performed in 161 participants, because the data of a women was lost in H-E groups
Table 3.
Amount of body weight change during hospitalization, scores of motor FIM efficiency and discharge to home in the two groups
| L-E group n=86 |
H-E group n=76 |
p | |
|---|---|---|---|
| Amount of body weight change(kg): median (IQR) | −1.50 (−2.50 - 0.18) | 0.15 (−1.00 - 1.53) | <0.01 |
| Motor FIM efficiency: median (IQR) | 0.32 (0.21 - 0.43) | 0.38 (0.28 - 0.52) | 0.02 |
| Discharge to home | 73 (84.9%) | 69 (90.8%) | 0.254 |
IQR: interquartile range
Food and protein intakes
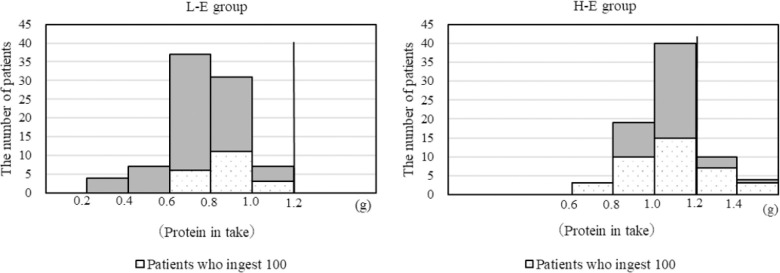
In the L-E group, all 86 patients did not take more than 1.2 g/IBW/day of protein, in which 20 patients fully ate offered diet. In contrast, of the 76 patients in the H-E group, 28 patients completely ate the food offered. Only 14 patients ingested more than 1.2 g/IBW/day protein per day (Figure 2).
Figure 2.
Protein intake of each patient in the 2 groups. In the L-E group, all 86 patients did not take more than 1.2 g/IBW/day of protein, in which 20 patients fully ate offered diet. On the other hand, of 76 patients in the H-E group, 14 patients took more than 1.2g/IBW/day of protein. Sixty-two patients did not take more than 1.2 g/IBW/day of protein, in which 20 patients fully ate offered diet.
Nutrition screening by GNRI
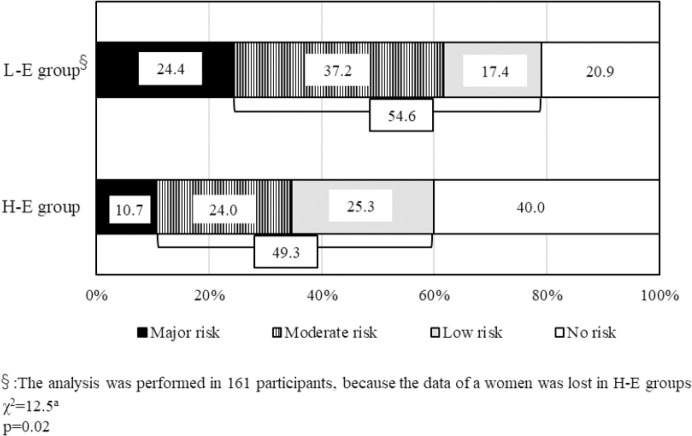
According to the results of nutritional screening by GNRI, nutrition status was better in H-E group than in L-E group (94.1 ± 9.3 vs 89.1 ± 9.5, p<0.01, Table 2). Based on the severity of nutritional status, the number of patients classified as “Major risk” in L-E group were significantly higher than that in H-E group (24.4% vs 10.7%, p=0.02, Figure 3). In addition, the number of patients classified as “No risk” in H-E group were higher than that in L-E group (40.0% vs 20.9%).
Figure 3.
The results of nutritional screening by GNRI in the 2 groups. In H-E group, 40% of patients are classified in “No risk”, and the rate of “No risk” in L-E group is the half of that in H-E group. On the other hand, “Major risk” is 10.7% of patients in H-E group, which shows an opposite trend in L-E group. The sum of the rate of both “Moderate risk” and “Low risk” in H-E group is approximately same as that in L-E group.
FIM-M at admission and its effectiveness by convalescent rehabilitation
The score of FIM-M at CRW admission was greater in H-E group than in L-E group (53.9 ± 15.8 vs 40.9 ± 16.8, p<0.01, Table 2). The effectiveness of FIM-M was higher in the H-E group than in the L-E group (0.38 vs 0.32, p=0.02, Table 3).
Discharge destination
There was no significant difference in discharge to home between the L-E and H-E groups (84.9% vs 90.8%, p=0.254, Table 3).
Discussion
The average daily energy intake by the patients in this study was approximately 25 kcal/kg/ day for a week. Generally, an energy intake of 25-35 kcal/IBW/day is suitable for convalescent patients with cerebrovascular diseases.10 Thus, it is not understood whether an energy intake of more than 25 kcal/kg/day could be sufficient for CRW patients as in the H-E group in this study, and less than 25 kcal/kg/day would be acceptable for patients in the L-E group.
Immediately after hospitalization in our CRW, a blood examination was done for every patient to determine whether they could undergo vigorous rehabilitation. Patients whose average energy intake for a week was less than 25 kcal/kg/day showed significantly lower levels of Alb and BMI than those who consumed more than 25 kcal/kg/day, indicating poor nutrition. There possible reasons for poor nutrition could be: 1) the patients had poor nutrition before their acute medical condition, 2) poor nutrition was caused by the acute diseases, its progression, and treatment, 3) poor nutrition was affected by inappropriate nutritional management. These poor nutritional conditions could contribute to the nutritional status of patients in CRW. According to the results of this study, it is likely that the patients, whose Alb level and BMI were less than 3.0 mg/dL and 16.8 kg/m2, would not be able to eat an adequate diet for convalescent rehabilitation. In addition, it would be obvious that the results of nutritional screening by GNRI were worse in the patients who had less than 25 kcal/kg/day of energy intake of than their counterparts.
CRW can legally provide 3-hour-rehabilitation every day, whereas in general ward including acute hospitals, 2-hour-rehabilitation can be done on weekdays only. Therefore, the time for rehabilitation is about 2-times longer per week in CRW compared with the general ward. In this study, patients who ingested more than 25 kcal/kg/day of energy showed an increased BW during convalescent rehabilitation, whereas the BW of the other patients declined during rehabilitation. It has been reported that 20% of women and men aged between 75-79 years suffer from sarcopenia (defined as loss of muscle volume in the body) due to aging (primary sarcopenia), and diseases and malnutrition (secondary sarcopenia). This causes muscle weakness and physical inability, and its morbidity increases with advancing age.11, 12 One of the aims of convalescent rehabilitation is to improve muscle strength, leading to improved ADL. Lean patients could have lost their BW before hospitalization to the CRW suggesting that the volume of energy intake would be subtherapeutic for convalescent rehabilitation, and that nutritional management was inadequate for the rehabilitation. Hence, it the score of FIM-M was lower in patients with lesser than 25 kcal/IBW/day of energy intake at the beginning of convalescent rehabilitation, and that the FIM efficiency was also reduced in those patients compared patients with a higher energy intake. Therefore, to improve the efficiency of convalescent rehabilitation, nutritional management is necessary to avoid decreased BW in lean patients at the beginning of convalescent rehabilitation.
One of the aims of convalescent rehabilitation is to increase muscle volume and improve ADL performance. Patients whose renal function does not decline, are not recommended a protein intake of more than 1.2 g/kg/day while on convalescent rehabilitation.13 In this study, only 14 patients (9%) of the total cohort met the protein requirement for convalescent rehabilitation. Moreover, 37% (28/76) of patients who completely ate the offered diet could not take a protein content of more than 1.2 g/IBW/day in H-E group. Previous studies show that the glomerular filtration rate (GFR) reduces by about 0.5 mL/dL/1.73 m2 every year among healthy people. The GFR of healthy elderly people (between 75 years old and 80 years old) is estimated to be about 60 mL/dL/1.73 m2, which is classified as Stage 2 in chronic kidney disease (CKD).14, 15, 16 In general, the patients with CKD stage-2 do not need to restrict protein intake, but our study participants had a declining GFR function due to several pre-existing conditions such as hypertension, hyperlipidemia, and arteriosclerosis, and hence, it was necessary to limit their protein intake. Thus, based on the results of this study it is not clear if our CRW patients were protein deficient. Further, the hospital meals offered to the patients had low protein content suggesting that hospital meals should be constantly reviewed for alterations in energy and protein intake.
In this study, an energy intake of more than 25 kcal/IBW/day was defined as high energy intake. However, this value is the lower limit of the recommended energy intake. Therefore, after increasing the number of participants, the “High-Energy” group should be sub-grouped by the amount of energy intake to investigate the physical effects of rehabilitation and efficiency of rehabilitation. Additionally, we must consider the CKD stage along with the protein intake in future studies.
In conclusion, for maximum efficiency of convalescent rehabilitation, it would be one of the best ways to accurately pick up the rehabilitation patients, whose nutrition status could be affected by convalescent rehabilitation, at the beginning of the convalescent rehabilitation, and then to maintain the patients BW by appropriate nutritional management, including amount of energy and protein intake during convalescent rehabilitation. In the future, the specialized methods of nutritional screening for convalescent rehabilitation patients should be established in order to improve rehabilitation effect.
Author Disclosures
The authors have no conflicts of interest to declare.
References
- 1.Kubo T. Overview of rehabilitation medicine. In: Kubo T, editor. Core Text of rehabilitation medicine. Tokyo: Igaku-Shoin; 2018. pp. 3–20. (in Japanese) [Google Scholar]
- 2.Burke DT, Al-Adawi S, Bell RB, Easley K, Chen S, Burke DP. Effect of body mass index on stroke rehabilitation. Arch Phys Med Rehabil. 2014;95:1055–1059. doi: 10.1016/j.apmr.2014.01.019. [DOI] [PubMed] [Google Scholar]
- 3.Zhao L, Du W, Zhao X, Liu L, Wang C, Wang Y, Wang A, Liu G, Wang Y, Xu Y. Favorable functional recovery in overweight ischemic stroke survivors: findings from the China National Stroke Registry. J Stroke Cerebrovasc Dis. 2014;23:e201–e206. doi: 10.1016/j.jstrokecerebrovasdis.2013.10.002. [DOI] [PubMed] [Google Scholar]
- 4.Hoekstra JC, Goosen JH, de Wolf GS, Verheyen CC. Effectiveness of multidisciplinary nutritional intake, nutritional status and quality of life in patients with hip fractures: a controlled prospective cohort study. Clin Nutr. 2011;30:455–461. doi: 10.1016/j.clnu.2011.01.011. [DOI] [PubMed] [Google Scholar]
- 5.Anbar R, Beloosesky Y, Cohen J, Madar Z, Weiss A, Theilla M, Koren Hakim T, Frishman S, Singer P. Tight calorie control in geriatric patients following hip fracture decreases complications: a randomized, controlled study. Clin Nutr. 2014;33:23–28. doi: 10.1016/j.clnu.2013.03.005. [DOI] [PubMed] [Google Scholar]
- 6.Bouziana SD, Tziomalos K. Malnutrition in patients with acute stroke. J Nutr Metab. 2011;2011:167898. doi: 10.1155/2011/167898. [DOI] [PMC free article] [PubMed] [Google Scholar]
- 7.Ojo O, Brooke J. The use of eternal nutrition in the management of stroke. Nutrients. 2016;8:827. doi: 10.3390/nu8120827. [DOI] [PMC free article] [PubMed] [Google Scholar]
- 8.Wakabayashi H, Sakuma K. Rehabilitation nutrition for sarcopenia with disability: a combination of both rehabilitation and nutrition care management. J Cachexia Sarcopenia Muscle. 2014;5:269–277. doi: 10.1007/s13539-014-0162-x. [DOI] [PMC free article] [PubMed] [Google Scholar]
- 9.The Minister of Health, Labor and Welfare Overview of Dietary Reference Intakes for Japanese. 2015. Available from: http://www.mhlw.go.jp/file/06-Seisakujouhou-10900000-Kenkoukyoku/Overview.pdf.
- 10.Nishioka S. Estimation of nutritional requirements. In: Takayama H, editor. Manual for Registered Dietitian in convalescent rehabilitation Ward. Tokyo: Japanese Association of Kaifukuki Rehabilitation Ward; 2020. pp. 79–81. (in Japanese) [Google Scholar]
- 11.Rosenberg IH. Summary comments. Am J Clin Nutr. 1989;50:1231–1233. [Google Scholar]
- 12.Yamada M, Nishiguchi S, Fukutani N, Tanigawa T, Yukutake T, Kayama H, Aoyama T, Arai H. Prevalence of sarcopenia in community-dwelling Japanese older adults. J Am Med Dir Assoc. 2013;14:911–915. doi: 10.1016/j.jamda.2013.08.015. [DOI] [PubMed] [Google Scholar]
- 13.Deutz P, Bauer J, Barazzoni R, Biolo G, Boirie Y, Bosy-Westphal A, et al. Protein intake and exercise for optimal muscle function with aging:recommendations from the ESPEN Expert Group. Clin Nutr. 2014;33:929–936. doi: 10.1016/j.clnu.2014.04.007. [DOI] [PMC free article] [PubMed] [Google Scholar]
- 14.Rowe JW, Andres R, Tobin JD, Norris AH, Shock NW. The effect of age on creatinine clearance in men: A cross-sectional and longitudinal study. J Gerontology. 1976;31:155163. doi: 10.1093/geronj/31.2.155. [DOI] [PubMed] [Google Scholar]
- 15.Lindeman RD, Tobin JD, Shock NW. Association between blood pressure and the rate of decline in renal function with age. Kidney Int. 1984;26:861–868. doi: 10.1038/ki.1984.229. [DOI] [PubMed] [Google Scholar]
- 16.Lindeman RD, Tobin JD, Shock NW. Longitudinal studies on the rate of decline in renal function with age. J Am Geriatr Soc. 1985;33:278–285. doi: 10.1111/j.1532-5415.1985.tb07117.x. [DOI] [PubMed] [Google Scholar]


