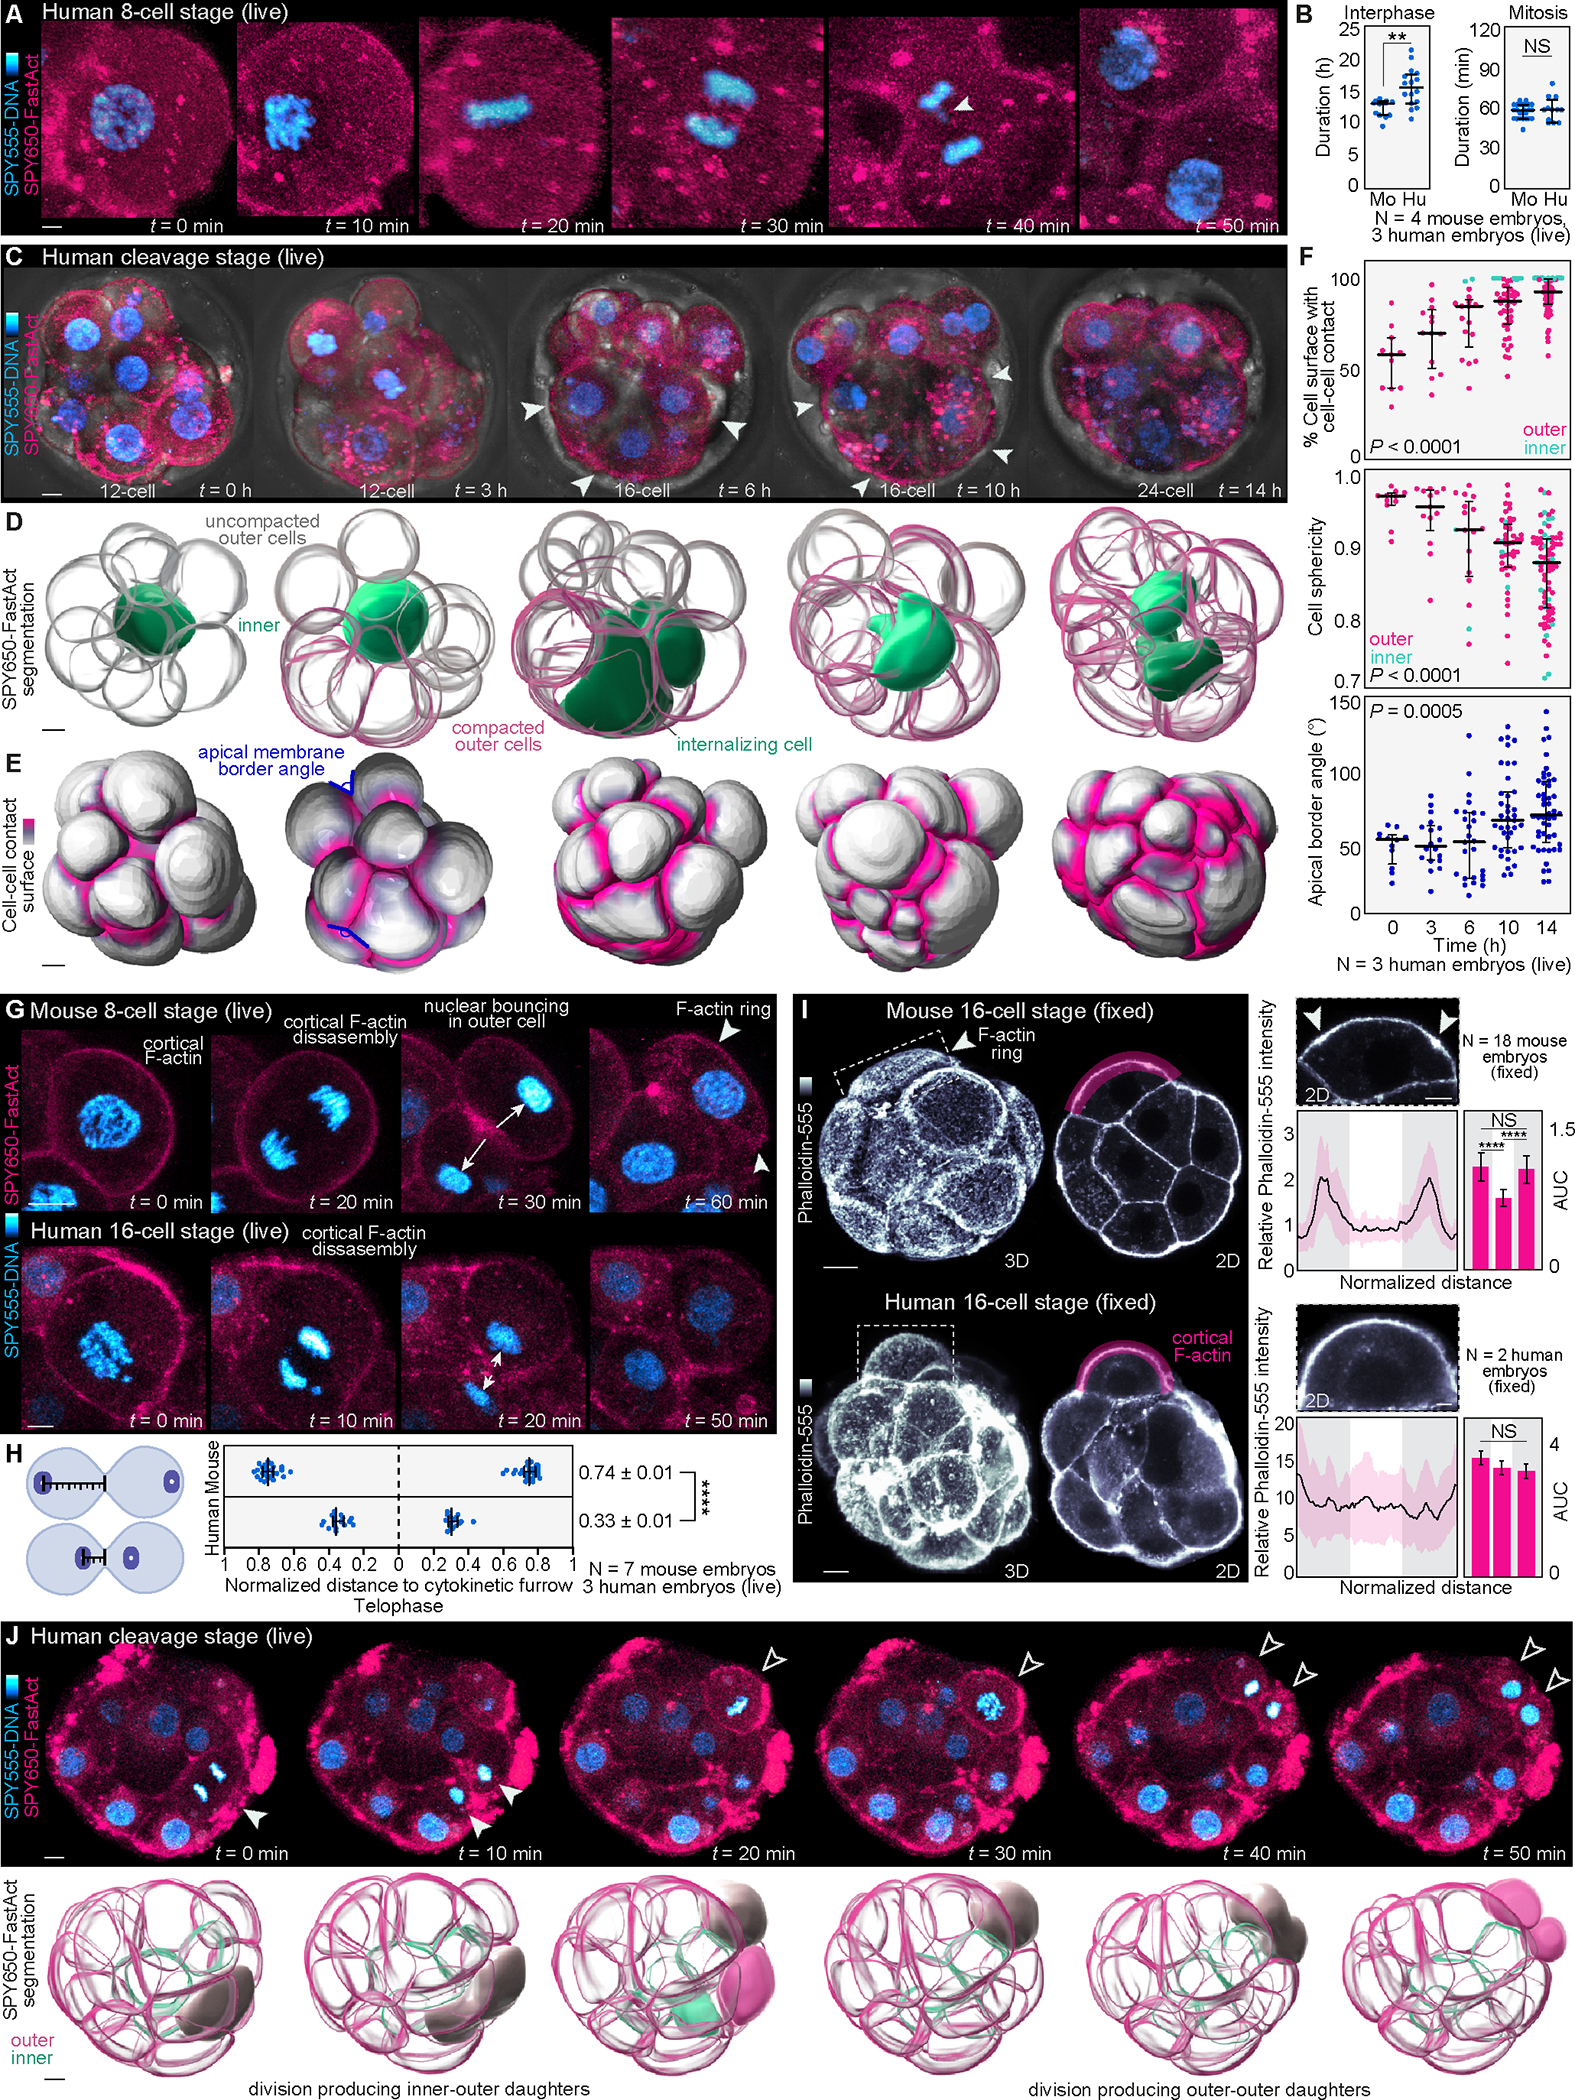
Figure 2. Non-invasive imaging reveals cell dynamics underlying early human preimplantation development.

(A) Live-imaging of cleavage stage human embryos labeled with SPY555-DNA and SPY650-FastAct allows visualization of the main phases of mitosis.
(B) Comparison of interphase and mitosis duration between mouse (Mo) and human (Hu) cleavage stage (16- to 32-cell) embryos (N = 4 mouse and 3 human embryos, n = 12 and 16 cells (interphase) and n = 31 and 12 cells (mitosis) for mouse and human, respectively; **P< 0.01, NS = not significant by student’s t-test).
(C) Example of a cleavage-stage human embryo undergoing compaction. Arrowheads show compacting cells.
(D) Computational segmentation of embryos shown in (C) enables visualization of changes in cell morphology during compaction. Note that compaction occurs in an asynchronous manner and that an inner cell becomes completely enclosed by its neighbors during the compaction process.
(E) and (F) Analysis of changes in cell-cell contact, cell sphericity and angle between apical membranes as proxies for compaction (N = 3 cleavage stage human embryos, and n = 11, 13, 17, 44, 77 cells at 0, 3, 6, 10, 14h, respectively; ****P< 0.0001 by one-way ANOVA, Kruskal-Wallis test).
(G) Analysis of nuclear position and apical polarization following division in live embryos. In mouse embryos, the cell nucleus bounces against the apical cell cortex at the end of cytokinesis triggering formation of an F-actin ring7. In the human embryo cell nuclei remain closer to the cytokinetic furrow (arrows) without bouncing against the cortex. Arrowheads highlight an actin ring in mouse.
(H) Distance of the nucleus to the cytokinetic furrow is measured for each mitotic pair at telophase (N = 7 mouse and 3 human embryos, n = 50 and 32 cells for mouse and human, respectively; ****P< 0.0001 by two-tailed unpaired student’s t-test).
(I) Most outer cells display F-actin rings in mouse embryos shown by Phalloidin-555 staining. The human apical domain enriches F-actin but does not form ring-like structures. Quantification of F-actin intensity along the apical cortex (magenta region) to highlight the presence (arrows) or absence of F-actin rings. For comparisons, the apical cortex was divided into thirds and the area under the curve (AUC) was calculated (N = 18 mouse embryos and 2 human embryos; n = 29 mouse cells and 11 human cells; ****P< 0.0001, NS = not significant by one-way ANOVA test).
(J) Live-imaging also exposes the first lineage segregation events generating outer-outer and inner-outer progeny in human. Upper images show 2D planes with dividing cells. Lower panels show segmented 3D reconstructions. The examples demonstrate a division producing outer-inner progeny and a second division producing outer-outer progeny.
Graphs show median with interquartile range. The zona pellucida was masked out in human live embryos to improve visualization. Scale bars, 10 μm.
