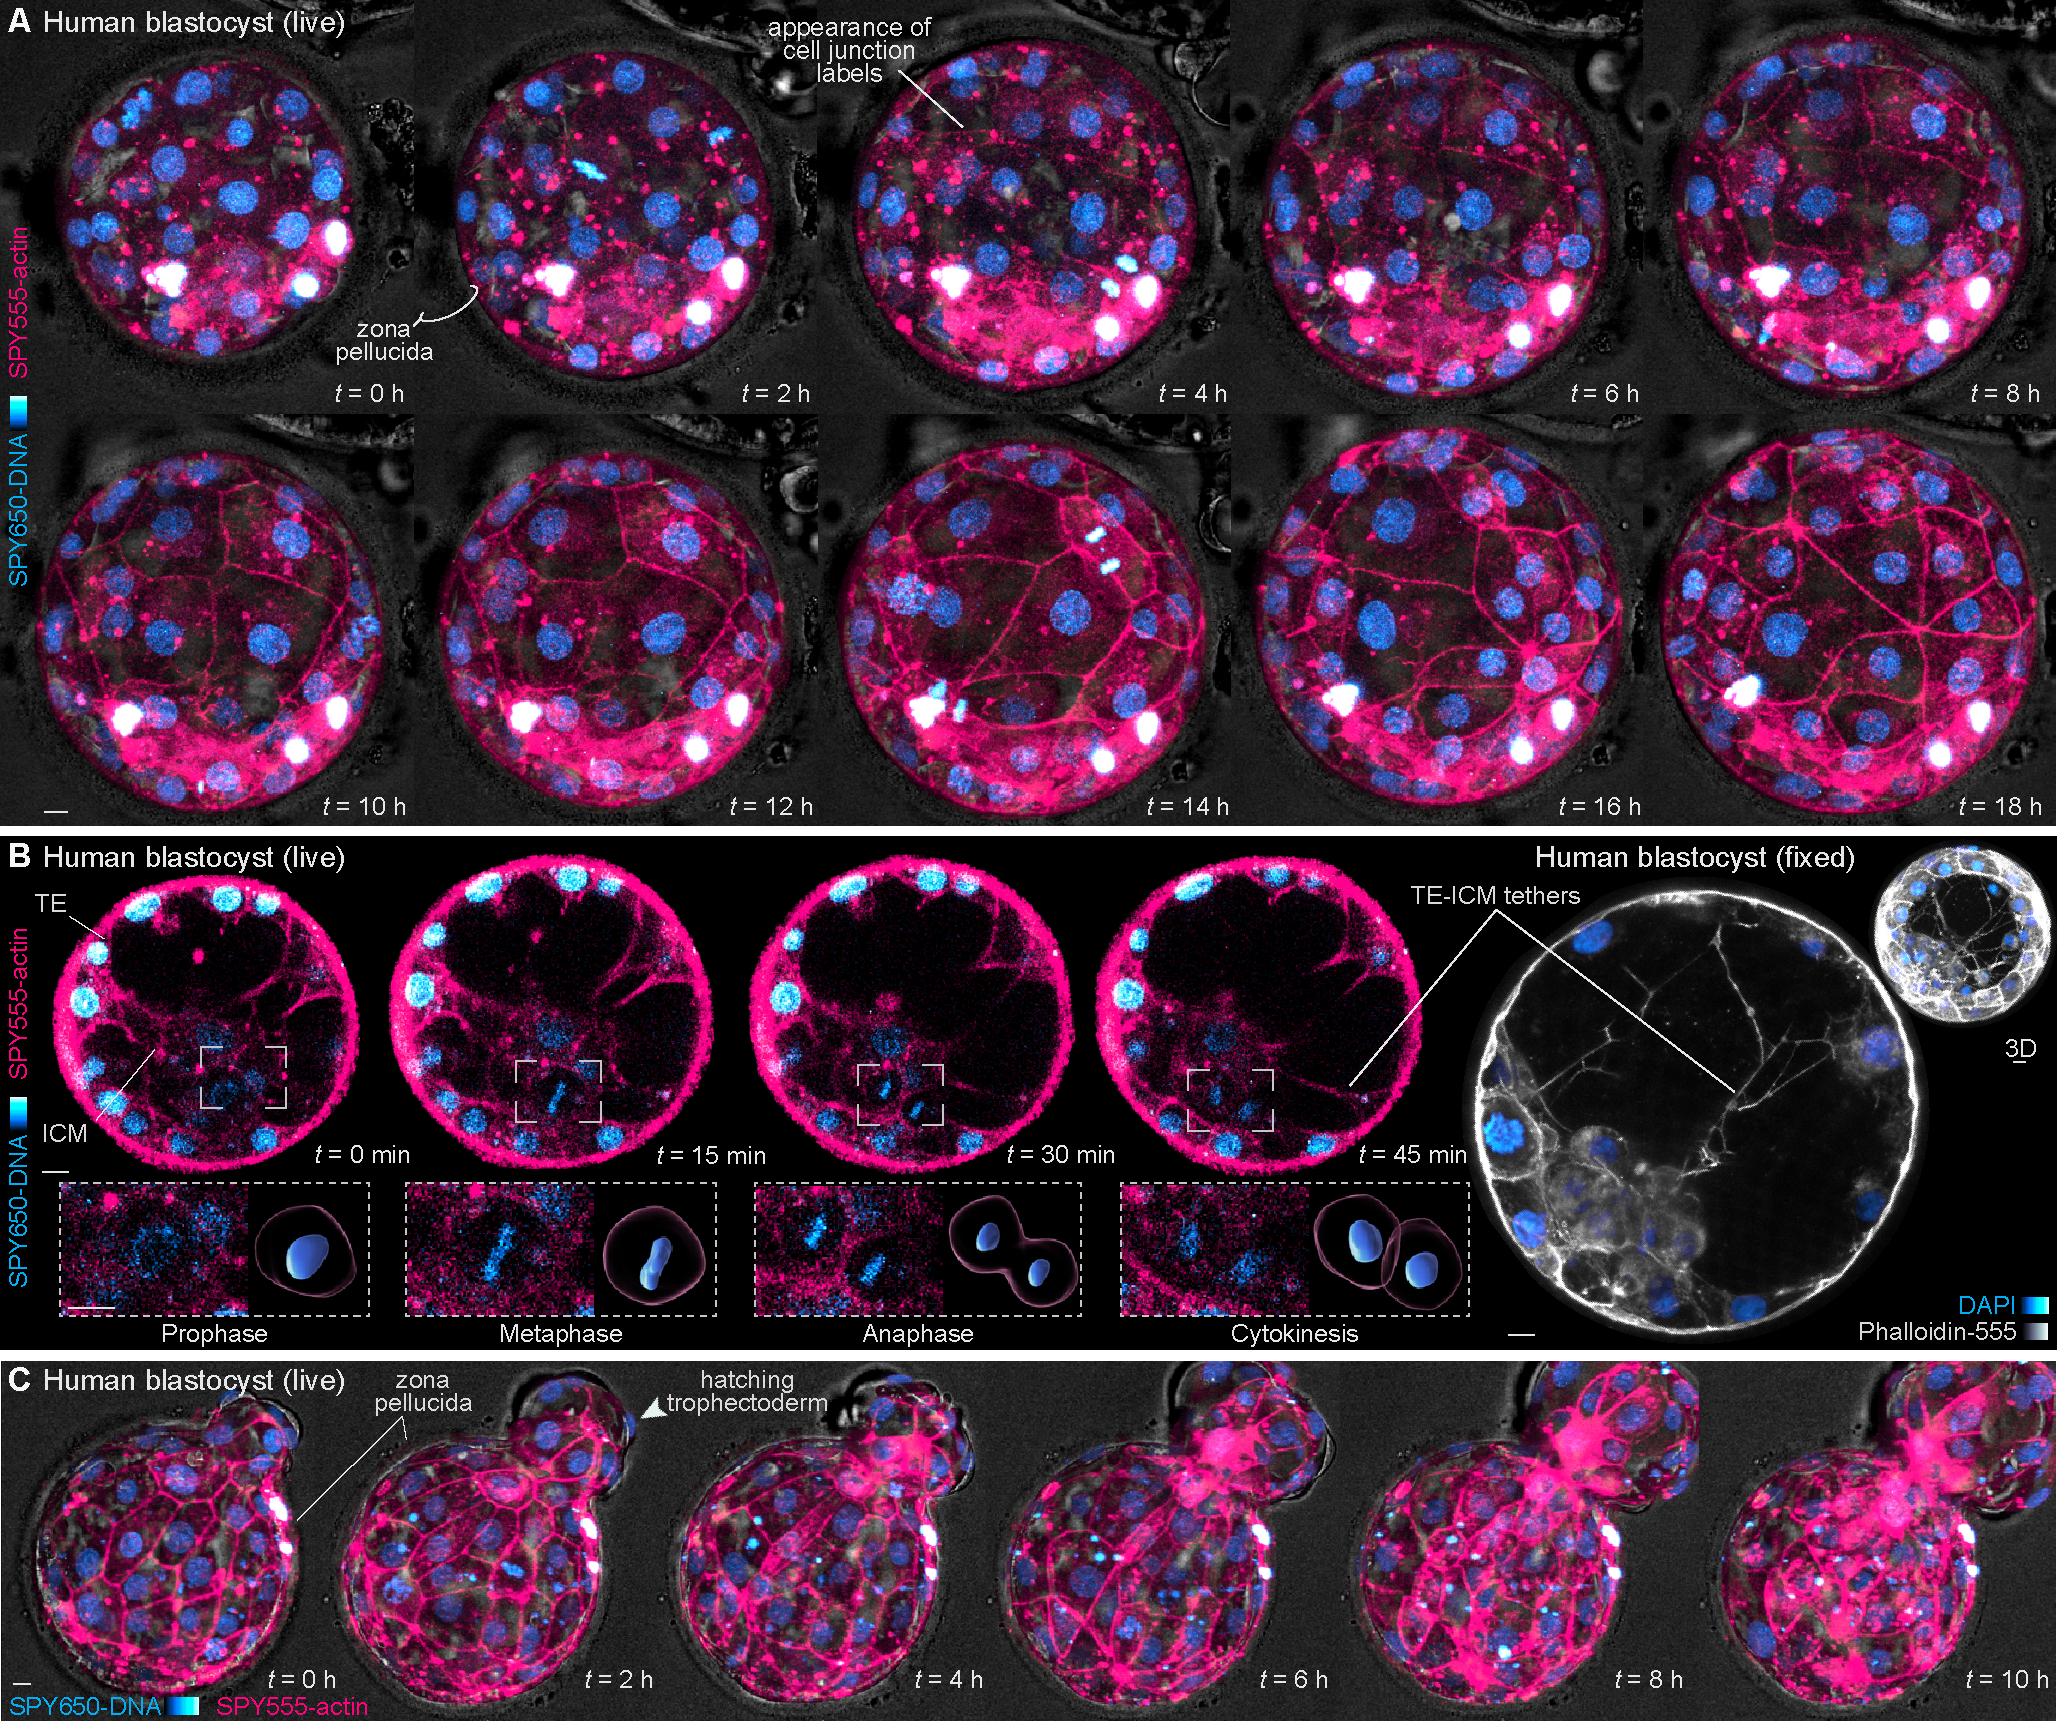
Figure 3. Dynamics of human blastocyst formation.

(A) Live-imaging of a human blastocyst stained with SPY650-DNA and SPY555-actin. After 1–2 hours cell-cell junctions become clearly labeled by SPY555-actin.
(B) 2D planes of a blastocyst during cavitation. A cell division within the ICM can be tracked over time and computationally segmented. Imaging through the blastocyst also reveals tether-like structures projecting between the trophectoderm and ICM validated by Phalloidin-555 staining in fixed embryos.
(C) Selected frames of a live human embryo undergoing hatching.
The zona pellucida was masked out in live human embryos to improve embryo visualization. Scale bars, 10 μm.
See also Figure S4.
