Abstract
Recently, magnetic nanoparticles (MNPs) based hyperthermia therapy has gained much attention due to its therapeutic potential in biomedical applications. This necessitates the development of numerical models that can reliably predict the temporal and spatial changes of temperature during the therapy. The objective of this study is to develop a comprehensive numerical model for quantitatively estimating temperature distribution in the ferrofluid system. The reliability of the numerical model was validated by comparative analysis of temperature distribution between experimental measurements and numerical analysis based on finite element method. Our analysis showed that appropriate incorporation of the heat effects of electromagnetic energy dissipation as well as thermal radiation from the ferrofluid system to the surrounding in the modeling resulted in the estimation of temperature distribution that is in close agreement with the experimental results. In summary, our developed numerical model is useful to evaluate the thermal behavior of the ferrofluid system during the process of magnetic fluid hyperthermia.
Keywords: Magnetic fluid hyperthermia, Specific loss power, Magnetic nanoparticle, Induction heating, Thermal analysis, Finite element method
Graphical abstract
1. Introduction
Recently, magnetic nanoparticles (MNPs) based hyperthermia therapy has gained much attention due to its capacity to target and thermally inactivate tumor cells as well as bacterial pathogens via a minimally invasive manner [1–5]. The principle of this therapy is to induce a localized increase in temperature in the target cells by the activation of MNPs relaxation effects under exposure of externally applied energy source of high frequency alternating magnetic field (AMF) [6]. Despite the therapeutic efficacy of MNP/AMF hyperthermia, the potential for non-specific thermal damage to the host tissue has been a major limitation of the approach. As such, a precise estimation of the temporal and spatial temperature distribution in the affected tissue during the application of MNP/AMF hyperthermia is warranted for the translation of the therapy into clinics. However, it is a challenging task to experimentally measure tissue temperature distribution during the hyperthermia treatment, especially when the target tissue is deep in the body.
In view of this, there have been numerous efforts to accurately predict MNP/AMF-induced temperature rise in the tissue by means of numerical modeling and analysis [7–10]. This kind of numerical modeling typically requires the use of experimentally measured value of specific loss power (SLP) as an input parameter. The SLP represents the electromagnetic power per unit mass dissipated by the given MNP and has been used as a parameter to assess the efficiency of MNPs in converting electromagnetic energy into power dissipation, which is induced via mechanisms, such as Brownian and Néel relaxation as well as hysteresis losses [11]. For the given MNPs, the SLP parameter is determined by calorimetric measurements, whose values are influenced by factors, such as the frequency and strength of AMF [12–14]. The precise estimation of SLP is critical for the successful development of a numerical model for predicting the temporal and spatial temperature distribution during the application of MNP/AMF hyperthermia [12,15–18].
It has been shown that various parameters of the calorimetry setup could influence measured SLP values of MNPs, such as sample volume, sample container geometry, thermal and physical properties of the container, temperature sensor positioning, coil geometry and quasi-adiabatic magneto-thermal calorimetry [15,19–21]. In view of this, Huang et al. [15] presented a numerical model that evaluates the effect of sample container size on the SLP. The coupled electro-thermal models have been presented to estimate the impact of heat losses due to water-cooled coil for magnetic fluid hyperthermia [22,23]. In another study [14], the authors compared numerical models for the prediction of the temperature change in the aqueous ferrofluid, with and without consideration of the mass and volume fractions of the two-component magnetic fluid. Jonasson et al. [24] predicted intrinsic loss power (ILP) values by using either a non-interacting Debye model or dynamic model of Monte-Carlo simulations by considering the core-core magnetic interactions for multi-core particles. However, there is still lack of a comprehensive numerical model that enables an accurate estimation of the temperature distribution over time and space in a magnetic fluid system.
The objective of this study is to develop a comprehensive numerical model for quantitatively estimating temperature distribution in the ferrofluid system using a finite element analysis. In particular, our model was developed by incorporating the potential heat effects of electromagnetic power dissipation as well as thermal radiation resulted from a non-adiabatic process between the ferrofluid system and its surrounding, which can closely mimic an actual experimental system. The reliability of our numerical model was validated by comparative analysis of temperature distribution between experimental measurements and numerical analysis.
2. Methodology
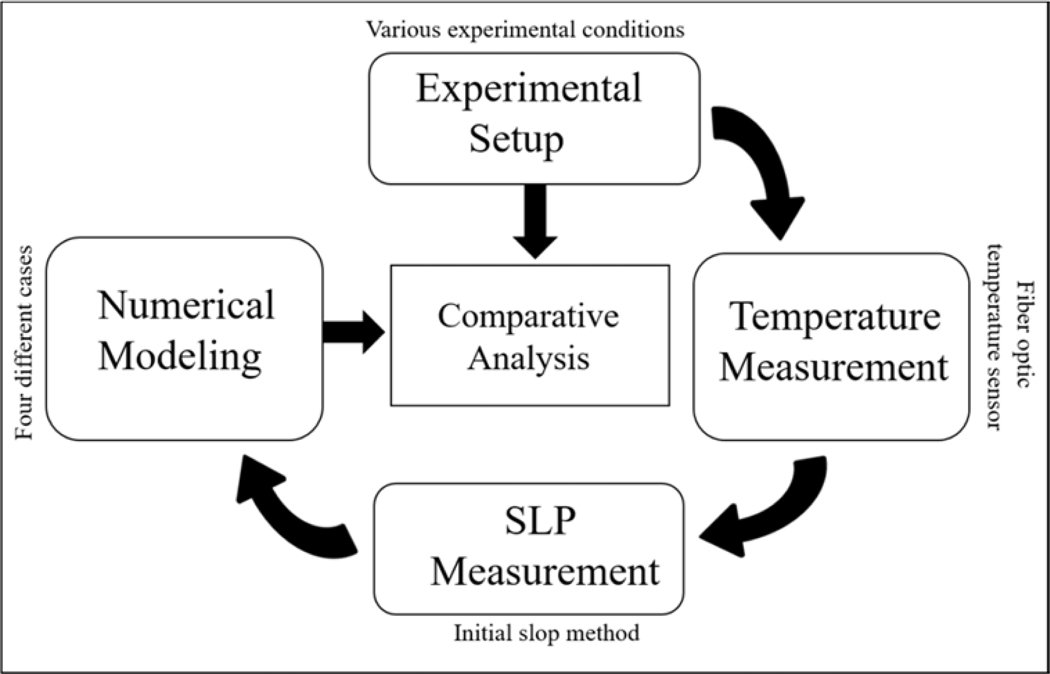
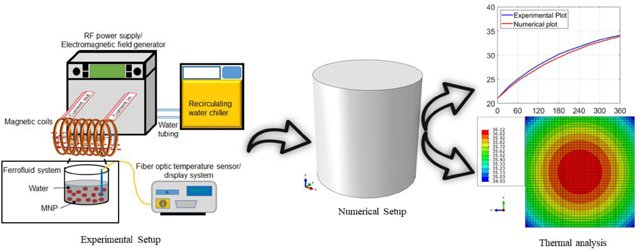
The research methodology conducted in the present work is depicted with the use of the flow diagrams shown in Fig. 1. Initially, experiments were conducted for the ferrofluid with MNPs under varying conditions of AMF strengths MNP concentrations. The temperature increase in the ferrofluid was measured during the application of AMF by using a fiber-optic temperature sensor inserted into the ferrofluid solution. Subsequently, the SLP values were determined by a calorimetric method from the experimental data of the temperature-time curve under various conditions of AMF strength. The measured SLP values and effective material properties of the ferrofluid system were used as input parameters for numerical modeling. In particular, numerical analyses were performed for four different scenarios for the purpose of evaluating the effects of power dissipation from the ferrofluid system through the boundaries of the system or wall tube in the absence and presence of thermal radiation resulting from a non-adiabatic process, which include; (i) ferrofluid only (bare system) under adiabatic condition, (ii) ferrofluid in the tube with wall thickness under adiabatic condition, (iii) bare system under non-adiabatic condition, and (iv) ferrofluid in the tube with wall thickness under non-adiabatic condition.
Fig. 1.
Flow diagram of the process involved relevant to this research.
3. Experimental setup
For the calorimetric measurement of SLP in ferrofluids, suspensions of ferrofluid containing magnetite nanoparticles (Fe3O4) were prepared at three different concentrations (1 mg/mL, 2 mg/mL and 3 mg/mL in 200 μL constant volume of water) by reconstituting commercially obtained Fe3O4 MNPs (25 mg/mL nanomag-D-Spio, #79–00–102, 100 nm in diameter, Micromod GmbH) with water. The AMF hyperthermia system used in this study was custom-built and was validated in our previous study [2]. The prepared ferrofluid solution at the working concentration was contained in the polystyrene tube. The system dimensions are measured with the help of electronic caliper as shown in Table 1. The mass () and volume () fractions of the MNPs in ferrofluid were determined by:
| (1) |
| (2) |
where and represent masses of MNPs and water, respectively. and indicates the volume of water and MNPs, respectively. The concentration of the colloid suspension (cMNPs) was determined as given below:
| (3) |
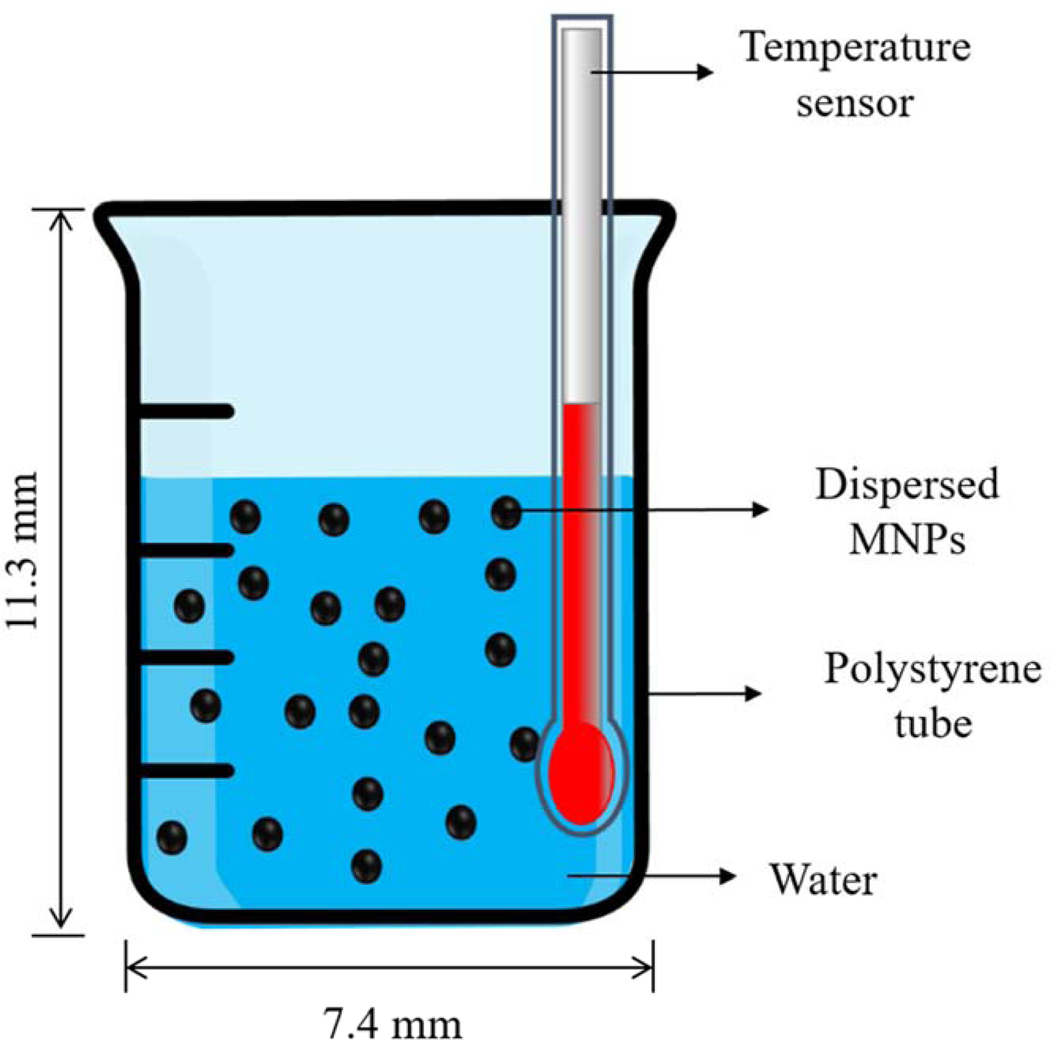
where indicates the volume of the magnetic fluid (MF). For the application of AMF on the magnetite ferrofluid sample, the polystyrene tube containing ferrofluid was positioned in the center of water-cooled magnetic coil (40 mm in diameter) of the AMF system with variable power (0–8 kW) and frequency (1.7–2.1 MHz) adjustment. The hyperthermia characteristic of the AMF system was validated in our previous study [2]. Then, the ferrofluid sample was exposed to AMF under three different magnitudes of magnetic field strengths ( kA/m, 24 kA/m and 30 kA/m) at the fixed frequency ( MHz). The magnetic field was measured by locating a magnetic field probe to the center of the coil chamber in the absence of magnetic fluid sample. For the measurement of temperature in the magnetic fluid, the tube containing the fluid was inserted into the center region of the coil chamber while positioning a fiber optic temperature sensor (Neoptix, Inc) inside the tube. The temperature probe was positioned (about 1 mm from the side wall and bottom of the tube) in the fluid sample as shown in Figure 2. The increase in temperature in the ferrofluid samples was then measured under nine different combinations of AMF strengths (, 24, and 30 kA/m) and MNPs concentrations (, and 3 mg/mL). It should be noted that the parameters of AMF ( and ) used in this study is above the exposure criterion of magnetic fluid hyperthermia to the human body [25] and, in this study, it was considered for theoretically basis.
Table 1.
Dimensions demonstration of the experimental setup
| Quantity | Dimensions |
|---|---|
| Height of tube | 11.3 mm |
| Internal diameter of tube | 6.3 mm |
| Outer diameter | 7.4 mm |
| Thickness of tube wall | 0.55 mm |
| Water volume | 200 μL |
| Diameter of MNPs | 100 nm |
| Mass of MNPs | 0.2, 0.4 and 0.6 mg |
Fig. 2.
Demonstration of the calorimetric setup and positioning of temperature probe.
4. Parameters from experiments
4.1. Effective thermal and physical parameters
During the application of magnetic fluid hyperthermia, the temperature distribution in the fluid can be influenced by a number of factors, such as thermal and physical properties of the individual component of the MNPs as well as the fluids containing dispersed MNPs [26]. Additionally, the geometry of the system containing the suspension of MNPs as well as the extent of heat transfer between the ferrofluid system and surrounding play an important role in the variation of the measured temperature [27]. Since the ferrofluid is composed of MNPs and dispersion fluids, it is necessary to consider the effects of both constituents in determining the thermal and physical properties of ferrofluid. In view of this, in the current study, the effective thermal and physical parameters were introduced as the sum of the individual property of MNPs and aqueous suspension. The relationships for the effective parameters for mass density specific heat capacity and thermal conductivity of the ferrofluid are given by Eqs. (4)—(6), respectively [14,28,29]:
| (4) |
| (5) |
| (6) |
where and 0.0006 and and 0.9994 represent the volume fraction of MNPs and water, respectively. The and 0.003 denote the mass fraction for MNPs and and 0.997 mass fraction of water in the suspension, respectively. The thermal and physical properties; mass density (), specific heat capacity (), thermal conductivity () for different materials considered in this work are given in Table 2. After substituting the values of the individual constituents (water and MNPs), in Eqs. (4)–(6), effective material properties of magnetic fluid for numerical simulation are obtained for different concentrations of MNPs.
Table 2.
| Material | [mg/mL] | [kg/m3] | [J/kg/K] | [W/m/K] | |
|---|---|---|---|---|---|
| Water | 1000 | 4178 | 0.6 | 0.97 | |
| Magnetite | 5180 | 670 | 40 | – | |
| Polystyrene | 55 | 1210 | 0.027 | 0.82 | |
| Magnetic fluid | 1 | 1000.1 | 4174.5 | 0.6003 | – |
| 2 | 1001.6 | 4171.0 | 0.6007 | – | |
| 3 | 1002.4 | 4167.5 | 0.6010 | – |
4.2. Measurement of specific loss power (SLP)
The experiments in our ferrofluid system were carried out under non-adiabatic conditions, where heat transfer can occur between the system and its surrounding via different modes of heat transfer as indicated in section 5. The calorimetric method is used for determining the SLP for numerical modeling rather than calculating it by hysteresis losses [26]. Several methods to determine SLP values have been reported, which include initial slope, Box-Lucas, steady state, corrected slope, modified law of cooling and decay methods [15,30]. Among them, the initial slope method has been used more often because the initial slope in the temperature-time curve is not influenced by potential heat losses that may occur in the later phase [31]. Based on the initial slope method, the SLP can be determined by the expression given below [14]:
| (7) |
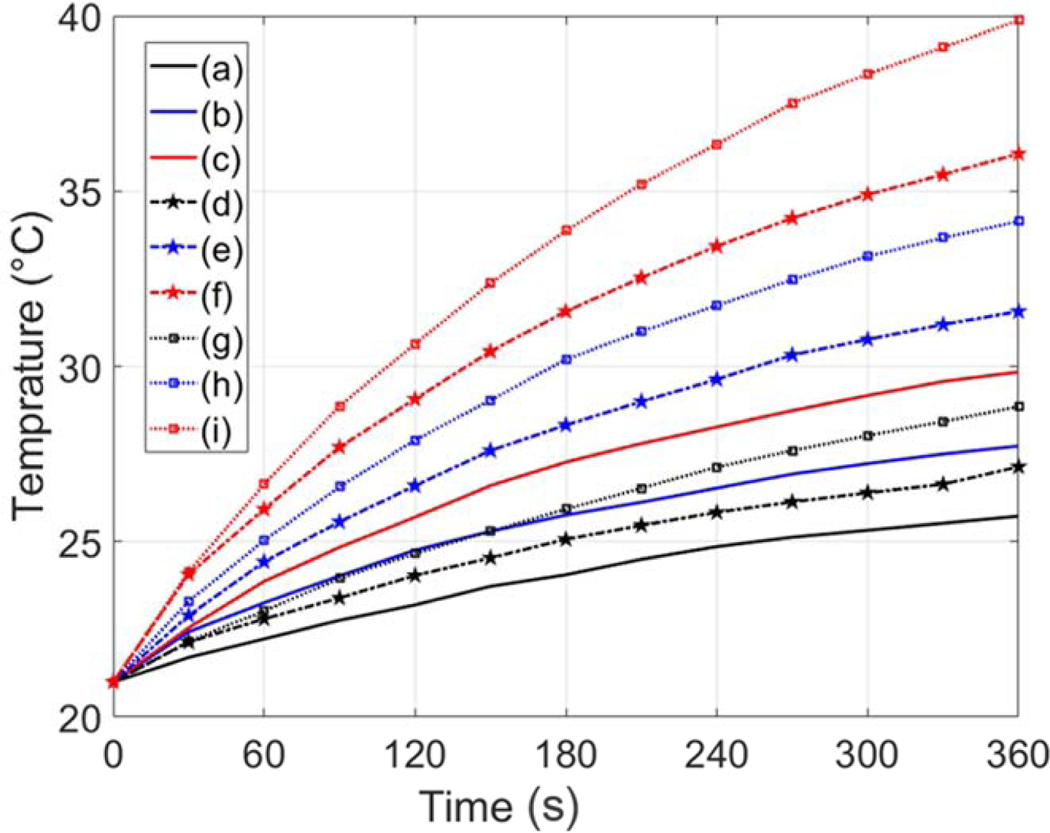
where and are the specific heat capacity and mass of the magnetic fluid, respectively. represents the mass of the MNPs dispersed in water. is the increment in the temperature of the sample measured in the time interval . The heating rates (K/s) were calculated by using a curve fitting technique [32] from the experimentally measured temperature-time curve and the results are given in Fig. 3. The dissipated power and volumetric power generation is calculated from the SLP and the expressions are given as below:
| (8) |
| (9) |
where indicates the volume of magnetic fluid. Various parameters, such as initial slopes, SLP values and volumetric heat generation for different experimental conditions are given in Table 3.
Fig. 3.
Calorimetric temperature measured curves with respect to time for experimental conditions, including various values of magnetic field strengths (H) and MNPs concentration (cMNPs): (a) H = 18 kA/m, cMNPs = 1 mg/mL, (b) H = 18 kA/m, cMNPs = 2 mg/mL, (c) H = 18 kA/m, cMNPs = 3 mg/mL, (d) H = 24 kA/m, cMNPs = 1 mg/mL, (e) H = 24 kA/m, cMNPs = 2 mg/mL, (f) H = 24 kA/m, cMNPs = 3 mg/mL, (g) H = 30 kA/m, cMNPs = 1 mg/mL, (h) H = 30 kA/m, cMNPs = 2 mg/mL, (i) H = 30 kA/m, cMNPs = 3 mg/mL.
Table 3.
Quantitative demonstration of different parameters
| Experiment no | [mg/mL] | [kA/m] | [K/s] | [mW/mg] | [kW/m3] |
|---|---|---|---|---|---|
| 1 | 1 | 18 | 0.023 | 95.5 | 95.5 |
| 2 | 2 | 0.038 | 80.0 | 159.9 | |
| 3 | 3 | 0.049 | 68.0 | 203.8 | |
| 4 | 1 | 24 | 0.037 | 152.4 | 152.4 |
| 5 | 2 | 0.057 | 119.0 | 237.9 | |
| 6 | 3 | 0.082 | 114.7 | 343.9 | |
| 7 | 1 | 30 | 0.038 | 159.9 | 160.0 |
| 8 | 2 | 0.074 | 154.5 | 308.9 | |
| 9 | 3 | 0.104 | 145.4 | 435.8 |
4.3. Critical thickness of tube containing ferrofluid
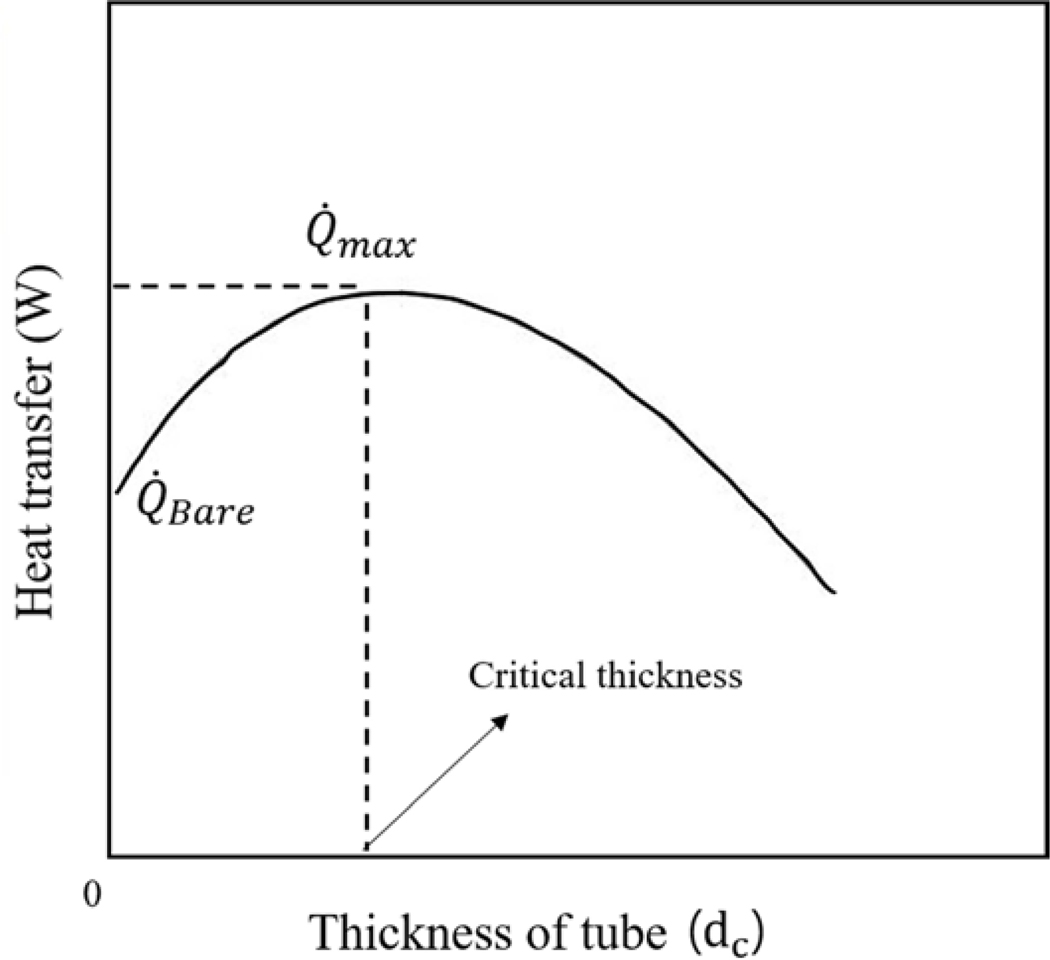
The heat generated in the ferrofluid system was transferred to the surrounding environment, and the rate of heat transfer can be influenced by the thickness of the tube wall containing the ferrofluid, in which a maximum rate of heat transfer takes place at a specific tube thickness, called critical thickness () (Fig. 3). The critical thickness can be calculated by [33]:
| (10) |
where is the thermal conductivity of the tube material and represents the surrounding convective heat transfer coefficient. At the critical thickness, conductive heat transfer dominates over convective transfer, and thus heat transfer reaches its maximum at that point [33]. Beyond the critical thickness of the tube wall, the rate of heat transfer decreases with increasing thickness of the tube due to an increase of thermal resistance.
5. Numerical modeling
In this study, numerical modeling and simulations were performed for four different cases categorized depending on the consideration of heat transfer and radiation between the ferrofluid system and its surrounding, based on the assumptions listed below:
The heat flux from the system to the surrounding is continuous.
The effective material properties are considered for simulations.
Static air convective heat coefficient ( W/m2/K ) for surrounding the system is considered [33].
The initial temperature of the system is set at 21°C.
The MNPs are uniformly distributed in the dispersion fluid.
The numerical simulations for the developed models were performed by using ABAQUS, a finite element analysis package.
Case I (ferrofluid only):
In this scenario, the ferrofluid system is assumed to interact with its surrounding environment directly with a surface film condition, which is an interaction module between the systems and surrounding in the ABAQUS software package. The model for this case was meshed by using hexahedral elements of type DC3D8 and comprises a total of 71,810 elements and 76,428 nodes. The temperature distribution for this model is governed by the heat diffusion equation as given below [33,34]:
| (11) |
The boundary and initial conditions are as follow:
| (12) |
| (13) |
where is the density of the ferrofluid, is the specific heat capacity, is the thermal conductivity, is the volumetric power generated by the MNPs inside the ferrofluid, is the initial temperature of the system and is the surrounding environment temperature, A is the outer surface area of the system interacting with the surrounding, and h is the convective heat coefficient of the air. The boundary condition from Eq. (13) shows the convective heat transfer from periphery the system to surrounding air.
Case II (ferrofluid with tube wall):
In this scenario, the effect of the tube wall thickness was considered in the model, since the tube wall can influence the rate of heat loss and consequently, the distribution of temperature in the system. In order to incorporate the presence of tube wall in the model, a tie interaction was assumed between the magnetic fluid and tube wall, through the consideration of the outer periphery of the magnetic fluid as a master and inner surfaces of the tube as a slave surface. For this, a shell tube with the internal diameter of 6.3 mm and thickness of 0.55 mm was considered and this model contained element types of linear quadrilateral (DS4) with a total of 7,310 elements and 7,377 nodes.
Case III (Ferrofluid with thermal radiation):
This model is the extension of case I by incorporating the effect of thermal radiations occurring from the surface of the ferrofluid to the surrounding of the model. For that purpose, the Stefan-Boltzmann constant and absolute zero temperature are defined in the simulation setup. It was assumed that both radiative and convective heat transfer take place from the surface of the ferrofluid to the surrounding air. The temperature distribution can be presented by Eq. (11) with combined convective radiative heat boundary condition given as:
| (14) |
where is the Stefan-Boltzmann constant an is the thermal emissivity.
Case IV (ferrofluid with both tube wall and thermal radiation):
The numerical model for this scenario considers the effects thermal radiations occurring from the surface of the ferrofluid to the surrounding air as well as heat transfer through the tube wall to the surrounding environment. The temperature distribution in this scenario can be represented by the heat diffusion equation from Eq. (11).
In order to determine the correlation between numerical modeling and experimental results, comparative analysis has been carried out. The relative absolute percentage error was calculated from the experimentally measured and numerically estimated temperatures using the expression given below:
| (15) |
where and represent the temperatures from the experiment and numerical analyses, respectively.
6. Results and discussion
6.1. Experimental analysis
6.1.1. The effect of AMF strength on SLP values
The experimental measurements of the time-dependent increase in temperature for various conditions (H = 18, 24 and 30 kA/m) at the fixed frequency of 2.1 MHz, and ( and 3 mg/mL) are shown in Fig. 3. The extent of temperature increments was positively associated with increase in AMF strength at the given AMF frequency and MNPs concentrations. For example, for 1 mg/mL of MNPs, the temperature in the solution rose from 21°C to 25.7°C to 27.1°C and to 28.9°C for AMF at 18 kA/m, 24 kA/m and 30 kA/m, respectively. The similar tendency of temperature rise with increasing AMF was also observed for higher concentrations 2 mg/mL and 3 mg/mL of MNPs of the ferrofluid.
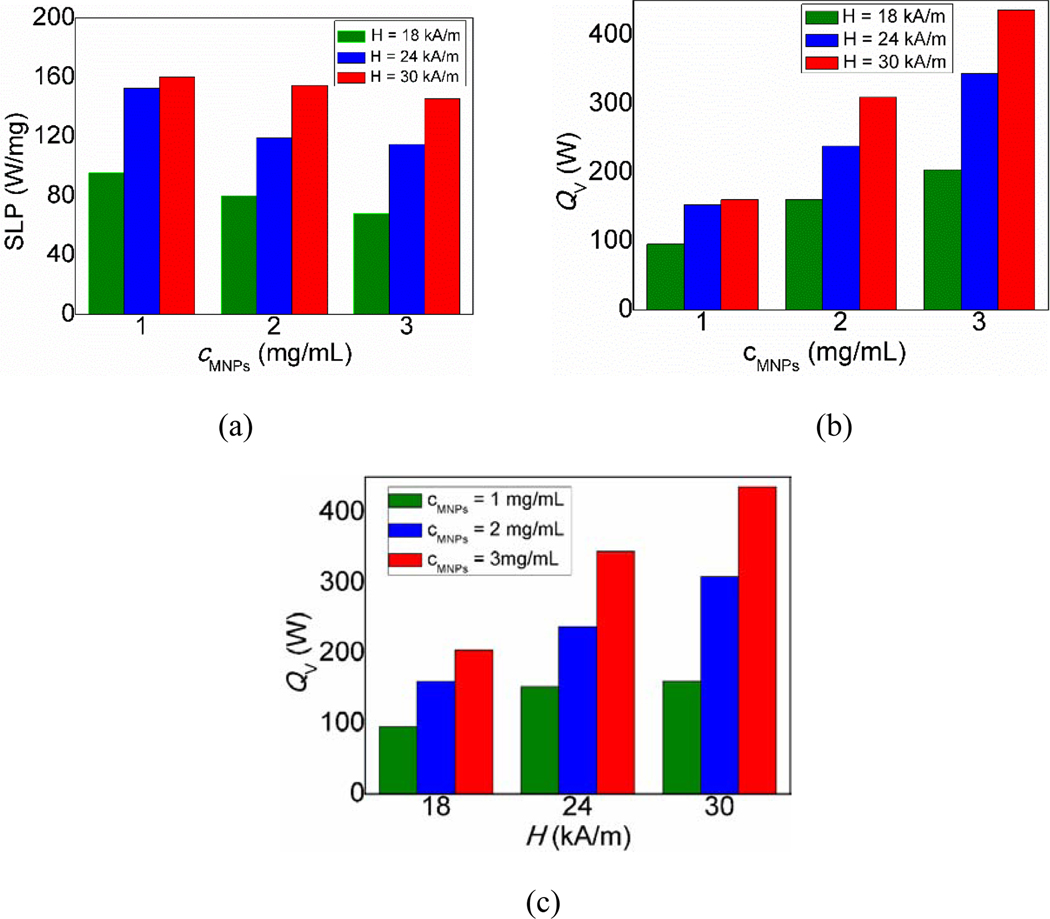
The values of SLP calculated from the initial slope method are tabulated in Table 3. As far as the SLP (W/g) and volumetric power dissipation QV (kW/m3) values are concerned, they both varied positively with AMF strength at a constant MNPs concentration. This is evidenced by the amount of magnetic energy converted into heat energy with increasing AMF strengths, resulting in the increase of SLP values. For the MNPs concentration of 1 mg/mL and for varying AMF strengths of 18 kA/m, 24 kA/m and 30 kA/m, the SLP values of 95.5 mW/mg, 152.4 mW/mg and 160 mW/mg were observed, respectively. A similar trend was observed for the ferrofluid with MNPs concentration equal to 2 mg/mL or 3 mg/mL (Fig. 5(a)). The amount of power dissipated also exhibited a positive relationship with increasing AMF strengths. For instance, for mg/mL of the MNP sample, the dissipated volumetric power of 95.5 kW/m3, 159.8 kW/m3 and 203.8 kW/m3 were measured for AMF strengths of 18 kA/m, 24 kA/m and 30 kA/m, respectively, with a similar tendency for 2 mg/mL or 3 mg/mL MNPs (Fig. 5(b)).
Fig. 5.
Parameters measured from experiments: (a) the effect of AMF strength (H) on SLP values, (b) The effect of AMF strength (H) on volumetric power dissipation (QV), (c) The effect of MNPs concentration (cMNPs) on the volumetric power dissipation (QV).
6.1.2. The effect of MNPs concentration on the temperature
The application of AMF to the ferrofluid with MNPs resulted in increase in the temperature of the solution via manners dependent of the concentrations of MNPs at a fixed AMF strength (Fig. 3). For instance, the temperature increments were observed from 21°C to 25.7°C , from 21°C to 27.7°C and from 21°C to 29.8°C for the concentrations of MNPs for 1 mg/mL, 2 mg/mL and 3 mg/mL, respectively, for 18 kA/m of AMF. Likewise, a positive trend was observed between temperatures rise and MNPs concentration for the fixed AMF strength of 24 kA/m and 30 kA/m. The calculated volumetric power dissipation (kW/m3) showed a positive relationship with increasing concentration of MNPs at a fixed AMF strength (Fig. 5(c)), which can be explained by the increased conversion of electromagnetic energy into heat energy associated with increasing number of nanoparticles in the ferrofluid.
6.2. Numerical Analysis
6.2.1. Temporal distribution of temperature
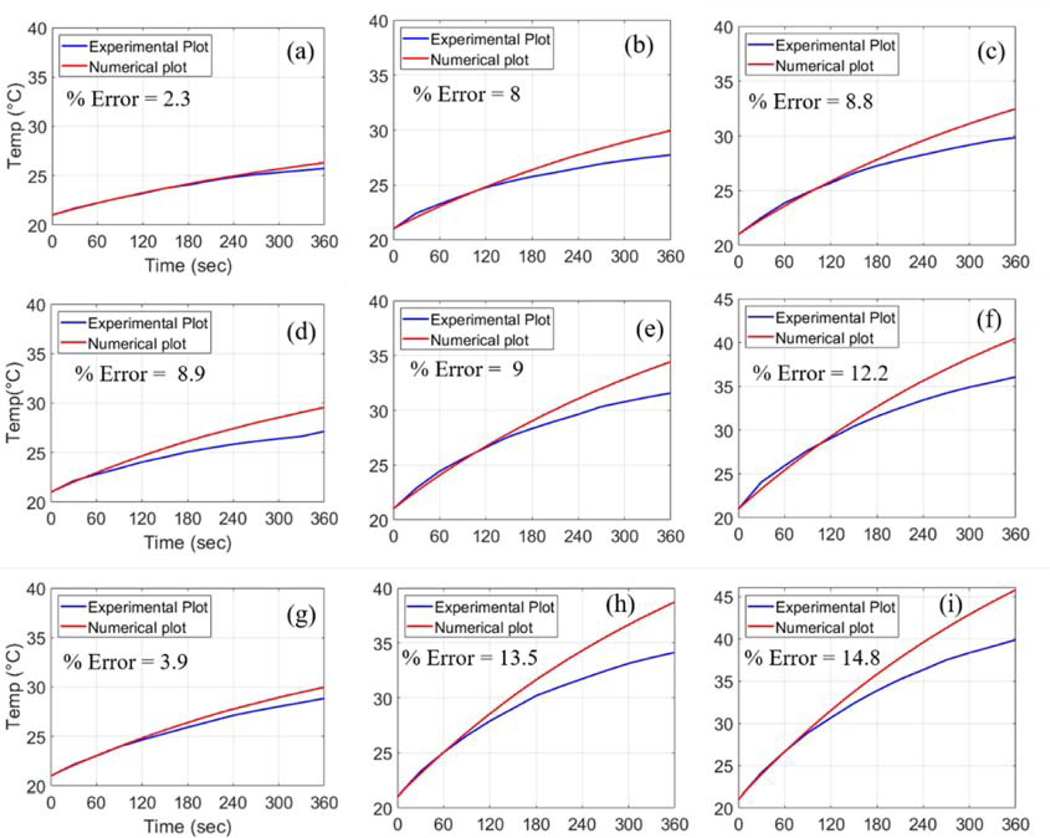
For the comparative analysis of temperature distribution for case I with a bare system, the results from numerical analysis was in good agreement with experimental results for the duration of initial 120 seconds (Fig. 6). However, as time increased, the experimentally measured temperatures were lagging behind the ones from the numerical analysis. The discrepancy in temperature estimation between the experiments and numerical analyses further increased with increasing concentrations of MNPs or AMF strengths. For example, the calculated errors increased from 3.9%, 13.5% and to 14.8% with increasing concentrations of MNPs from 1 mg/mL, 2 mg/mL and to 3 mg/mL, respectively, at the fixed AMF strength of 30 kA/m. Similarly, at the fixed concentration of MNP at 3 mg/mL, the errors increased from 8.8%, 12.2% and to 14.8% with increasing AMF strengths from 18 kA/m, 24 kA/m and to 30 kA/m, respectively. The extent of the errors between experimental results and numerical analysis appeared to be associated with the extent of power dissipation because it was augmented with increasing MNPs concentrations or AMF strengths. Since the ferrofluid in our experimental system was contained in the tube with wall thickness and temperature measurements were performed under non-adiabatic condition, we reasoned that the discrepancy between experimental results and numerical analysis for case I might be due to the potential effects of power dissipation that could occur through the tube wall as well as the surface of the ferrofluid to the surrounding air.
Fig. 6.
Comparative demonstration of the numerical results in the case I for different conditions of magnetic field strength (H) and MNPs concentration (cMNPs): (a) H = 18 kA/m, cMNPs = 1 mg/mL, (b) H = 18 kA/m, cMNPs = 2 mg/mL, (c) H = 18 kA/m, cMNPs = 3 mg/mL, (d) H = 24 kA/m, cMNPs = 1 mg/mL, (e) H = 24 kA/m, cMNPs = 2 mg/mL, (f) H = 24 kA/m, cMNPs = 3 mg/mL, (g) H = 30 kA/m, cMNPs = 1 mg/mL, (h) H = 30 kA/m, cMNPs = 2 mg/mL, (i) H = 30 kA/m, cMNPs = 3 mg/mL.
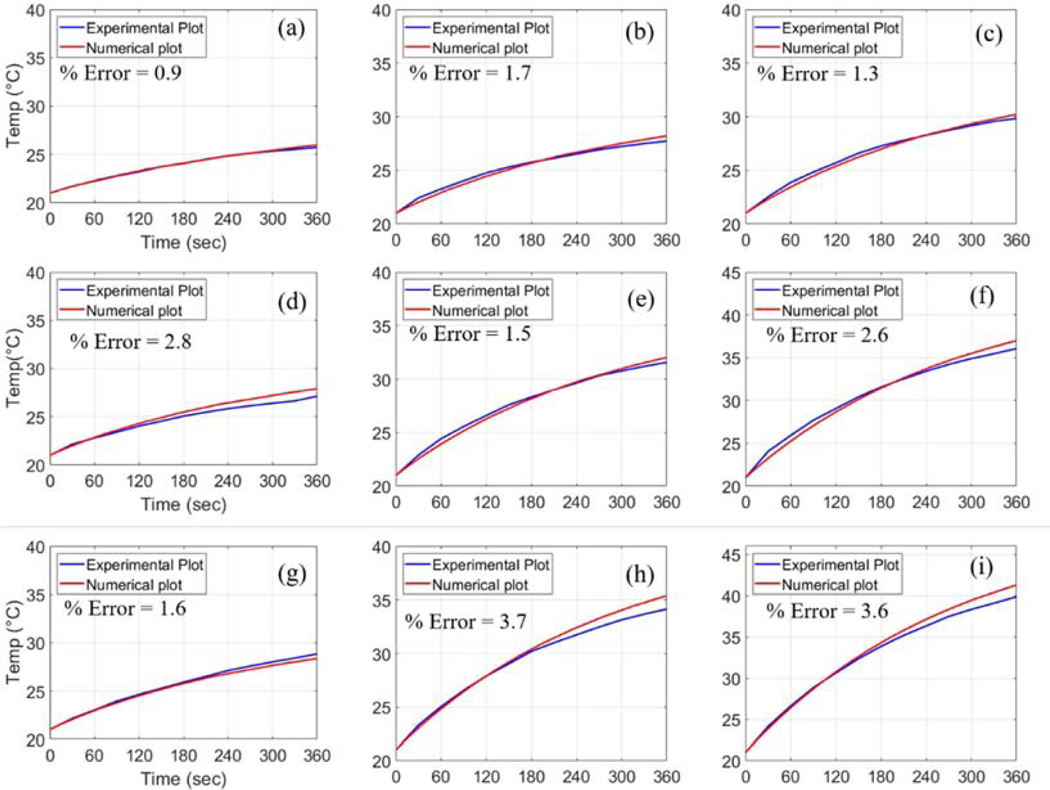
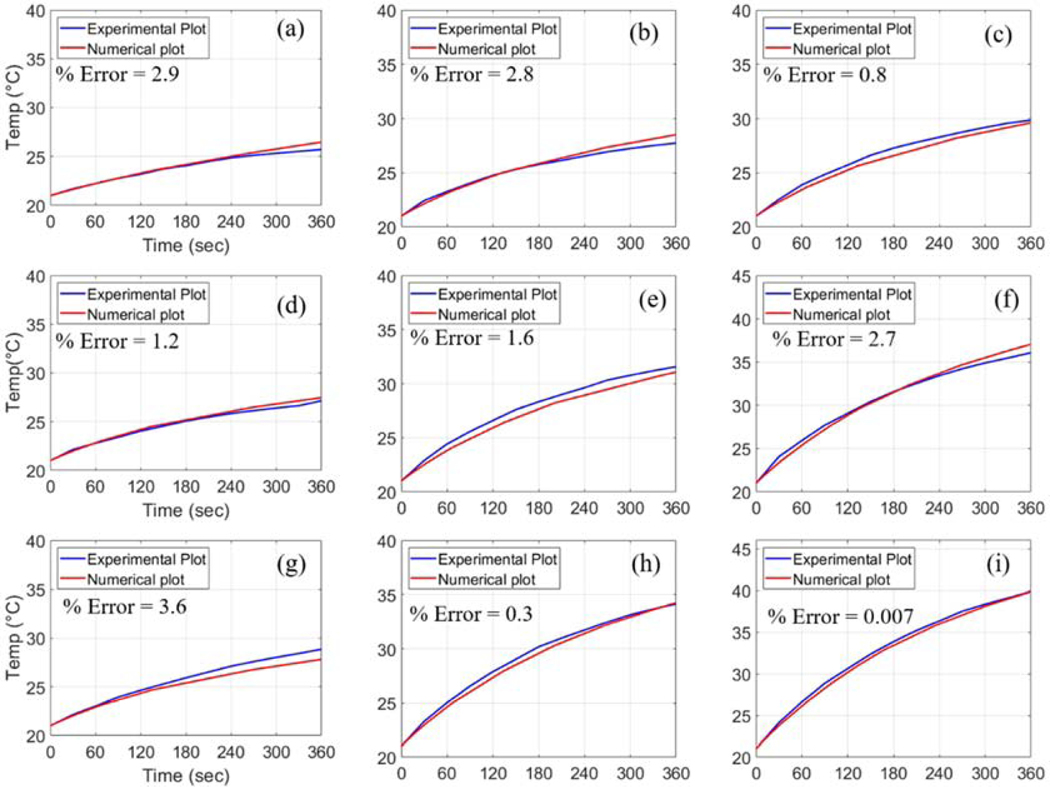
The potential effects of the power dissipation were improved in the numerical models for cases II and III. Our numerical analysis based on the model for case II, which incorporated the effect of heat transfer through the tube wall, significantly improved the estimation on the temporal change of temperature, which was in good agreement with experimental results (Fig. 7). The calculated errors between the experimental results and numerical analysis were less than 3.7% for all the analyzed conditions of MNPs concentrations and AMF strengths. The incorporation of the effect of heat transfer through the tube wall in the modeling resulted in further drop of numerical temperature in the later phase of the simulation (for time above than 120 seconds). This may be due to fact that the tube wall behaved like thermal insulation for the ferrofluid. The measured thickness of the tube used in the experiment was 0.55 mm, which lies between the value of the bare system and wall critical thickness value mm for this kind of experimental setup. Thus, it is likely that higher heat transfer occurred through the tube wall than that for the bared system, resulting in further drop in temperature in the ferrofluid system. Our numerical analysis based on the model for case III, which incorporated the effect of heat radiation through the surface of ferrofluid, mimicking a non-adiabatic condition of the system, also significantly improved the estimation on the temporal change of temperature (Fig. 8). The calculated errors between the experimental results and numerical analysis was less than 3.6% for all the conditions.
Fig. 7.
Comparative demonstration of the numerical results in the case II for different conditions of magnetic field strength (H) and MNPs concentration (cMNPs ): (a) H = 18 kA/m, cMNPs = 1 mg/mL, (b) H = 18 kA/m, cMNPs = 2 mg/mL, (c) H = 18 kA/m, cMNPs = 3 mg/mL, (d) H = 24 kA/m, cMNPs = 1 mg/mL, (e) H = 24 kA/m, cMNPs = 2 mg/mL, (f) H = 24 kA/m, cMNPs = 3 mg/mL, (g) H = 30 kA/m, cMNPs = 1 mg/mL, (h) H = 30 kA/m, cMNPs = 2 mg/mL, (i) H = 30 kA/m, cMNPs = 3 mg/mL.
Fig. 8.
Comparative demonstration of the numerical results in the case III for different conditions of magnetic field strength (H) and MNPs concentration (cMNPs): (a) H = 18 kA/m, cMNPs = 1 mg/mL, (b) H = 18 kA/m, cMNPs = 2 mg/mL, (c) H = 18 kA/m, cMNPs = 3 mg/mL, (d) H = 24 kA/m, cMNPs = 1mg/mL, (e) H = 24 kA/m, cMNPs = 2 mg/mL, (f) H = 24 kA/m, cMNPs = 3 mg/mL, (g) H = 30 kA/m, cMNPs = 1 mg/mL, (h) H = 30 kA/m, cMNPs = 2 mg/mL, (i) H = 30 kA/m, cMNPs = 3 mg/mL.
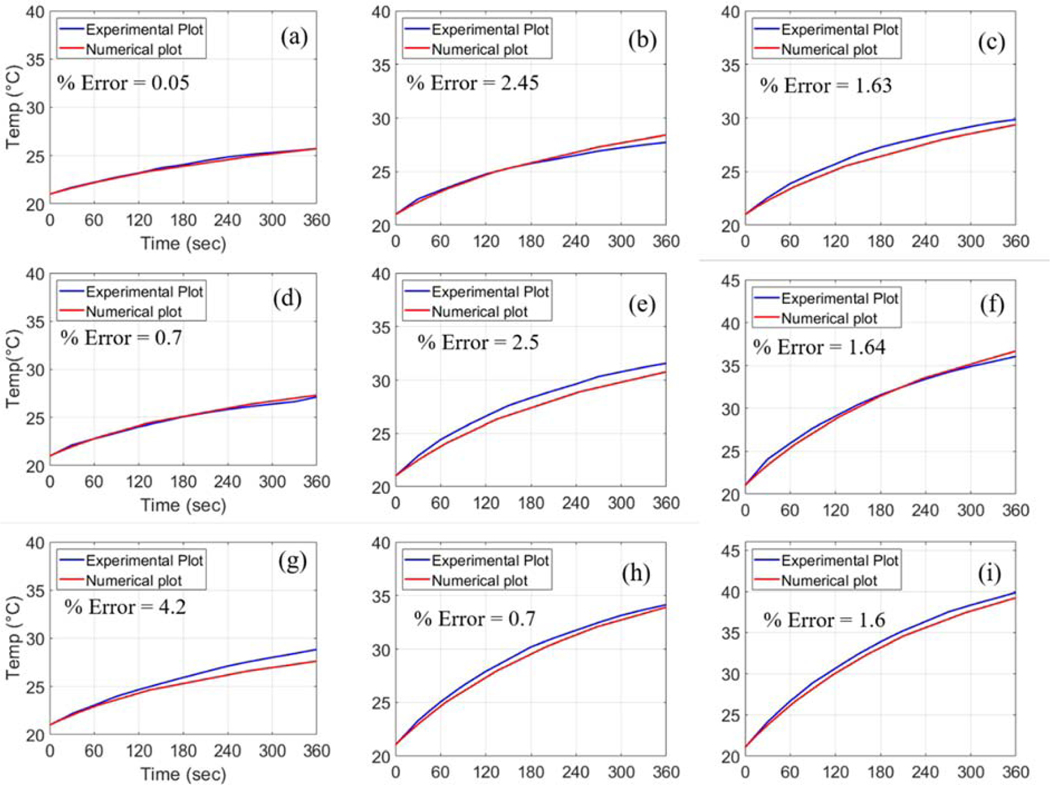
A combined effect of heat transfer through the tube wall and heat radiation on the surface of the ferrofluid was considered in the numerical model of case IV. As shown in Fig. 9, our numerical analysis based on case IV showed a close agreement with the experimental results, resulting in calculated errors ranging from as low as 0.05% to as high as 4.2% for the conditions considered.
Fig. 9.
Comparative demonstration of the numerical results in the case IV for different conditions of magnetic field strength (H) and MNPs concentration (cMNPs): (a) H = 18 kA/m, cMNPs = 1 mg/mL, (b) H = 18 kA/m, cMNPs = 2 mg/mL, (c) H = 18 kA/m, cMNPs = 3 mg/mL, (d) H = 24 kA/m, cMNPs = 1mg/mL, (e) H = 24 kA/m, cMNPs = 2 mg/mL, (f) H = 24 kA/m, cMNPs = 3 mg/mL, (g) H = 30 kA/m, cMNPs = 1 mg/mL, (h) H = 30 kA/m, cMNPs = 2 mg/mL, (i) H = 30 kA/m, cMNPs = 3 mg/mL.
Taken together, our results suggest that in the numerical modeling for magnetic fluid hyperthermia, an appropriate consideration of the potential effects of power dissipation from the ferrofluid system to the surrounding under non-adiabatic condition may be critical for reliable estimation of temperature distribution during the process of hyperthermia.
6.2.2. Spatial distribution of temperature
In the experimental system of the ferrofluid, it was quite challenging to experimentally measure the spatially varying temperature in the system. With our numerical models that showed a close agreement with the experimental results of temporal distribution of temperature, we subsequently engaged in analyses to estimate the spatial distribution of temperature during the application of magnetic fluid hyperthermia. The spatial distribution of the steady state temperature was estimated for four different cases as above, for the given conditions of AMF strength at 30 kA/m and MNPs concentration at 2 mg/mL. The cross-sectional demonstration of temperature distribution was as given in Fig. 10.
Fig. 10.
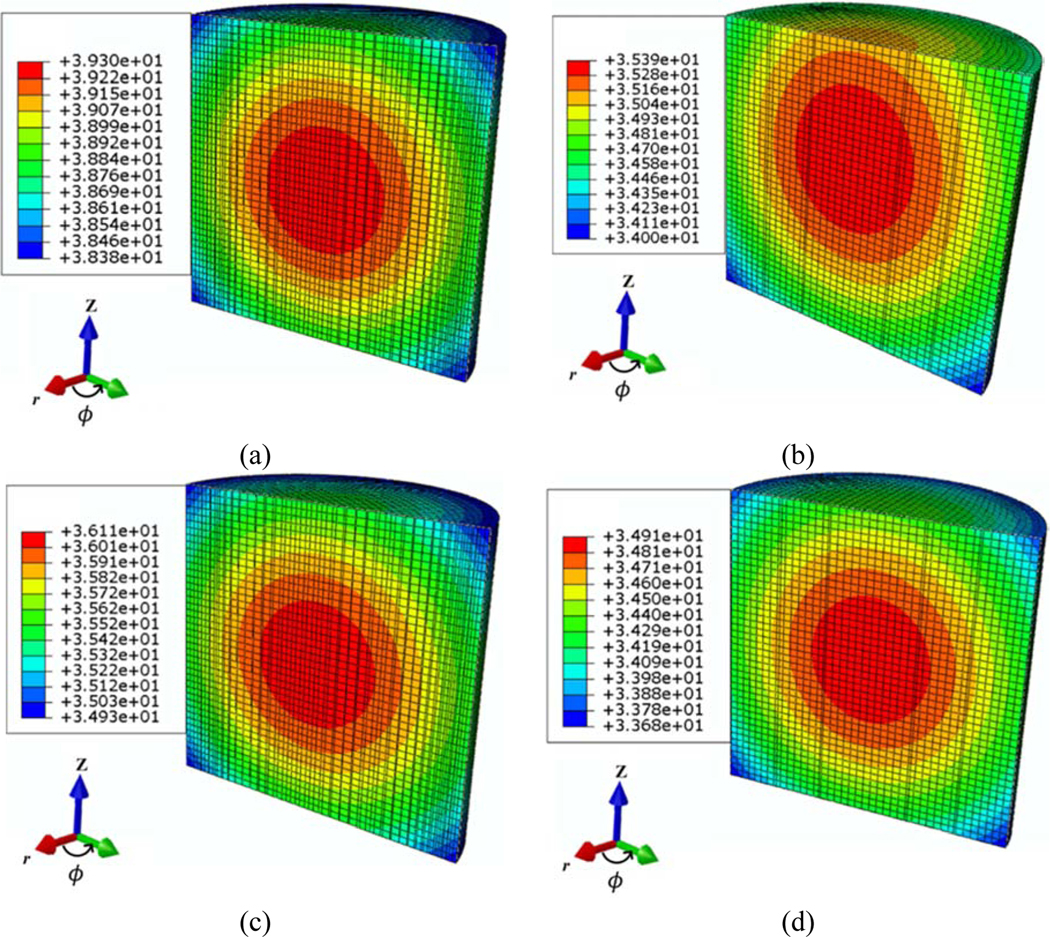
The spatial distribution of steady state temperature in the ferrofluid for MNP/AMF hyperthermia at H = 30 kA/m, and cMNPs = 2 mg/mL for four presented cases including: (a) Case I, (b) Case II, (c) Case III, and (d) Case IV. Temperature are in degree Celsius. The length is 6.42 mm, from the central axis (z = 0), the length is symmetric (3.21 mm) above and below, and internal radius is 3.15 mm in r-direction.
For all the cases considered, the temperature increased towards the central region of the tube, while it decreased toward the boundaries, which is likely due to the prominent effect of heat transfer to the surrounding near the boundaries. Each case showed a different temperature distribution, presumably due to the different boundary conditions. There was a difference in the pattern of spatial temperature distribution between case I (Fig. 10(a)) and case II (Fig. 10(b)). The temperature level decreased towards the surface of fluid by displaying an elliptical pattern for the case II, while it squeezed with a circular pattern for the case I, associated with a steep gradient of temperature distribution for the case I, compared to a shallow gradient of distribution for the case II. This suggests that the model for the case II appropriately represents the effect of heat loss associated with the tube wall. Besides, in the case III (Fig. 10(c)), the temperature was concentrated at the center, however, its level decreased as compared to the case I. A symmetric temperature distribution was observed along the central plane (z = 0) of the system for the cases I and III, and thereby, the position of maximum temperature of both cases was the center, and that of the minimum temperature was the edges. This shows the effect AMF distribution and thermal radiation from the ferrofluid surfaces.
The temperature distribution for the cases II and IV (Fig. 10(d)) is unsymmetrical along the central x-y plane, due to the inclusion of tube wall in the simulation model. For case II the maximum temperature was observed 0.6 mm above the central plane (z = 0), and the minimum temperature was observed at the lower edges of the system. Besides, for the case IV, the maximum temperature point was located slightly 0.15 mm from the central plane, and the minimum temperature was observed at the lower edges of the system. In other words, the overall temperature of case IV was distributed in a spherical pattern slightly trends toward up, which shows the effect of thermal radiation from the outer surfaces.
Although we attribute the heat transfer and thermal radiation between the ferrofluid system and surroundings to a major cause of the heterogeneous distribution of temperature, we do not rule out the possibility that the heterogeneous distribution of magnetic field strength in the ferrofluids, which tends to decrease towards the periphery [22,23,35], also contribute to the temperature distribution.
7. Conclusion
In this study, we predicted the temporal and spatial distribution of temperature in ferrofluids during the application of MNP/AMF hyperthermia by numerical analysis based on finite element method for varying boundary conditions of calorimetric system. The reliability of the models was validated by comparative analysis of temperature distribution between the experimental measurements and numerical analysis. Our results suggest that an appropriate consideration of the effects of power dissipation from the ferrofluid system through the boundaries to the surrounding as well as the consideration of nonadiabatic condition is critical for the development of reliable numerical models for magnetic fluid hyperthermia. Finally, although the application of our model is limited to a magnetic ferrofluid system, our study provides an important insight into the development of numerical models for predicting thermal behaviors for the system with complicated geometry and boundary conditions, such as three-dimensional human tissue or organ models.
Fig. 4.
Variation in the heat transfer with increasing the thickness of the tube.
Highlights.
Numerical modeling of temperature prediction to magnetic fluid hyperthermia
A comparative study of temperature between experimental and numerical analysis
Boundary conditions are important for heat transfer through the ferrofluid system
Power dissipation by MNPs and thermal radiation in a non-adiabatic condition
Acknowledgment
This study was supported by the Basic Science Research Program, through the National Research Foundation of Korea (NRF-2017R1D1A1B03028368), funded by the Ministry of Education (to HK). This study was also supported in part by the National Institute of Health under R01NR015674 (to MK).
Footnotes
Declaration of interests
The authors declare that they have no known competing financial interests or personal relationships that could have appeared to influence the work reported in this paper.
Publisher's Disclaimer: This is a PDF file of an unedited manuscript that has been accepted for publication. As a service to our customers we are providing this early version of the manuscript. The manuscript will undergo copyediting, typesetting, and review of the resulting proof before it is published in its final form. Please note that during the production process errors may be discovered which could affect the content, and all legal disclaimers that apply to the journal pertain.
References
- [1].Giustini AJ, Petryk AA, Cassim SM, Tate JA, Baker I, Hoopes PJ, Magnetic Nanoparticle Hyperthermia in Cancer Treatment, Nano Life. 01 (2010) 17–32. 10.1142/S1793984410000067. [DOI] [PMC free article] [PubMed] [Google Scholar]
- [2].Kim M-H, Yamayoshi I, Mathew S, Lin H, Nayfach J, Simon SI, Magnetic Nanoparticle Targeted Hyperthermia of Cutaneous Staphylococcus aureus Infection, Ann. Biomed. Eng. 41 (2013) 598–609. 10.1007/s10439-012-0698-x. [DOI] [PMC free article] [PubMed] [Google Scholar]
- [3].Alumutairi L, Yu B, Filka M, Nayfach J, Kim M-H, Mild magnetic nanoparticle hyperthermia enhances the susceptibility of Staphylococcus aureus biofilm to antibiotics, Int. J. Hyperth. 37 (2020) 66–75. 10.1080/02656736.2019.1707886. [DOI] [PMC free article] [PubMed] [Google Scholar]
- [4].Skandalakis GP, Rivera DR, Rizea CD, Bouras A, Jesu Raj JG, Bozec D, Hadjipanayis CG, Hyperthermia treatment advances for brain tumors, Int. J. Hyperth. 37 (2020) 3–19. 10.1080/02656736.2020.1772512. [DOI] [PMC free article] [PubMed] [Google Scholar]
- [5].Raouf I, Khalid S, Khan A, Lee J, Kim HS, Kim M-H, A review on numerical modeling for magnetic nanoparticle hyperthermia: Progress and challenges, J. Therm. Biol. 91 (2020) 102644. 10.1016/j.jtherbio.2020.102644. [DOI] [PMC free article] [PubMed] [Google Scholar]
- [6].Kurgan E, Gas P, Methods of Calculation the Magnetic Forces Acting on Particles in Magnetic Fluids, in: 2018 Progress in Applied Electrical Engineering (PAEE), IEEE, Koscielisko, 2018, pp. 1–5. 10.1109/PAEE.2018.8441106. [DOI] [Google Scholar]
- [7].Tang Y, Flesch RCC, Jin T, Numerical analysis of temperature field improvement with nanoparticles designed to achieve critical power dissipation in magnetic hyperthermia, J. Appl. Phys. 122 (2017) 034702. 10.1063/1.4994309. [DOI] [Google Scholar]
- [8].Miaskowski A, Subramanian M, Numerical Model for Magnetic Fluid Hyperthermia in a Realistic Breast Phantom: Calorimetric Calibration and Treatment Planning, Int. J. Mol. Sci. 20 (2019) 4644. 10.3390/ijms20184644. [DOI] [PMC free article] [PubMed] [Google Scholar]
- [9].Arora D, Skliar M, Roemer RB, Model-predictive control of hyperthermia treatments, IEEE Trans. Biomed. Eng. 49 (2002) 629–6 39. 10.1109/TBME.2002.1010846. [DOI] [PubMed] [Google Scholar]
- [10].Lahiri BB, Ranoo S, Philip J, Uncertainties in the estimation of specific absorption rate during radiofrequency alternating magnetic field induced non-adiabatic heating of ferrofluids, J. Phys. D-Appl. Phys. 50 (2017) 455005. 10.1088/1361-6463/aa89de. [DOI] [Google Scholar]
- [11].Kurgan E, Gas P, Simulation of the electromagnetic field and temperature distribution in human tissue in RF hyperthermia, Przeglad Elektrotechniczny. 91(1) (2015) 169–172. 10.15199/48.2015.01.37. [DOI] [Google Scholar]
- [12].Rast L, Harrison JG, Computational Modeling of Electromagnetically Induced Heating of Magnetic Nanoparticle Materials for Hyperthermic Cancer Treatment, PIERS Online. 6 (2010) 690–694. 10.2529/PIERS091218133748. [DOI] [Google Scholar]
- [13].Bakoglidis KD, Simeonidis K, Sakellari D, Stefanou G, Angelakeris M, Size-Dependent Mechanisms in AC Magnetic Hyperthermia Response of Iron-Oxide Nanoparticles, IEEE Trans. Magn. 48 (2012) 1320–1323. 10.1109/TMAG.2011.2173474. [DOI] [Google Scholar]
- [14].Gas P, Miaskowski A, Specifying the ferrofluid parameters important from the viewpoint of magnetic fluid hyperthermia, in: 2015 Selected Problems of Electrical Engineering and Electronics (WZEE), IEEE, Kielce, Poland, 2015, pp. 1–6. 10.1109/WZEE.2015.7394040. [DOI] [Google Scholar]
- [15].Huang S, Wang S-Y, Gupta A, Borca-Tasciuc D-A, Salon SJ, On the measurement technique for specific absorption rate of nanoparticles in an alternating electromagnetic field, Meas. Sci. Technol. 23 (2012) 035701. 10.1088/0957-0233/23/3/035701. [DOI] [Google Scholar]
- [16].Tang Y, Flesch RCC, Jin T, Numerical investigation of temperature field in magnetic hyperthermia considering mass transfer and diffusion in interstitial tissue, J. Phys. D-Appl. Phys. 51 (2018) 035401. 10.1088/1361-6463/aa9b9a. [DOI] [Google Scholar]
- [17].Suriyanto, Ng EYK, Kumar SD, Physical mechanism and modeling of heat generation and transfer in magnetic fluid hyperthermia through Néelian and Brownian relaxation: a review, BioMedical Engineering OnLine. 2017;16. 10.1186/s12938-017-0327-x. [DOI] [PMC free article] [PubMed] [Google Scholar]
- [18].Lahiri BB, Ranoo S, Philip J, Infrared thermography based magnetic hyperthermia study in Fe3O4 based magnetic fluids, Infrared Phys. Techn. 78 (2016) 173–184. 10.1016/j.infrared.2016.08.002. [DOI] [Google Scholar]
- [19].Skumiel A, Hornowski T, Józefczak A, Koralewski M, Leszczyński B, Uses and limitation of different thermometers for measuring heating efficiency of magnetic fluids, Appl. Therm. Eng. 100 (2016) 1308–1318. 10.1016/j.applthermaleng.2016.02.063. [DOI] [Google Scholar]
- [20].Attaluri A, Nusbaum C, Wabler M, Ivkov R, Calibration of a Quasi-Adiabatic Magneto-Thermal Calorimeter Used to Characterize Magnetic Nanoparticle Heating, J. Nanotechnol. Eng. Med. 4 (2013) 011006. 10.1115/1.4024273. [DOI] [Google Scholar]
- [21].Soetaert F, Kandala SK, Bakuzis A, Ivkov R, Experimental estimation and analysis of variance of the measured loss power of magnetic nanoparticles, Sci. Rep. 7 (2017) 1–15. 10.1038/s41598-017-07088-w. [DOI] [PMC free article] [PubMed] [Google Scholar]
- [22].Gas P, Behavior of helical coil with water cooling channel and temperature dependent conductivity of copper winding used for MFH purpose, IOP Conference Series: Earth and Environmental Science. 214 (2019) 012124. 10.1088/1755-1315/214/1/012124. [DOI] [Google Scholar]
- [23].Gas P, Kurgan E, Cooling effects inside water-cooled inductors for magnetic fluid hyperthermia, in: 2017 Progress in Applied Electrical Engineering (PAEE), IEEE, Koscielisko, Poland, 2017, pp. 1–4. 10.1109/PAEE.2017.8008997. [DOI] [Google Scholar]
- [24].Jonasson C, Schaller V, Zeng L, Olsson E, Frandsen C, Castro A, Nilsson L, Bogart LK, Southern P, Pankhurst QA, Puerto Morales M, Johansson C, Modelling the effect of different core sizes and magnetic interactions inside magnetic nanoparticles on hyperthermia performance, Journal of Magnetism and Magnetic Materials. 477 (2019) 198–202. 10.1016/j.jmmm.2018.09.117. [DOI] [Google Scholar]
- [25].Kozissnik B, Bohorquez AC, Dobson J, Rinaldi C, Magnetic fluid hyperthermia: Advances, challenges, and opportunity, Int. J. Hyperth. 29 (2013) 706–714. 10.3109/02656736.2013.837200. [DOI] [PubMed] [Google Scholar]
- [26].Abenojar EC, Wickramasinghe S, Bas-Concepcion J, Samia ACS, Structural effects on the magnetic hyperthermia properties of iron oxide nanoparticles, Prog. Nat. Sci. 26 (2016) 440–448. 10.1016/j.pnsc.2016.09.004. [DOI] [Google Scholar]
- [27].Tang Y, Flesch RCC, Zhang C, Jin T, Numerical analysis of the effect of non-uniformity of the magnetic field produced by a solenoid on temperature distribution during magnetic hyperthermia, J. Magn. Mang. Mater. 449 (2018) 455–460. 10.1016/j.jmmm.2017.10.076. [DOI] [Google Scholar]
- [28].Mehta S, Chauhan KP, Kanagaraj S, Modeling of thermal conductivity of nanofluids by modifying Maxwell’s equation using cell model approach, J. Nanopart. Res. 13 (2011) 2791–2798. 10.1007/s11051-010-0167-0. [DOI] [Google Scholar]
- [29].Khanafer K, Vafai K, A critical synthesis of thermophysical characteristics of nanofluids, Int. J. Heat. Mass Transf. 54 (2011) 4410–4428. 10.1016/j.ijheatmasstransfer.2011.04.048. [DOI] [Google Scholar]
- [30].Lemal P, Geers C, Rothen-Rutishauser B, Lattuada M, Petri-Fink A, Measuring the heating power of magnetic nanoparticles: an overview of currently used methods, Mater. Today Proc. 4 (2017) S107–S117. 10.1016/j.matpr.2017.09.175. [DOI] [Google Scholar]
- [31].Andreu I, Natividad E, Accuracy of available methods for quantifying the heat power generation of nanoparticles for magnetic hyperthermia, Int. J. Hyperth. 29 (2013) 739–751. 10.3109/02656736.2013.826825. [DOI] [PubMed] [Google Scholar]
- [32].Wang S-Y, Huang S, Borca-Tasciuc D-A, Potential Sources of Errors in Measuring and Evaluating the Specific Loss Power of Magnetic Nanoparticles in an Alternating Magnetic Field, IEEE Trans. Magn. 49 (2013) 255–262. 10.1109/TMAG.2012.2224648. [DOI] [Google Scholar]
- [33].Bergman TL, Incropera FP, eds., Fundamentals of heat and mass transfer, 7th ed, Wiley, Hoboken, NJ, 2011. [Google Scholar]
- [34].Gas P, Miaskowski A, Dobrowolski D, Modelling the tumor temperature distribution in anatomically correct female breast phantom, Przeglad Elektrotechniczny. 96(2) (2020) 146–149. 10.15199/48.2020.02.35. [DOI] [Google Scholar]
- [35].Miaskowski A, Sawicki B, Subramanian M, Single-domain nanoparticle magnetic power losses calibrated with calorimetric measurements, Bulletin of the Polish Academy of Sciences-Technical Sciences. 66(4) (2018) 509–516. 10.24425/123928. [DOI] [Google Scholar]


