

Abstract
Background:
The prognostic value of carbohydrate antigen 19-9 (CA19-9) is known to be affected by elevated bilirubin levels in patients with gallbladder carcinoma (GBC). The clinical significance of changes in the ratio of CA19-9 levels to total bilirubin (TB) levels in patients with GBC after curative-intent resection remains unknown. The aim of this study was to determine the prognostic value of changes in preoperative and postoperative CA19-9/TB ratio in these patients.
Methods:
Prospectively collected data on consecutive patients who underwent curative-intent resection for GBC between January 2015 and December 2020 stored in a multicenter database from 10 hospitals were analyzed in this retrospective cohort study. Based on the adjusted CA19-9 defined as the ratio of CA19-9 to TB, and using 2×10³ U/µmol as the upper normal value, patients were divided into a normal group (with normal preoperative and postoperative adjusted CA19-9), a normalization group (with abnormal preoperative but normal postoperative adjusted CA19-9), and a non-normalization group (with abnormal postoperative adjusted CA19-9). The primary outcomes were overall survival (OS) and recurrence-free survival (RFS). The log-rank test was used to compare OS and RFS among the groups. The Cox regression model was used to determine factors independently associated with OS and RFS.
Results:
The normal group (n=179 patients) and the normalization group (n=73 patients) had better OS and RFS than the non-normalization group (n=65 patients) (the 3-year OS rates 72.0%, 58.4% and 24.2%, respectively; the RFS rates 54.5%, 25.5% and 11.8%, respectively; both P<0.001). There were no significant differences between the normal and the normalization groups in OS and RFS (OS, P=0.255; RFS, P=0.130). Cox regression analysis confirmed that the non-normalization group was independently associated with worse OS and RFS. Subgroup analysis revealed that the non-normalization group of patients who received adjuvant therapy had significantly improved OS and RFS as compared to those who did not receive adjuvant therapy (OS, P=0.025; RFS, P=0.003).
Conclusions:
Patients with GBC who underwent curative-intent surgical resection with postoperative abnormal levels of adjusted CA19-9 (the CA19-9/TB ratio) were associated with poorer long-term survival outcomes. Adjuvant therapy after surgery improved the long-term outcomes of these patients.
Keywords: adjuvant therapy, carbohydrate antigen 19-9, curative-intent resection, gallbladder carcinoma
Introduction
Highlights
Adjusted carbohydrate antigen 19-9 (CA19-9) levels effectively reduced the impact of hyperbilirubin on elevated CA19-9 levels.
After curative-intent surgical resection for gallbladder carcinoma (GBC), patients in the normal group (with normal preoperative and postoperative adjusted CA19-9) and the normalization group (with abnormal preoperative but normal postoperative adjusted CA19-9) had significantly better recurrence-free survival (RFS) and overall survival (OS) than the non-normalization group (with abnormal postoperative adjusted CA19-9).
Adjuvant therapy improved the long-term outcomes after curative-intent resection of GBC in patients in the non-normalization group.
Gallbladder carcinoma (GBC) is a biliary malignancy with a poor prognosis. There were an estimated 115,949 new cases of GBC worldwide in 20201. Since 2021, the National Comprehensive Cancer Network (NCCN) has specified that all resectable gallbladder cancers should be treated with radical resection2,3. However, more than a third of these patients develop recurrence, with a median recurrence-free survival of around 9.5 months4,5. The 5-year relative survival rate is less than 20%6. Identification of risk factors affecting prognosis is urgently needed to guide treatment strategies and postoperative follow-up.
Serum tumor markers are clinical data which are generally available. Carbohydrate antigen 19-9 (CA19-9) is now a commonly used tumor marker since it was introduced by Dr Koprowski et al. in 19797. Elevated curves of CA19-9 have been demonstrated to give an ideal prediction of long-term survival in gastrointestinal tumors. Yamashita et al.8 found postoperative CA19-9 level non-normalization to be an independent risk factor for poor overall survival (OS) in patients after biliary tumor surgery. Lee et al.9 found elevated serum CA19-9 levels during palliative chemotherapy to be an independent prognostic factor for poor recurrence-free survival (RFS) and OS in unresectable GBC patients. However, all these previous studies targeted patients with heterogeneous groups of biliary tract tumors or advanced unresectable GBC. It is necessary to conduct a study on GBC patients after curative-intent resection to study the impact of preoperative and postoperative CA19-9 on long-term prognosis. As hyperbilirubinemia can cause biliary inflammation leading to abnormal elevations in CA19-9 levels10,11, this study, therefore, adjusted the level of CA19-9 by using the CA19-9 to total bilirubin ratio.
This study used data from a prospectively collected multicenter database to conduct a retrospective study on the prognostic value of changes in preoperative and postoperative CA19-9/TB ratio in patients with GBC after curative-intent surgical resection and to study the impact of adjuvant therapy in patients with abnormal postoperative adjusted CA19-9 levels to guide postoperative treatment and follow-up strategies.
Methods
Patient selection
The data of this study came from a prospectively collected and maintained multicenter database established by The Biliary Surgery Branch of the Elite Group of Chinese Digestive Surgery (EGCDS), which consisted of 10 tertiary hospitals in China: the First Affiliated Hospital of Army Military Medical University, the Second Affiliated Hospital of Zhejiang University, the First Affiliated Hospital of University of Science and Technology of China, the Affiliated Hospital of Guizhou Medical University, Henan Provincial Tumor Hospital, the First Affiliated Hospital of Xi 'an Jiaotong University, the First Affiliated Hospital of Air Force Military Medical University, the First Affiliated Hospital of Sun Yat-sen University, the Second Affiliated Hospital of Chongqing Medical University, and the First Hospital of Lanzhou University.
The data on all consecutive patients who underwent curative-intent resection for a newly diagnosed GBC from January 2015 to December 2020 was analyzed in this study. The diagnosis of GBC was confirmed by postoperative pathological examinations. The same inclusion and exclusion criteria were used for all these patients. The exclusion criteria were patients: (a) who underwent neoadjuvant therapy; (b) with TB >100 µmol/l; (c) with postoperative death within 30 days of surgery; (d) loss to follow-up after discharge from hospital; (e) without preoperative or postoperative CA19-9 measurements; and (f) with preoperative CA19-9 <5 U/ml as these patients were defined as CA19-9 non-secretor patients12. This retrospective study was conducted in accordance with the Declaration of Helsinki. Approval for this study was obtained from the Ethics Committees of all the participating hospitals and it was finally approved by the Institutional Review Board of the Southwest Hospital of Chongqing, China (No. KY2022217). All patients provided written informed consent prior to receiving treatment. This study was registered with ResearchRegistry.com (Unique Identification Number: researchregistry9607). The data was reported in line with the STROCSS 2021 criteria13 (Supplemental Digital Content 1, http://links.lww.com/JS9/C349).
Perioperative management and surgical procedure
All patients underwent preoperative examinations, including contrast-enhanced computed tomography (CT) imaging, magnetic resonance cholangiopancreatography (MRCP), liver and kidney function tests, coagulation function tests, and CA19-9 measurements. Percutaneous transhepatic cholangial drainage (PTCD) was performed in all patients presenting with obstructive jaundice before surgery, and the total bilirubin (TB) was reduced to a safe level before surgery.
Based on the NCCN recommendations, curative-intent resection was defined as surgical resection consisting of at least cholecystectomy, hepatectomy, and lymph node dissection14. There were three types of hepatectomy, namely, right hemihepatectomy, segments 4B+5 resection, and wedge hepatectomy. Right hemihepatectomy was defined as the resection of Couinaud liver segments 5–8, based on the H5678 definition of the ‘New world’ hepatectomy terminology15,16. Segments 4B+5 resection was defined as anatomic resection of Couinaud’s liver segments 4B+517. Wedge hepatectomy was defined as hepatectomy of the gallbladder fossa with a 3–4 cm margin in the liver17. Additional procedures, such as vascular reconstruction, common bile duct resection, hepaticopancreaticoduodenectomy, and choledochojejunostomy, were performed based on the discretion of the surgical team according to the extent of tumor invasion.
As this study was a multicenter research project, surgical instruments and procedures would vary among the different participating hospitals. To ensure consistency of the surgical skill as much as possible, all chief surgeons of the operating surgical teams were experienced hepatobiliary surgeons with extensive operating experience in GBC surgery. All participating hospitals in this study performed over 100 level four hepatobiliary and pancreatic surgeries (such as liver resection) annually. Complete resection of the tumor under gross examination was defined as a curative-intent resection. Postoperative histopathological examination showing positive resection margins was defined as R1 resection, with negative resection margins as R0 resection.
The Enhanced Recovery After Surgery (ERAS) principle was followed to promote rapid recovery of patients. After surgery, vital signs and liver and kidney functions were closely monitored, and upper abdominal contrast-enhanced CT and CA19-9 were regularly reviewed. According to the patient’s wishes, the degree of tumor differentiation, lymph node status, and whether R0 resection was achieved, the postoperative adjuvant treatment plan was then formulated.
Data collection
The demographic, laboratory, operative, pathological, and other variable data in the multicenter databases were collected prospectively and maintained dynamically. The demographic variables included age, sex, body mass index (BMI), incidental GBC, gallbladder disease, and preoperative PTCD. The laboratory variables included alanine aminotransferase (ALT), albumin (ALB), international normalized ratio (INR), CA19-9, and total bilirubin (TB). The operative variables included the extent of liver resection and resection margin status. The pathological variables included tumor differentiation, macrovascular invasion, choledochal invasion, lymph node invasion, and the 8th American Joint Committee on Cancer (AJCC) staging18. In addition, data on adjuvant therapy was also collected.
Both portal vein invasion and hepatic artery invasion were considered macrovascular invasions. There were three types of hepatectomy, namely, right hemihepatectomy, segments 4B+5 resection, and wedge hepatectomy. All laboratory variables were collected within one week prior to surgery. Additionally, TB and CA19-9 levels were also collected once within 4–6 weeks after surgery and before adjuvant therapy.
All adjuvant therapy records were obtained from the outpatient or telephone follow-up records. Adjuvant therapy includes adjuvant chemotherapy alone or in combination with radiotherapy, immunotherapy, and targeted therapy. The specific adjuvant therapy plan is shown in Supplementary Table S1 (Supplemental Digital Content 2, http://links.lww.com/JS9/C350).
Definition of variables
The upper or lower limit of normal values was used to divide patients into the normal and high/low groups. These values included 24 kg/m2 for BMI, 40 U/l for ALT, 35 g/l for ALB, 1.15 for INR, 17 µmol/l for TB, and 37 U/ml for CA19-9.
To incorporate the impact of elevated TB on CA19-9 levels, this study used adjusted CA19-9, which was defined as adjusted CA19-9 (×103 U/µmol)=CA19-9 (U/ml)/TB (µmol/l). Based on the upper limits of the normal ranges of CA19-9 (37 U/l) and TB (17 µmol/l), the adjusted CA19-9 >2×10³ U/µmol was considered to indicate abnormal elevation in this study. Patients were then divided into three groups based on the adjusted CA19-9 levels before and after surgery: the normal group with preoperative and postoperative adjusted CA19-9 levels being normal; the normalization group with abnormal preoperative but normal postoperative adjusted CA19-9; and the non-normalization group with postoperative adjusted CA19-9 levels being abnormally elevated.
Survival outcomes on follow-up
The primary outcomes were overall survival (OS) and recurrence-free survival (RFS). OS was computed as the interval from the date of surgery to the date of death or the last follow-up. RFS was computed as the interval from the date of resection to the day of diagnosis of tumor recurrence for patients with tumor recurrence, or from the day of resection to the date of death, or the date of last follow-up for patients without tumor recurrence.
All patients received a defined protocol of strict supervision and follow-up at outpatient clinics. The postoperative surveillance strategy involved history taking, physical examination, abdominal ultrasonography, and laboratory tests once every 2–3 months in the first and second years after resection, once every 3–4 months for the third to the fifth year, and then once every 6 months. At each follow-up visit, tumor markers including carcinoembryonic antigen (CEA) and CA19-9, and CT and/or magnetic resonance cholangiopancreatographic examinations were performed. Tumor recurrence was diagnosed based on the combination of clinical findings, tumor markers, and imaging examinations.
Treatment options for tumor recurrence included PTCD, endoscopic nasobiliary drainage (ENBD), systemic/regional therapies, repeat surgery, or follow-up observation, depending on the tumor extent and the patient’s conditions. The data of this study was analyzed up to 31 December 2022.
Statistical analysis
All data analyses were performed using SPSS software version 27.0 (IBM Corp., Armonk, NY, USA) and R software (version 4.3.0. http://www.r-project.org/). For the individual missing data for some patients, this study adopted the maximum likelihood estimation to impute the missing data. The number of missing values is shown in Supplementary Table S2 (Supplemental Digital Content 3, http://links.lww.com/JS9/C351). Normally distributed continuous data were presented as mean±SD, and comparisons between groups were performed using Student’s t test. Non-normally distributed continuous data were presented as median (quartile) and comparisons between groups were performed using the Kruskal–Wallis test. Categorical variables were expressed as numbers and percentages, and the χ2 test or Fisher’s exact test was used as appropriate. The pairwise log-rank test was used to compare survival rates among the three groups. Bonferroni was used to avoid the inflation of type I errors. After correction, a P<0.017 was considered to indicate a significant difference. The log-rank test was employed to compare the survival rates between the normal group and the normalization group, as well as between the normal group and the non-normalization group. Univariable and multivariable analyses were performed using the Cox regression with forward stepwise variable selection to identify factors in predicting OS and RFS. Variables significant at a P<0.1 in univariable analysis were entered into the multivariable Cox regression analysis. Further analysis was conducted to assess the impact of adjuvant therapy on OS and RFS among the three groups. All P values reported were two-sided, and a P<0.05 was considered statistically significant.
Results
Patient selection
Of 905 GBC patients who were operated during the study period, 317 patients were eligible and included in this study. Patients were excluded because of receiving neoadjuvant therapy (n=16), TB >100 µmol/l (n=31), died within 30 days postoperatively (n=17), loss to follow-up after discharge from the hospital (n=50), without preoperative CA19-9 (n=48), without postoperative CA19-9 (n=418), and CA19-9 non-secretor patients (n=8). The study process and patient selection are shown in Figure 1. The average age of the patients in the study was 62.2±10.7 years. There were 125 patients who had a previous history of gallbladder disease, and 63 patients had incidental GBC.
Figure 1.
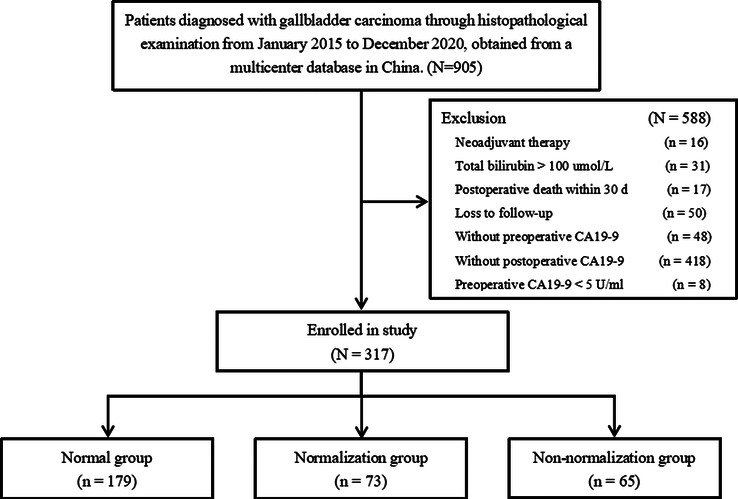
Flowchart of patient inclusion.
Baseline data
The normal group consisted of 179 patients, the normalization group 73 patients, and the non-normalization group 65 patients.
The baseline data among the three groups of patients are shown in Table 1. There were significant differences among the three groups of patients in ALT levels, preoperative and postoperative CA19-9 levels, preoperative and postoperative adjusted CA19-9 levels, macrovascular invasion, common bile duct invasion, lymph node invasion, and 8th AJCC stage III/IV. There were no significant differences in the remaining baseline data.
Table 1.
Baseline characteristics among the normal, normalization, and non-normalization groups of gallbladder carcinoma patients.
| Variables | Normal group (n=179) | Normalization group (n=73) | Non-normalization group (n=65) | P |
|---|---|---|---|---|
| Age >60 years | 113 (63.1%) | 52 (71.2%) | 40 (61.5%) | 0.398 |
| Female | 109 (60.9%) | 48 (65.8%) | 43 (66.2%) | 0.652 |
| BMI ≥24 kg/m2 | 74 (41.3%) | 29 (39.7%) | 32 (49.2%) | 0.465 |
| Incidental gallbladder carcinoma | 34 (19.0%) | 18 (24.7%) | 11 (16.9%) | 0.474 |
| Gallbladder disease | 67 (37.4%) | 28 (38.4%) | 30 (46.2%) | 0.457 |
| Preoperative PTCD | 6 (3.4%) | 4 (5.5%) | 6 (9.2%) | 0.176 |
| Preoperative ALT >40 U/l | 42 (23.5%) | 27 (37.0%) | 27 (41.5%) | 0.009 |
| Preoperative ALB <35 g/l | 29 (16.2%) | 11 (15.1%) | 11 (16.9%) | 0.955 |
| Preoperative INR >1.15 | 14 (7.8%) | 2 (2.7%) | 2 (3.1%) | 0.171 |
| Preoperative TB (µmol/l) | 15.60 (11.0–20.90) | 11.93 (8.83–18.90) | 13.30 (9.90–35.30) | 0.029 |
| Preoperative TB >17 µmol/l | 69 (38.5%) | 21 (28.8%) | 23 (35.4%) | 0.441 |
| Preoperative CA19-9 (U/ml) | 9.05 (4.73–14.20) | 120.92 (38.18–336.95) | 209.21 (63.90–872.05) | <0.001 |
| Preoperative CA19-9 >37 U/ml | 8 (4.5%) | 56 (76.7%) | 51 (78.5%) | <0.001 |
| Postoperative CA19-9 (U/ml) | 8.16 (3.85–13.89) | 15.50 (8.87–23.14) | 249.87 (99.58–840.32) | <0.001 |
| Postoperative TB (µmol/l) | 16.60 (12.00–25.26) | 17.20 (11.16–25.90) | 14.00 (11.24–17.70) | 0.255 |
| Postoperative TB >17 µmol/l | 80 (48.8%) | 36 (52.2%) | 20 (36.4%) | 0.179 |
| Postoperative CA19-9 >37 U/ml | 1 (0.6%) | – | 65 (100%) | <0.001 |
| Preoperative adjusted CA19-9 (×103 U/µmol)a | 0.66 (0.26–0.98) | 6.86 (2.86–19.73) | 11.52 (2.69–27.89) | <0.001 |
| Postoperative adjusted CA19-9 (×103 U/µmol)a | 0.39 (0.18–0.66) | 0.74 (0.42–1.10) | 11.90 (4.74–40.02) | <0.001 |
| Right hemihepatectomy | 4 (2.2%) | 4 (5.5%) | 5 (7.7%) | 0.131 |
| Poor tumor differentiation | 64 (35.8%) | 24 (32.9%) | 24 (36.9%) | 0.870 |
| Vascular invasion | 8 (4.5%) | 6 (8.2%) | 15 (23.1%) | <0.001 |
| Common bile duct invasion | 25 (14.0%) | 12 (16.4%) | 26 (40.0%) | <0.001 |
| Lymph node invasion | 50 (27.9%) | 19 (26.0%) | 41 (63.1%) | <0.001 |
| 8th AJCC T stage | <0.001 | |||
| T1 | 41 (22.9%) | 14 (19.2%) | 5 (7.7%) | |
| T2 | 101 (56.4%) | 36 (49.3%) | 13 (2.0%) | |
| T3 | 29 (16.2%) | 17 (23.3%) | 32 (49.2%) | |
| T4 | 8 (4.5%) | 6 (8.2%) | 15 (23.1%) | |
| 8th AJCC stage III–IV | 88 (49.2%) | 37 (50.7%) | 57 (87.7%) | <0.001 |
| R1 resection | 11 (6.1%) | 4 (5.5%) | 8 (12.3%) | 0.208 |
| Adjuvant therapy | 61 (34.1%) | 29 (39.7%) | 25 (38.5%) | 0.643 |
Values are expressed as median (quartile); adjusted CA19-9=CA19-9/TB.
AJCC, American Joint Committee on Cancer; ALB, albumin; ALT, alanine aminotransferase; BMI, body mass index; CA19-9, carbohydrate antigen 19-9; INR, international normalized ratio; PTCD, percutaneous transhepatic cholangial drainage; TB, total bilirubin.
Survival outcomes
The median follow-up time for all patients was 14.3 months. The median follow-up time for the normal group was 16.1 months, the median follow-up time for the normalization group was 16.2 months, and the median follow-up time for the non-normalization group was 9.2 months. The 3-year OS and RFS rates of the normal group were 72.0% and 54.5%, respectively. The corresponding rates of the normalization group were 58.4% and 25.5%, respectively, and of the non-normalization group were 24.2% and 11.8%, respectively. The survival rates of the three groups were significantly different. While the OS and RFS rates of the normal and normalization groups showed no significant differences (OS, HR: 1.40, 95% CI: 0.79–2.50, P=0.255; RFS, HR: 1.39, 95% CI: 0.91–2.14, P=0.130), the rates of the normal and non-normalization groups were markedly different (OS, HR: 3.50, 95% CI: 2.11–5.81, P<0.001; RFS, HR: 3.23, 95% CI: 2.20–4.71, P<0.001) (Fig. 2). In addition, the survival rates of the normalization and non-normalization groups were also markedly different (OS, HR: 2.51, 95% CI: 1.39–4.55 P=0.002; RFS, HR: 2.25, 95% CI: 1.44–3.54, P<0.001). Patients in the non-normalization group had significantly worse OS and RFS than those in the other two groups.
Figure 2.
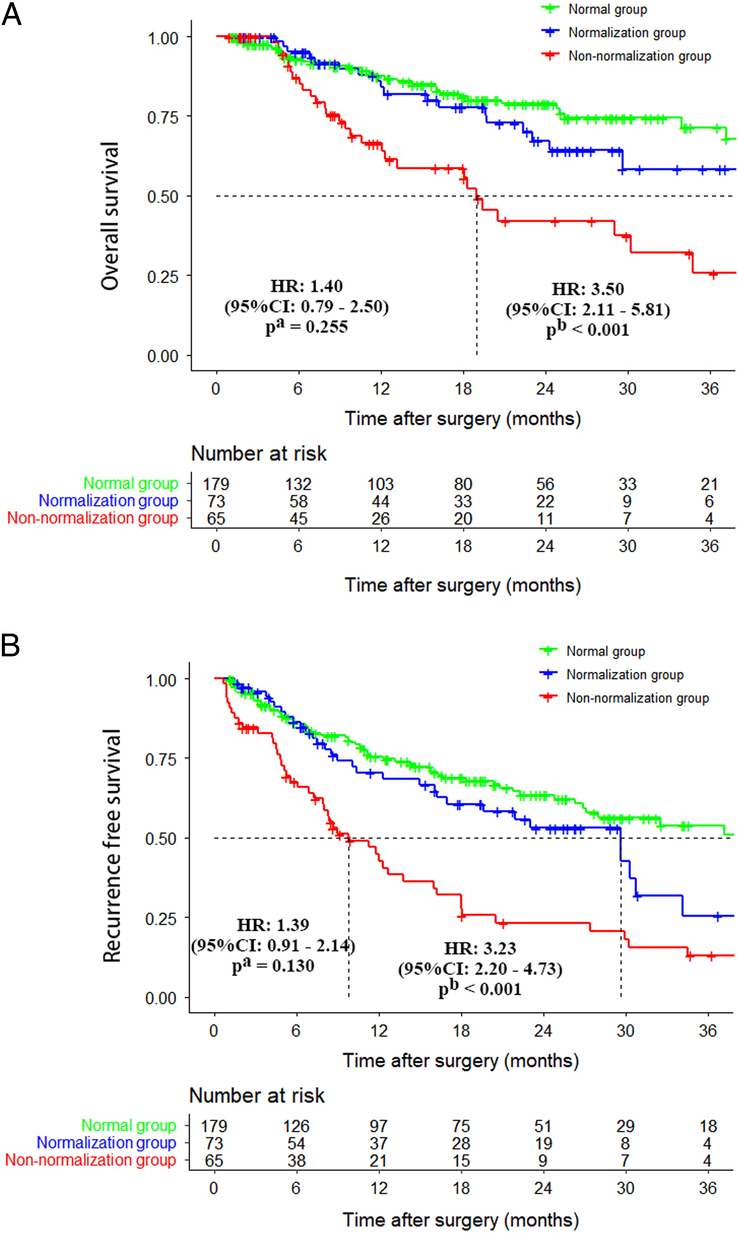
Comparison of overall survival and recurrence-free survival curves among patients in the normal group, normalization group, and non-normalization group. (A) Overall survival; (B) recurrence-free survival. Note: a, the normal group versus the normalization group; b, the normal group versus the non-normalization group.
Independent risk factors affecting OS and RFS
Univariate analysis indicated that preoperative PTCD, R1 resection, poor tumor differentiation, vascular invasion, choledochal invasion, lymph node metastasis, 8th AJCC stage III/IV, non-normalization group, and adjuvant therapy were potential factors affecting OS (P<0.10). Multivariate analysis revealed that R1 resection, poor tumor differentiation, 8th AJCC stage III/IV, and the non-normalization group were independently associated with poorer OS (P<0.05) (Table 2).
Table 2.
Univariable and multivariable Cox regression analysis of predictors of overall survival in patients following curative-intent resection for gallbladder carcinoma.
| Univariable analysis | Multivariable analysis | ||||
|---|---|---|---|---|---|
| Variables | Reference | HR (95% CI) | P | HR (95% CI) | P |
| Age >60 years | Age ≤60 years | 1.106 (0.695–1.761) | 0.671 | ||
| Female | Male | 0.960 (0.616–1.498) | 0.859 | ||
| BMI ≥24 kg/m2 | BMI <24 kg/m2 | 1.054 (0.675–1.647) | 0.817 | ||
| Incidental gallbladder carcinoma | Non-incidental gallbladder carcinoma | 1.279 (0.718–2.281) | 0.404 | ||
| Gallbladder disease | No gallbladder disease | 1.177 (0.756–1.832) | 0.471 | ||
| Preoperative PTCD | No preoperative PTCD | 3.191 (1.519–6.703) | 0.020 | 1.912 (0.879–4.159) | 0.102 |
| Preoperative ALT >40 U/l | Preoperative ALT ≤40 U/l | 1.210 (0.761–1.926) | 0.421 | ||
| Preoperative ALB <35 g/l | Preoperative ALB ≤35 g/l | 1.332 (0.777–2.284) | 0.297 | ||
| Preoperative INR >1.15 | Preoperative INR ≤1.15 | 0.971 (0.392–2.405) | 0.949 | ||
| Preoperative TB >17 µmol/l | Preoperative TB ≤17 µmol/l | 1.296 (0.832–2.020) | 0.252 | ||
| Preoperative CA19-9 >37 U/ml | Preoperative CA19-9 ≤37 U/ml | 2.214 (1.416–3.463) | <0.001 | ||
| Postoperative CA19-9 >37 U/ml | Postoperative CA19-9 ≤37 U/ml | 2.272 (1.409–3.664) | <0.001 | ||
| Right hemihepatectomy | Wedge/IVB+V liver segments resection | 1.791 (0.722–4.439) | 0.209 | ||
| R1 resection | R0 resection | 3.944 (2.066–7.530) | <0.001 | 2.481 (1.256–4.901) | 0.009 |
| Poor tumor differentiation | Well/moderate tumor differentiation | 1.735 (1.114–2.704) | 0.015 | 1.694 (1.080–2.656) | 0.022 |
| Vascular invasion | No vascular invasion | 2.386 (1.333–4.271) | 0.003 | ||
| Choledochal invasion | No choledochal invasion | 2.708 (1.699–4.314) | <0.001 | ||
| Lymph node metastasis | No lymph node metastasis | 3.455 (2.193–5.443) | <0.001 | ||
| 8th AJCC stage III/IV | 8th AJCC stage I/II | 2.740 (1.597–4.581) | <0.001 | 1.993 (1.137–3.492) | 0.016 |
| Normalization group | Normal group | 1.399 (0.785–2.495) | 0.255 | 1.421 (0.796–2.537) | 0.235 |
| Non-normalization group | Normal group | 3.500 (2.107–5.813) | <0.001 | 2.542 (1.470–4.396) | <0.001 |
| Adjuvant therapy | No adjuvant therapy | 0.637 (0.387–1.050) | 0.077 | 0.613 (0.367–1.025) | 0.062 |
AJCC, American Joint Committee on Cancer; ALB, albumin; ALT, alanine aminotransferase; BMI, body mass index; CA19-9, carbohydrate antigen 19-9; CI, confidence interval; HR, hazard ratio; INR, international normalized ratio; PTCD, percutaneous transhepatic cholangial drainage; TB, total bilirubin.
Univariate analysis also indicated that preoperative PTCD, R1 resection, poor tumor differentiation, vascular invasion, choledochal invasion, lymph node metastasis, 8th AJCC stage III/IV, non-normalization group, and adjuvant therapy were potential factors affecting RFS (P<0.10). Multivariate analysis revealed R1 resection, poor tumor differentiation, 8th AJCC stage III/IV, and non-normalization group to be independently associated with poorer RFS (P<0.05) (Table 3).
Table 3.
Univariable and multivariable Cox regression analysis of predictors of recurrence-free survival in patients following curative resection for gallbladder carcinoma.
| Univariable analysis | Multivariable analysis | ||||
|---|---|---|---|---|---|
| Variables | Reference | HR (95% CI) | P | HR (95% CI) | P |
| Age >60 years | Age ≤60 years | 1.161 (0.728–1.851) | 0.530 | ||
| Female | Male | 0.898 (0.576–1.400) | 0.635 | ||
| BMI ≥24 kg/m2 | BMI <24 kg/m2 | 1.157 (0.739–1.810) | 0.524 | ||
| Incidental gallbladder carcinoma | Non-incidental gallbladder carcinoma | 1.267 (0.711–2.258) | 0.423 | ||
| Gallbladder disease | No gallbladder disease | 1.219 (0.782–1.900) | 0.382 | ||
| Preoperative PTCD | No preoperative PTCD | 1.860 (0.941–3.675) | 0.074 | 1.128 (0.558–2.280) | 0.737 |
| Preoperative ALT >40 U/l | Preoperative ALT ≤40 U/l | 1.194 (0.752–1.898) | 0.453 | ||
| Preoperative ALB <35 g/l | Preoperative ALB ≤35 g/l | 1.274 (0.744–2.183) | 0.378 | ||
| Preoperative INR >1.15 | Preoperative INR ≤1.15 | 0.988 (0.399–2.450) | 0.980 | ||
| Preoperative TB >17 µmol/l | Preoperative TB ≤17 µmol/l | 1.232 (0.789–1.922) | 0.359 | ||
| Preoperative CA19-9 >37 U/ml | Preoperative CA19-9 ≤37 U/ml | 2.432 (1.611–3.672) | <0.001 | ||
| Postoperative CA19-9 >37 U/ml | Postoperative CA19-9 ≤37 U/ml | 2.536 (1.642–3.915) | < 0.001 | ||
| Right hemihepatectomy | Wedge/IVB+V liver segments resection | 2.031 (0.818–5.045) | 0.127 | ||
| R1 resection | R0 resection | 2.753 (1.570–4.828) | <0.001 | 2.075 (1.164–3.698) | 0.013 |
| Poor tumor differentiation | Well/moderate tumor differentiation | 1.393 (0.955–1.949) | 0.054 | 1.430 (1.019–2.006) | 0.038 |
| Vascular invasion | No vascular invasion | 2.830 (1.585–5.053) | <0.001 | ||
| Choledochal invasion | No choledochal invasion | 2.637 (1.669–4.166) | <0.001 | ||
| Lymph node metastasis | No lymph node metastasis | 3.406 (2.164–5.360) | <0.001 | ||
| 8th AJCC stage III/IV | 8th AJCC stage I/II | 2.124 (1.472–3.065) | <0.001 | 1.556 (1.049–2.308) | 0.028 |
| Normalization group | Normal group | 1.392 (0.907–2.137) | 0.130 | 1.421 (0.925–2.182) | 0.109 |
| Non-normalization group | Normal group | 3.226 (2.201–4.726) | <0.001 | 2.654 (1.766–3.989) | <0.001 |
| Adjuvant therapy | No adjuvant therapy | 1.362 (0.949–1.954) | 0.093 | 0.758 (0.525–1.095) | 0.140 |
AJCC, American Joint Committee on Cancer; ALB, albumin; ALT, alanine aminotransferase; BMI, body mass index; CA19-9, carbohydrate antigen 19-9; CI, confidence interval; HR, hazard ratio; INR, international normalized ratio; PTCD, percutaneous transhepatic cholangial drainage; TB, total bilirubin.
The impact of adjuvant therapy on OS and RFS
For all the patients included in the study, 115 patients (36.3%) received adjuvant therapy, with 61 patients (34.1%) in the normal group, 29 patients (39.7%) in the normalization group, and 25 patients (38.5%) in the non-normalization group.
The 3-year OS rates for patients who received adjuvant therapy in the normal, normalization, and non-normalization groups were 67.3%, 69.3%, and 43.6%, respectively, while for those who did not receive adjuvant therapy, the 3-year OS rates were 74.2%, 51.7%, and 16.1%, respectively. For the non-normalization group, the 3-year OS rate in patients who received adjuvant therapy was significantly higher than those patients who did not receive adjuvant therapy (HR: 0.33, 95% CI: 0.12–0.87, P=0.025). In the other two groups, there were no significant differences in OS in patients who received or did not receive adjuvant therapy (Fig. 3A–C).
Figure 3.
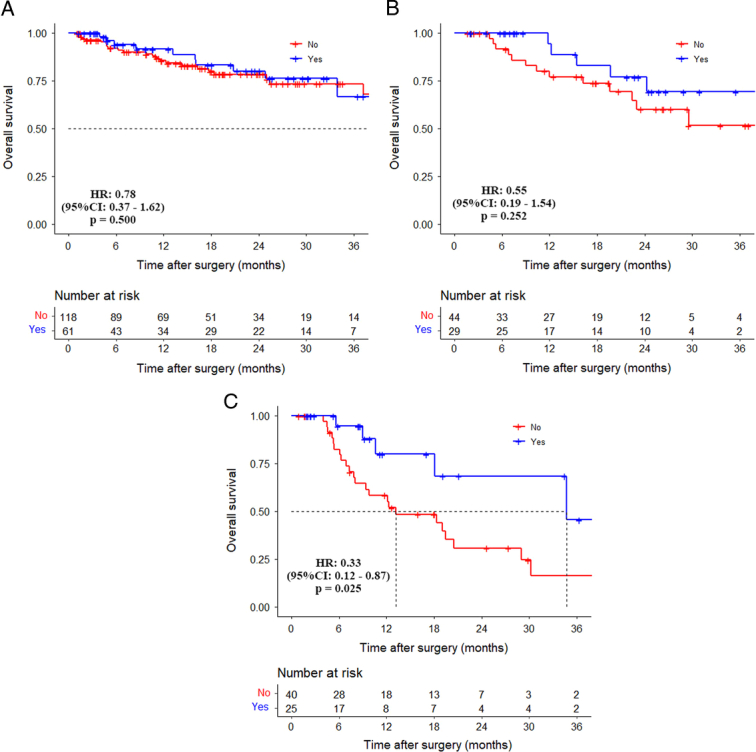
Comparison of overall survival curves between patients without and with adjuvant therapy in the normal group, normalization group, and non-normalization group. (A) Normal group (HR: 0.78, 95% CI: 0.37–1.62, P=0.500); (B) normalization group (HR: 0.55, 95% CI: 0.19–1.54, P=0.252); (C) non-normalization group (HR: 0.33, 95% CI: 0.12–0.87, P=0.025).
The 3-year RFS rates for patients who received adjuvant therapy in the normal, normalization, and non-normalization groups were 42.8%, 45.9%, and 36.0%, respectively, while for those who did not receive adjuvant therapy, the 3-year RFS rates were 60.9%, 16.1%, and 5.1%, respectively. Patients who received adjuvant therapy in the non-normalization group had significantly higher 3-year RFS rates than those who did not receive adjuvant therapy (HR: 0.33, 95% CI: 0.16–0.69, P=0.003). In the other two groups, there were no significant differences in RFS in patients who received or did not receive adjuvant therapy (Fig. 4A–C).
Figure 4.
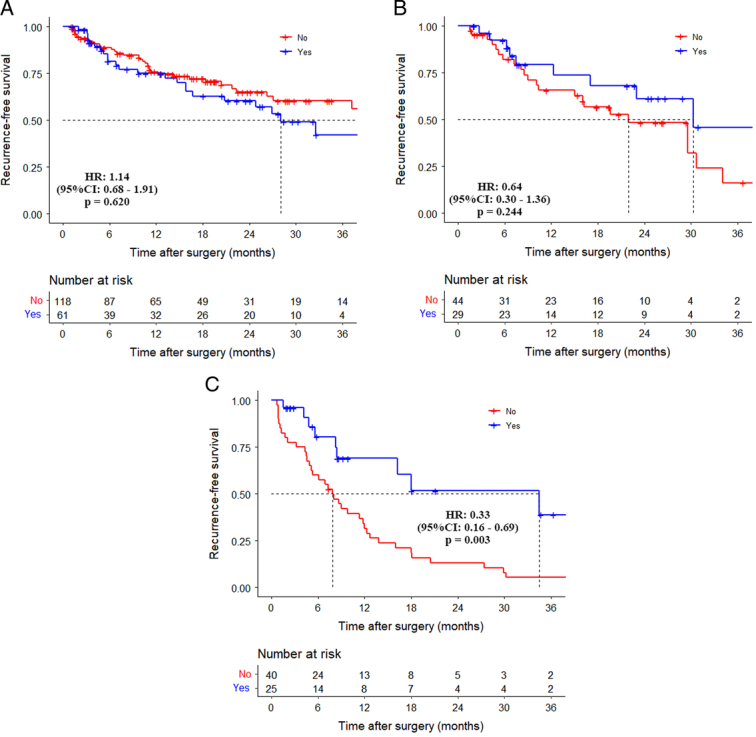
Comparison of recurrence-free survival curves between patients without and with adjuvant therapy in the normal group, normalization group, and non-normalization group. (A) Normal group (HR: 1.14, 95% CI: 0.68–1.91, P=0.620); (B) normalization group (HR: 0.64, 95% CI: 0.30–1.36, P=0.244); (C) non-normalization group (HR: 0.33, 95% CI: 0.16–0.69, P=0.003).
Discussion
The reported incidence rate of GBC is continuously increasing in the world, especially in East Asia and South America19. With advances in surgical technologies, surgical resection has become the preferred treatment for resectable GBC20. However, the highly malignant nature of GBC has led to suboptimal long-term survival outcomes even after radical resection, with a median OS of approximately 22 months21. There is an urgent clinical need in predicting postoperative survival in GBC patients to guide clinicians to select patients for surgery and to choose whether or not to administer adjuvant chemotherapy for these patients. Serum tumor markers, as a noninvasive and readily accessible parameter, have been widely used in oncologic surgery. The role of CA19-9 in biliary malignancies, particularly in GBC, has been increasingly emphasized22–24. For patients with resectable GBC, it is common to measure preoperative CA19-9 level to assess the tumor status and postoperative CA19-9 to predict treatment outcomes and to determine the presence of any residual tumor. Thus, this study was designed to study the impact of preoperative and postoperative CA19-9 levels on the survival outcomes of GBC patients after curative-intent resection.
As gallbladder bile cannot be drained into the bile ducts in GBC and in other biliary diseases causing biliary obstruction, the increased pressure in the biliary system leads to bile duct dilation, inflammatory response, and elevation of TB levels25, resulting in an elevation of serum CA19-9 levels26,27. Furthermore, as the liver is the main metabolic and clearance organ of CA19-9, its function is impaired in biliary obstruction, leading to a reduction in metabolism and clearance of CA19-9, resulting in an increase in the serum level of CA19-9 in these patients28. Thus, this study was designed to predict the prognosis of GBC patients after curative-intent resection using an adjusted CA19-9 to decrease the impact of elevated serum TB levels on CA19-9 to reflect the more authentic and accurate serum CA19-9 levels.
This study is the first multicenter study to investigate the impact of preoperative and postoperative adjusted CA19-9 on long-term survival outcomes after curative-intent resection in patients with GBC. This study included 317 patients and they were divided into three groups based on the normal range limit of the adjusted CA19-9 being >2×10³ U/μmol: the normal group, the normalization group, and the non-normalization group. This study found the OS and RFS rates of patients in the non-normalization group to be significantly worse than those of patients in the other two groups. The multivariate Cox regression model confirmed that the non-normalization group was independently associated with poor OS and RFS.
The prognostic value of CA19-9 has previously been validated in other gastrointestinal tumors. There is also some evidence to suggest changes in CA19-9 levels before and after surgery to be correlated with postoperative survival outcomes in patients undergoing gastrointestinal tumor surgery8,29,30. Wu et al.31 found in patients with stage II and III pancreatic cancer undergoing surgery, CA19-9/TB was more effective than CA19-9 alone in predicting disease progression (Stage II, HR=1.650, CI 95%: 1.023–2.662, P=0.040; Stage III, HR=3.989, CI 95%: 1.145–13.896, P=0.030). Boyd et al. observed that CA19-9/TB plays a crucial role in differentiating pancreatic cancer, distal bile duct cancer, and benign ampullary diseases31,32. All these research findings suggest that CA19-9 has its value in diagnosing and predicting the prognosis of gastrointestinal tumors, especially for patients with GBC. In addition, both the preoperative and postoperative CA19-9 levels are important in determining the long-term survival outcomes of patients.
In patients with GBC after curative-intent surgery, any biliary obstruction with its impact on liver metabolism is resolved, and any increase in CA19-9 levels should be related to any residual gallbladder tumor cells that secrete CA19-9 protein to cause an increase in serum CA19-9 level. After surgery, patients with a higher number of remaining tumor cells in their bodies would have a heavier tumor burden with increased secretion of CA19-9 and a poorer prognosis. The gross removal of a tumor does not necessarily mean that the tumor has been completely eliminated from a tumorological perspective, as the tumor might have already metastasized at the cellular level by entering into the circulatory system to metastasize to other organs which cannot be detected by medical imaging and by the naked eye33. Thus, the adjusted CA19-9 could be abnormally raised even after R0 resection, explaining why patients in the non-normalization group had suboptimal OS and RFS.
Subgroup analysis in this study revealed that for patients in the normal and normalization groups, the impact of receiving adjuvant therapy on OS and RFS was not significant. However, for patients in the non-normalization group, those who received adjuvant therapy had significantly higher rates of OS and RFS than those who did not receive adjuvant therapy.
It is highly likely that patients in the non-normalization group had already experienced cytological-level tumor metastasis or the presence of circulating tumor cells, and the adjuvant therapy used in this study mainly consisted of adjuvant chemotherapy, which can effectively kill circulating tumor cells in the blood and on metastatic tumors at the cellular level. Based on the results of the subgroup analysis, it is recommended that all patients in the non-normalization group, as well as those with increased preoperative and postoperative CA19-9 levels, should undergo adjuvant therapy to improve long-term survival outcomes.
In this study, the multivariable Cox regression model revealed that R1 resection, poor tumor differentiation, and 8th AJCC stage III/IV were independently associated with poorer OS and RFS in patients with GBC who underwent curative-intent resection. All these factors have previously been reported34–36. Notably, based on the findings of our study, achieving R0 resection is the most important factor for long-term patient survival outcomes. Currently, in addition to accurately assessing the extent and invasion of the lesion preoperatively, administering neoadjuvant therapy to patients may also improve the rate of R0 resection. The use of preoperative chemotherapy to include gemcitabine and cisplatin (the Gem/Cis regimen) has been shown to reduce tumor volume, control gross metastasis, and achieve cytological downsizing, thereby improving the rate of R0 resection37,38. In addition, the use of immune checkpoint inhibitors to include anti-PD-1 antibodies (e.g. pembrolizumab) and anti-PD-L1 antibodies (e.g. atezolizumab) has been shown to inhibit tumor cells from evading immune attacks by interfering with their interaction with immune cells39,40. Previous research has demonstrated the effectiveness of preoperative use of anti-PD-1 antibodies plus lenvatinib in the treatment of advanced GBC patients, showing this combined therapy increased the rate of tumor resection41. With the rapid development of neoadjuvant therapy, there will be more studies in the future to clarify the benefits of this treatment. Although adjuvant therapy was not confirmed to be an independent factor affecting OS or RFS in the Cox multivariate regression of this study, we believe that adjuvant therapy remains an important subsequent treatment measure. Recently, the BILCAP study confirmed that capecitabine can significantly improve long-term survival after biliary tract cancer (BTC) surgery42. Capecitabine is still considered the standard treatment for adjuvant therapy for BTC. The results of the BILCAP study and the impact of changes in CA19-9 levels before and after surgery on the long-term survival of GBC patients were examined in this study. Next, our team will further explore the impact of changes in CA19-9/TB before and after adjuvant chemotherapy on the long-term survival of GBC patients to maximize the exploration of the benefits of adjuvant chemotherapy to help patients.
This study has several limitations. First, it is a retrospective study with an inherent bias in patient selection. To minimize this bias, the multicenter study included consecutive patients to allow for a more robust representation of the real-world situation. Second, many patients were excluded from this study. The study design requirements excluded patients with TB >100 µmol/l. This exclusion may introduce some bias to the study. However, this approach allowed specific conclusions to be applied to the selected population which was included in this study. It is important to note that GBC differs from perihilar and distal cholangiocarcinoma or head of pancreas lesions, and the proportion of patients with preoperative jaundice is not high. Among the patients included in this study, 52 (16.4%) had jaundice. In addition, this study also excluded patients without postoperative CA19-9 data. Since this was a multicenter retrospective study, we cannot guarantee that every hospital participating in the study has performed postoperative CA19-9 testing for each patient. However, considering that missing CA19-9 data are random and that this study included consecutive patients, it may be possible to consider the results obtained from this study as those observed in the real world. To further verify the findings of this study, in the future, we will design a prospective GBC study in which postoperative CA19-9 data are collected to validate the results of this study. Third, the adjuvant treatment regimens were not consistently used. As this was a multicenter retrospective study and there was no standard chemotherapy protocol for GBC patients at the time of this study, it was difficult to unify the adjuvant treatment regimens. In the future, our academic group will initiate multicenter prospective trials to study the survival impact of different chemotherapy regimens on patients with GBC after curative-intent resection.
In conclusion, for patients with GBC who underwent curative-intent resection, abnormal preoperative and postoperative levels of adjusted CA19-9 (CA19-9/TB) reminded poorer long-term survival outcomes. For these patients, postoperative adjuvant therapy resulted in better long-term survival outcomes.
Ethical approval
The study procedures were approved by the institutional ethics committee of Southwest Hospital (No. KY2022217).
Sources of funding
None.
Author contribution
X.-L.L.: conceptualization, formal analysis, methodology, and writing – original draft; Z.-P.L.: formal analysis, methodology, and writing – review and editing; X.-X.S.: formal analysis and writing – review and editing; Y.G.: supervision, methodology, and writing – review and editing; Y.-S.Y.: formal analysis and methodology; X.-L.Z., Z.-M.L., and J.-J.D.: data curation and methodology; Y.Z., D.-L.Y., C.Y., J.-X.Z., D.Z., R.D., W.C., Y.C., P.Y., Y.J., X.-Y.Y., and J.B.: data curation; Z.-R.W. and Y.-Q.Z.: formal analysis and methodology; H.-S.D.: conceptualization, supervision, and writing – original draft; W.Y.L.: supervision and writing – review and editing; Z.-Y.C.: conceptualization, funding acquisition, and writing – review and editing.
Conflicts of interest disclosure
The authors have no conflicts of interest to declare.
Research registration unique identifying number (UIN)
Name of the registry: Long-term Prognosis of Patients with Gallbladder Carcinoma After Curative-intent Resection According to Changes in the Ratio of Carbohydrate Antigen 19-9 to Total Bilirubin (CA19-9/TB): A Multicenter Observational Study.
Unique identifying number or registration ID: Researchregistry9607.
Hyperlink to your specific registration (must be publicly accessible and will be checked): https://www.researchregistry.com/browse-theregistry#home/registrationdetails/652925150819ad0028c2f83b/.
Guarantor
Zhi-Yu Chen, Wan Yee Lau, and Hai-Su Dai.
Data availability statement
The data that support the study findings are available upon reasonable request from the corresponding authors (Zhi-Yu Chen, Wan Yee Lau, Hai-Su Dai). The full data are not publicly available due to limitations posed by the ethical regulations at some of the participating centers.
Reporting checklist
The authors have completed the STROBE reporting checklist.
Supplementary Material
Footnotes
X.-L.L., Z.-P.L., X.-X.S., Y.G., and Y.-S.Y. contributed equally to this work.
Sponsorships or competing interests that may be relevant to content are disclosed at the end of this article.
Supplemental Digital Content is available for this article. Direct URL citations are provided in the HTML and PDF versions of this article on the journal's website, www.lww.com/international-journal-of-surgery.
Published online 17 April 2024
Contributor Information
Xue-Lei Li, Email: lixueleitmmu@163.com.
Zhi-Peng Liu, Email: liuzhipeng1115@163.com.
Xing-Xing Su, Email: suxingxingtmmu@163.com.
Yi Gong, Email: gongyitmmu@163.com.
Yi-Shi Yang, Email: yangyishi9507@163.com.
Xiao-Lin Zhao, Email: zhaoxiaolintmmu@163.com.
Zi-Mu Li, Email: lizimutmmu@163.com.
Jun-Jie Ding, Email: dingjunjietmmu@163.com.
Yi Zhu, Email: zhuyi_zj@163.com.
Da-Long Yin, Email: yindalong_ah@163.com.
Chao Yu, Email: yuchao_gz@163.com.
Jin-Xue Zhou, Email: zhoujinxue_hn@163.com.
Dong Zhang, Email: zdongsx@163.com.
Rui Ding, Email: dingrui_sx@163.com.
Wei Chen, Email: chenwei_gdzs@163.com.
Yao Cheng, Email: chengyao_cq@163.com.
Ping Yue, Email: yueping_gs@163.com.
Zi-Ran Wang, Email: wangzirantmmu@163.com.
Yan-Qi Zhang, Email: zhangyanqitmmu@163.com.
Yan Jiang, Email: jiangyantmmu@163.com.
Xian-Yu Yin, Email: yinxianyutmmu@163.com.
Jie Bai, Email: baijietmmu@163.com.
Hai-Su Dai, Email: daihaisu@163.com.
Wan Yee Lau, Email: josephlau@cuhk.edu.hk.
Zhi-Yu Chen, Email: chenzhiyu_umn@163.com.
References
- 1.Sung H, Ferlay J, Siegel RL, et al. Global Cancer Statistics 2020: GLOBOCAN estimates of incidence and mortality worldwide for 36 cancers in 185 countries. CA Cancer J Clin 2021;71:209–249. [DOI] [PubMed] [Google Scholar]
- 2.Benson AB, D’Angelica MI, Abbott DE, et al. Hepatobiliary Cancers, Version 2.2021, NCCN Clinical Practice Guidelines in Oncology. J Natl Compr Canc Netw 2021;19:541–565. [DOI] [PubMed] [Google Scholar]
- 3.Roa JC, García P, Kapoor VK, et al. Gallbladder cancer. Nat Rev Dis Primers 2022;8:69. [DOI] [PubMed] [Google Scholar]
- 4.Margonis GA, Gani F, Buettner S, et al. Rates and patterns of recurrence after curative intent resection for gallbladder cancer: a multi-institution analysis from the US Extra-hepatic Biliary Malignancy Consortium. HPB (Oxford) 2016;18:872–878. [DOI] [PMC free article] [PubMed] [Google Scholar]
- 5.Shimizu Y, Ashida R, Sugiura T, et al. Early recurrence in resected gallbladder carcinoma: clinical impact and its preoperative predictive score. Ann Surg Oncol 2022;29:5447–5457. [DOI] [PubMed] [Google Scholar]
- 6.Hundal R, Shaffer EA. Gallbladder cancer: epidemiology and outcome. Clin Epidemiol 2014;6:99–109. [DOI] [PMC free article] [PubMed] [Google Scholar]
- 7.Koprowski H, Steplewski Z, Mitchell K, et al. Colorectal carcinoma antigens detected by hybridoma antibodies. Somatic Cell Genet 1979;5:957–971. [DOI] [PubMed] [Google Scholar]
- 8.Yamashita S, Passot G, Aloia TA, et al. Prognostic value of carbohydrate antigen 19-9 in patients undergoing resection of biliary tract cancer. Br J Surg 2017;104:267–277. [DOI] [PubMed] [Google Scholar]
- 9.Lee JW, Kim YT, Lee SH, et al. Tumor marker kinetics as prognosticators in patients with unresectable gallbladder adenocarcinoma undergoing palliative chemotherapy. Gut Liver 2018;12:102–110. [DOI] [PMC free article] [PubMed] [Google Scholar]
- 10.Ong SL, Sachdeva A, Garcea G, et al. Elevation of carbohydrate antigen 19.9 in benign hepatobiliary conditions and its correlation with serum bilirubin concentration. Dig Dis Sci 2008;53:3213–3217. [DOI] [PubMed] [Google Scholar]
- 11.Tsen A, Barbara M, Rosenkranz L. Dilemma of elevated CA 19-9 in biliary pathology. Pancreatology 2018;18:862–867. [DOI] [PubMed] [Google Scholar]
- 12.Tempero MA, Uchida E, Takasaki H, et al. Relationship of carbohydrate antigen 19-9 and Lewis antigens in pancreatic cancer. Cancer Res 1987;47:5501–5503. [PubMed] [Google Scholar]
- 13.Agha R, Abdall-Razak A, Crossley E, et al. STROCSS 2019 Guideline: Strengthening the reporting of cohort studies in surgery. Int J Surg 2019;72:156–165. [DOI] [PubMed] [Google Scholar]
- 14.Colombo PE, Quenet F, Alric P, et al. Distal pancreatectomy with celiac axis resection (modified Appleby procedure) and arterial reconstruction for locally advanced pancreatic adenocarcinoma after FOLFIRINOX chemotherapy and chemoradiation therapy. Ann Surg Oncol 2021;28:1106–1108. [DOI] [PubMed] [Google Scholar]
- 15.Nagino M, DeMatteo R, Lang H, et al. Proposal of a new comprehensive notation for hepatectomy: the “New World” terminology. Ann Surg 2021;274:1–3. [DOI] [PubMed] [Google Scholar]
- 16.Chen C, Liu Z, Chen W, et al. Anatomical hepatectomy for achieving textbook outcome for perihilar cholangiocarcinoma treated with curative-intent resection: a multicenter study. iLIVER 2022;1:245–251. [Google Scholar]
- 17.Maker AV, Butte JM, Oxenberg J, et al. Is port site resection necessary in the surgical management of gallbladder cancer. Ann Surg Oncol 2012;19:409–417. [DOI] [PubMed] [Google Scholar]
- 18.Chun YS, Pawlik TM, Vauthey JN. 8th Edition of the AJCC Cancer Staging Manual: pancreas and hepatobiliary cancers. Ann Surg Oncol 2018;25:845–847. [DOI] [PubMed] [Google Scholar]
- 19.Huang J, Patel HK, Boakye D, et al. Worldwide distribution, associated factors, and trends of gallbladder cancer: a global country-level analysis. Cancer Lett 2021;521:238–251. [DOI] [PubMed] [Google Scholar]
- 20.Benson AB, D’Angelica MI, Abrams T, et al. NCCN Guidelines® Insights: Biliary Tract Cancers, Version 2.2023. J Natl Compr Canc Netw 2023;21:694–704. [DOI] [PubMed] [Google Scholar]
- 21.de Savornin Lohman E, de Bitter T, Hannink G, et al. Development and external validation of a model to predict overall survival in patients with resected gallbladder cancer. Ann Surg 2023;277:e856–e863. [DOI] [PubMed] [Google Scholar]
- 22.La Greca G, Sofia M, Lombardo R, et al. Adjusting CA19-9 values to predict malignancy in obstructive jaundice: influence of bilirubin and C-reactive protein. World J Gastroenterol 2012;18:4150–4155. [DOI] [PMC free article] [PubMed] [Google Scholar]
- 23.Bolm L, Petrova E, Weitz J, et al. Prognostic relevance of preoperative bilirubin-adjusted serum carbohydrate antigen 19-9 in a multicenter subset analysis of 179 patients with distal cholangiocarcinoma. HPB (Oxford) 2019;21:1513–1519. [DOI] [PubMed] [Google Scholar]
- 24.Liu F, Wang JK, Ma WJ, et al. Clinical value of preoperative CA19-9 levels in evaluating resectability of gallbladder carcinoma. ANZ J Surg 2019;89:E76–E80. [DOI] [PubMed] [Google Scholar]
- 25.Scarà S, Bottoni P, Scatena R. CA 19-9: biochemical and clinical aspects. Adv Exp Med Biol 2015;867:247–260. [DOI] [PubMed] [Google Scholar]
- 26.Mann DV, Edwards R, Ho S, et al. Elevated tumour marker CA19-9: clinical interpretation and influence of obstructive jaundice. Eur J Surg Oncol 2000;26:474–479. [DOI] [PubMed] [Google Scholar]
- 27.Albert MB, Steinberg WM, Henry JP. Elevated serum levels of tumor marker CA19-9 in acute cholangitis. Dig Dis Sci 1988;33:1223–1225. [DOI] [PubMed] [Google Scholar]
- 28.Basso D, Fabris C, Del Favero G, et al. How does liver dysfunction influence serum CA 19-9 in pancreatic cancer? Ital J Gastroenterol 1990;22:1–6. [PubMed] [Google Scholar]
- 29.Lee JW, Lee JH, Park Y, et al. Prognostic impact of perioperative CA19-9 levels in patients with resected perihilar cholangiocarcinoma. J Clin Med 2021;10:1345. [DOI] [PMC free article] [PubMed] [Google Scholar]
- 30.Zhao Y, Wang C. Clinicopathological features, recurrence patterns, and prognosis of pancreatic adenocarcinoma with normal serum CA19-9. A consecutive series of 154 cases from a single institute. J Gastrointest Surg 2020;24:855–865. [DOI] [PubMed] [Google Scholar]
- 31.Wu Z, Zhao P, Wang Z, et al. Adjusting CA19-9 values with clinical stage and bilirubin to better predict survival of resectable pancreatic cancer patients: 5-year-follow-up of a single center. Front Oncol 2022;12:966256. [DOI] [PMC free article] [PubMed] [Google Scholar]
- 32.Boyd L, Ali M, Kam L, et al. The diagnostic value of the CA19-9 and bilirubin ratio in patients with pancreatic cancer, distal bile duct cancer and benign periampullary diseases, a novel approach. Cancers (Basel) 2022;14:344. [DOI] [PMC free article] [PubMed] [Google Scholar]
- 33.Lin D, Shen L, Luo M, et al. Circulating tumor cells: biology and clinical significance. Signal Transduct Target Ther 2021;6:404. [DOI] [PMC free article] [PubMed] [Google Scholar]
- 34.Wang SJ, Fuller CD, Kim JS, et al. Prediction model for estimating the survival benefit of adjuvant radiotherapy for gallbladder cancer. J Clin Oncol 2008;26:2112–2117. [DOI] [PubMed] [Google Scholar]
- 35.Liu ZP, Guo W, Yin DL, et al. Textbook outcomes in liver surgery for gallbladder cancer patients treated with curative-intent resection: a multicenter observational study. Int J Surg 2023;109:2751–2761. [DOI] [PMC free article] [PubMed] [Google Scholar]
- 36.Regmi P, Paudyal A, Paudyal P, et al. Prognostic significance of tumor budding in biliary tract cancer. Eur J Surg Oncol 2022;48:160–168. [DOI] [PubMed] [Google Scholar]
- 37.Creasy JM, Goldman DA, Dudeja V, et al. Systemic chemotherapy combined with resection for locally advanced gallbladder carcinoma: surgical and survival outcomes. J Am Coll Surg 2017;224:906–916. [DOI] [PMC free article] [PubMed] [Google Scholar]
- 38.Engineer R, Goel M, Chopra S, et al. Neoadjuvant chemoradiation followed by surgery for locally advanced gallbladder cancers: a new paradigm. Ann Surg Oncol 2016;23:3009–3015. [DOI] [PubMed] [Google Scholar]
- 39.Chen G, Huang AC, Zhang W, et al. Exosomal PD-L1 contributes to immunosuppression and is associated with anti-PD-1 response. Nature 2018;560:382–386. [DOI] [PMC free article] [PubMed] [Google Scholar]
- 40.Dai X, Gao Y, Wei W. Post-translational regulations of PD-L1 and PD-1: mechanisms and opportunities for combined immunotherapy. Semin Cancer Biol 2022;85:246–252. [DOI] [PMC free article] [PubMed] [Google Scholar]
- 41.Zuo B, Yang X, Yang X, et al. A real-world study of the efficacy and safety of anti-PD-1 antibodies plus lenvatinib in patients with advanced gallbladder cancer. Cancer Immunol Immunother 2022;71:1889–1896. [DOI] [PMC free article] [PubMed] [Google Scholar]
- 42.Primrose JN, Fox RP, Palmer DH, et al. Capecitabine compared with observation in resected biliary tract cancer (BILCAP): a randomised, controlled, multicentre, phase 3 study. Lancet Oncol 2019;20:663–673. [DOI] [PubMed] [Google Scholar]
Associated Data
This section collects any data citations, data availability statements, or supplementary materials included in this article.
Data Availability Statement
The data that support the study findings are available upon reasonable request from the corresponding authors (Zhi-Yu Chen, Wan Yee Lau, Hai-Su Dai). The full data are not publicly available due to limitations posed by the ethical regulations at some of the participating centers.