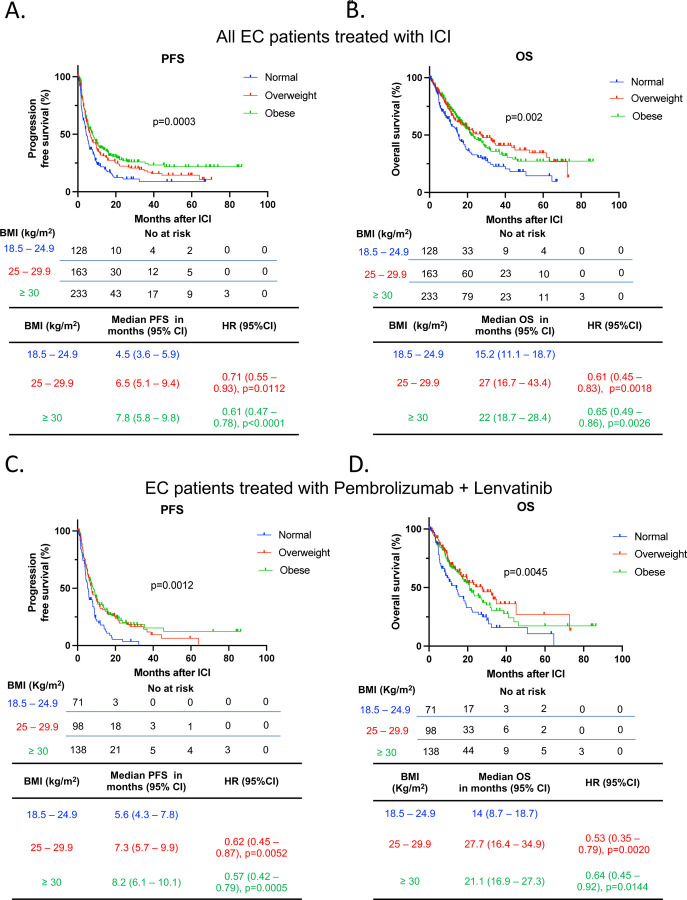
Figure 2. Survival outcomes of EC patients treated with ICI categorized by BMI.
Kaplan-Meier curves for (A) PFS and (B) OS in patients with EC treated with ICI and categorized by BMI (Normal - BMI: 18.5 – 24.9 kg/m2 in blue; Overweight – BMI 25 – 29.9 kg/m2 in red; Obese – BMI > 30 kg/m2 in green) (n=524). Kaplan-Meier curves for (C) PFS and (D) OS in the subgroup of EC patients treated with the ICI pembrolizumab in combination with lenvatinib (n=307). The P values in the PFS and OS plots were calculated using a log-rank test. HRs and 95% CIs for overweight and obese patients were calculated using normal BMI as a reference. BMI, body mass index; CI, confidence interval; EC, endometrial cancer; HR, Hazard ratio; ICI, immune checkpoint inhibitor; OS, overall survival; PFS, progression free survival.

