

Keywords: cardiorespiratory fitness, genomics, metabolomics, proteomics, transcriptomics
Abstract
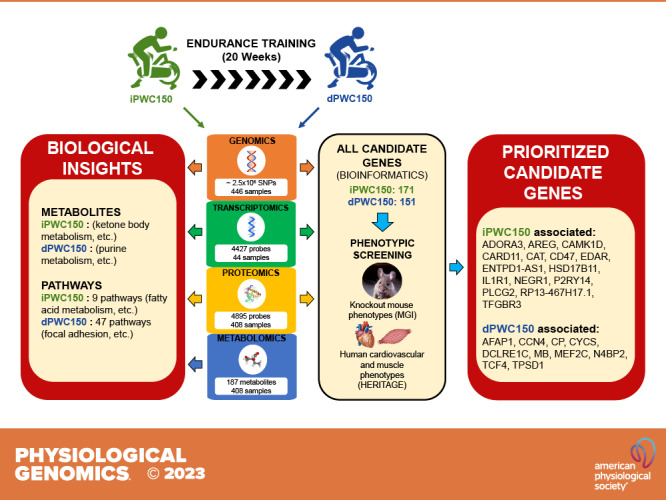
Submaximal exercise capacity is an indicator of cardiorespiratory fitness with clinical and public health implications. Submaximal exercise capacity and its response to exercise programs are characterized by heritability levels of about 40%. Using physical working capacity (power output) at a heart rate of 150 beats/min (PWC150) as an indicator of submaximal exercise capacity in subjects of the HERITAGE Family Study, we have undertaken multi-omics and in silico explorations of the underlying biology of PWC150 and its response to 20 wk of endurance training. Our goal was to illuminate the biological processes and identify panels of genes associated with human variability in intrinsic PWC150 (iPWC150) and its trainability (dPWC150). Our bioinformatics approach was based on a combination of genome-wide association, skeletal muscle gene expression, and plasma proteomics and metabolomics experiments. Genes, proteins, and metabolites showing significant associations with iPWC150 or dPWC150 were further queried for the enrichment of biological pathways. We compared genotype-phenotype associations of emerging candidate genes with reported functional consequences of gene knockouts in mouse models. We investigated the associations between DNA variants and multiple muscle and cardiovascular phenotypes measured in HERITAGE subjects. Two panels of prioritized genes of biological relevance to iPWC150 (13 genes) and dPWC150 (6 genes) were identified, supporting the hypothesis that genes and pathways associated with iPWC150 are different from those underlying dPWC150. Finally, the functions of these genes and pathways suggested that human variation in submaximal exercise capacity is mainly driven by skeletal muscle morphology and metabolism and red blood cell oxygen-carrying capacity.
NEW & NOTEWORTHY Multi-omics and in silico explorations of the genes and underlying biology of submaximal exercise capacity and its response to 20 wk of endurance training were undertaken. Prioritized genes were identified: 13 genes for variation in submaximal exercise capacity in the sedentary state and 5 genes for the response level to endurance training, with no overlap between them. Genes and pathways associated with submaximal exercise capacity in the sedentary state are different from those underlying trainability.
Listen to this article’s corresponding podcast at https://apspublicationspodcast.podbean.com/e/omics-and-submaximal-work-capacity-and-trainability/.
INTRODUCTION
Cardiorespiratory fitness plays an important role in the modulation of risk for cardiometabolic diseases and other health outcomes, including aging and mortality (1). It is useful for understanding of the health benefits associated with regular exercise to distinguish between intrinsic cardiorespiratory fitness and acquired cardiorespiratory fitness (2). Most epidemiological studies of cardiorespiratory fitness and health outcomes are based on indicators of maximal cardiorespiratory fitness or predicted maximal cardiorespiratory fitness from submaximal levels (3). However, submaximal indicators of cardiorespiratory fitness are also of considerable importance (4, 5), as it is not always possible or desirable to test a person to exhaustion.
There is a strong interest in submaximal cardiorespiratory fitness indicators for applications in large population studies, studies of old people, and patients affected by any number of clinical conditions. The demand for simple and less demanding indicators of fitness is such that several investigators have even proposed to predict the cardiorespiratory fitness of adults from personal characteristics and behavioral traits with no exercise testing involved. As the focus of this paper is on the biology underlying submaximal cardiorespiratory fitness, the large body of literature dealing with the prediction of maximal cardiorespiratory fitness from submaximal indicators is not of interest here. Tests typically used to assess submaximal cardiorespiratory fitness in various settings (6) include submaximal treadmill, cycling, paced walking, and step tests. Submaximal fitness tests that have received attention for decades focus on the power output at a given submaximal heart rate (HR). Examples of such tests include physical working capacity (PWC) at heart rates (HRs) of 130 beats/min, 150 beats/min (PWC150), or 170 beats/min. For instance, PWC at an HR of 130 beats/min has been used as an indicator of fitness in studies with older participants (7), PWC at an HR of 170 beats/min has been used with younger populations (8, 9), and PWC150 has been used with heterogeneous populations (10, 11).
PWC tests are based on the relationship between progressively increasing workloads and the HR response in a relatively steady state at each workload. The estimated power output at the targeted HR (e.g., 150 beats/min) is interpolated when flanked by a lower and higher exercise HR. When the targeted HR is higher than the highest achieved HR, the targeted PWC is extrapolated, again assuming a linear relation between workload and HR. PWC tests are only moderately correlated with other indicators of cardiorespiratory fitness, including maximal oxygen consumption (V̇o2max) (9, 12), indicating that they measure aspects of fitness that are not captured fully in maximal exercise tests leading to exhaustion. Moreover, baseline indicators of submaximal exercise capacity are largely independent of their responses to an exercise training program (13–15). Thus, maximal and submaximal tests of cardiorespiratory fitness do not measure the same combination of biological determinants of exercise capacity. V̇o2max tends to reflect primarily the performance of the oxygen delivery system, which is conditioned by stroke volume (SV), cardiac output, and the oxygen-carrying capacity of the blood as assessed by total hemoglobin content (16–19). In contrast, submaximal exercise capacity is highly dependent on central factors but with a strong contribution from peripheral ones, including local blood flow and skeletal muscle morphology and metabolism (15).
In a series of genetic studies performed by our group, one study of PWC150 performed in sedentary adopted and biological siblings reported that the heritability reached ∼40% with data adjusted for age, sex, body mass, and composition (10). This observation was largely confirmed by the HERITAGE Family Study for several indicators of submaximal exercise capacity (20, 21). Likewise, significant familial aggregation and heritability levels were found for HR, blood pressure, SV, and cardiac output during submaximal exercise at 50 W and at 60% of maximal exercise capacity in sedentary adults of HERITAGE (22). The variability in responsiveness to the endurance training program of HERITAGE was also partly explained by significant genetic components (heritability ranging from 22% to 57%) for the gains in submaximal working capacity (20, 21), with slightly lower heritability levels for changes in submaximal exercise HR, blood pressure, SV, and cardiac output (22, 23). The gains in submaximal exercise capacity with training were further linked to several single-nucleotide polymorphisms (SNPs) on chromosome 13q12 in a region encoding MIPEP and SGCG (24).
Although the physiology of submaximal exercise capacity has received attention, little is known about genes, pathways, networks, and noncoding regulatory and other genomic features contributing to individual differences in submaximal physical working capacity and its trainability. The present study was designed to address these topics using the genomic, transcriptomic, proteomic, metabolomic, and phenotype resources of the HERITAGE Family Study, interrogated through a comprehensive bioinformatics pipeline. The following hypotheses were addressed. First, assuming that there are only moderate correlations between V̇o2max and submaximal exercise capacity, we hypothesized that the panel of prioritized genes will be substantially different between intrinsic V̇o2max [as previously reported by Ghosh et al. (25)] and intrinsic PWC150 (iPWC150). Second, assuming that there are only weak correlations between baseline submaximal exercise capacity and its response to exercise training, we further hypothesized that the panel of prioritized genes and pathways will differ markedly between iPWC150 and its training response (dPWC150). Third, we hypothesized that the panel of prioritized genes and pathways for both iPWC150 and dPWC150 will be dominated by genes and pathways associated primarily with skeletal muscle morphology and metabolism and oxygen transport capacity of the blood. We further posit that in silico “experiments” involving existing physiological and metabolic traits measured on the HERITAGE subjects and in mouse datasets relevant to cardiorespiratory fitness will provide further evidence for the genes identified in our study.
This is the first unbiased and comprehensive omics exploration of physiological and molecular correlates of submaximal work capacity and its response to endurance exercise training. It provides multiple biomarker targets that could be further investigated in experimental models and other human cohorts with exercise training data.
METHODS
HERITAGE Family Study
The HERITAGE Family Study has been previously described, including full details on study design and inclusion and exclusion criteria (26, 27). This was a single-arm intervention (i.e., nonrandomized) with no control group. The Consensus on Exercise Reporting Template (28) guidelines for this study are provided in Supplemental Table S1. Briefly, 855 Black and White subjects from 218 families across 4 clinical sites were recruited to participate in an endurance exercise training study. Among them, 446 adults (216 men and 230 women) from 97 families of European descent, who were confirmed sedentary and had taken two maximal exercise tests to exhaustion at baseline, constituted the population of the present study. Genomic, metabolomic, and skeletal muscle gene expression and biochemical assays were not available for Black subjects in HERITAGE. Inclusion and exclusion criteria included age (17–65 yr), physical activity level (physically inactive the previous 6 mo), body mass index below 40 kg/m2, normotensive or mildly hypertensive (<160/100 mmHg), not taking medications for hypertension, diabetes, or dyslipidemia, and no history of certain medical conditions (26). The study protocol had been approved by the Institutional Review Boards at each of the participating centers of the HERITAGE Family Study consortium. Written informed consent was obtained from each participant. All research was performed in accordance with the Declaration of Helsinki.
Exercise Intervention
Each subject in HERITAGE exercised three times per week for 20 wk on cycle ergometers. The intensity of the exercise was customized for everyone based on HR and V̇o2max measurements taken at a baseline test. Details of the exercise training protocol can be found elsewhere (26). Briefly, subjects trained at the HR associated with 55% of baseline V̇o2max for 30 min per session for the first 2 wk. The duration and intensity were gradually increased every 2 wk until reaching 50 min and 75% of the HR associated with baseline V̇o2max. This level was maintained for the final 6 wk of training. All exercise was performed on Universal Aerobicycles (Cedar Rapids, IA), and power output was controlled by direct HR monitoring using the Universal Gym Mednet (Cedar Rapids, IA) computerized system. Each exercise session was supervised to ensure that the equipment was working properly and that the participants were compliant with the protocol. As each participant was used as his/her own control in the exercise intervention, randomization was not considered a relevant criterion for the study design.
Exercise Tests
A progressive, continuous cycle ergometer test to exhaustion was performed at baseline and 24 h after the last exercise training session. The exercise test was performed on a SensorMedics 800S (Yorba Linda, CA) cycle ergometer using a SensorMedics 2900 metabolic measurement cart (29). Briefly, subjects exercised at a power output of 50 W for 3 min, followed by increases of 25 W each 2 min until volitional exhaustion. For older, smaller, or less fit individuals, the test was started at 40 W, with increases of 10–20 W each 2 min thereafter. Maximal oxygen uptake (V̇o2max) was defined as previously reported (18, 21).
PWC150 Calculation
PWC150 was interpolated from the HR-power output relationship across all stages of the progressive maximal exercise test using linear regression models fit for each participant. From each regression model, the β estimate for HR was multiplied by 150 and added to the intercept value to calculate PWC150. Of a total of 892 PWC calculations (baseline plus posttraining), only 11 (or 1.2%) had to be extrapolated (i.e., their HR did not reach 150 during the maximal exercise test). To calculate the change in PWC150 (dPWC150), the iPWC150 value was subtracted from the posttraining PWC150 value.
Cardiovascular Phenotype Measurement
Submaximal exercise phenotypes include HR, SV, cardiac output, systolic blood pressure (SBP), and oxygen consumption (V̇o2) at 50 W and 60% of V̇o2max measured at baseline and posttraining exercise tests (29, 30). The values used in the present study represent the mean of the responses at each power output (50 W and 60% of V̇o2max) from two submaximal tests, both before and after training. HR was recorded by electrocardiography, and blood pressure was measured using Colin STBP-780 automated units (San Antonio, TX) with recordings confirmed by technicians wearing headphones (31). SV and cardiac output were assessed by the CO2 rebreathing method (32). Other exercise phenotypes of interest here included maximal workload achieved and workload at the ventilatory threshold (33).
Percent body fat, fat mass, and fat free mass were assessed by hydrostatic weighing, as previously described (34). Percent body fat was estimated from body density using sex- and ethnic-specific equations (35–38). Visceral adipose tissue (VAT) was assessed by computed tomography, as previously described (34). Body mass index was calculated as weight in kilograms divided by height in meters squared (kg/m2).
Muscle Phenotype Measurement
A subset of HERITAGE participants underwent muscle biopsies from the vastus lateralis before and after the exercise training program (39). Histochemical analysis was performed based on the staining properties of ATP to identify skeletal muscle fibers as type I, IIA, and IIB. The number of capillaries around each of these fibers was counted to determine the capillary density and area per capillary of each fiber type. Skeletal muscle enzyme activities were measured using spectrophotometric techniques on homogenized muscle samples (39). The maximal activity of the following enzymes was measured: carnitine palmitoyl transferase, citrate synthase, creatine kinase, cytochrome c oxidase, GAPDH, 3-β-hydroxyacyl CoA dehydrogenase, hexokinase, phosphofructokinase, and phosphorylase.
All muscle and cardiovascular phenotypes were measured at baseline and posttraining (24 and 72 h for cardiovascular traits and 96 h after the last exercise session for muscle), and the change in response to the exercise training program (i.e., Δ) was calculated by subtracting the baseline value from the posttraining value.
Genome-Wide Genotyping
Genome-wide genotyping was performed using the Illumina HumanCNV370-Quad v3.0 BeadChips on Illumina BeadStation 500GX platform. The genotype calls were determined via the Illumina GenomeStudio software, and all samples were called in the same batch to eliminate batch-to-batch variation. Monomorphic SNPs, SNPs with only one heterozygote, and SNPs with more than 30% missing data were filtered out. Twelve samples were genotyped twice with 100% reproducibility across all SNPs. All GenomeStudio genotype calls with a GenTrain score of <0.885 were checked and confirmed manually. Quality control of the genome-wide association study (GWAS) SNP data confirmed all family relationships and found no evidence of DNA sample mix-ups.
Imputation was performed using a CEU reference panel (Northern and Western European ancestry) consisting of 120 haplotypes from HapMap Phase II data (release 22, build 36) and MACH software (40). A total of 2,396,589 (324,611 directly typed and 2,071,978 imputed) SNPs were tested for association with iPWC150 and dPWC150 residuals. Residuals were standardized to a zero mean and unit variance with adjustment for age within sex-by-generation subgroups as previously described (40). ΔPWC150 residuals also adjusted for intrinsic PWC150 (i.e., Δ values are independent of baseline value).
Overall Analytic Strategy
As estimates for iPWC150 and dPWC150 were obtained under strictly controlled experimental settings, the available sample sizes for GWAS were necessarily smaller compared with conventional GWAS that are based on population-level sampling of cases and controls. Smaller sample sizes affect statistical power, leading to increased type II error rates (false negatives), when analysis is guided solely by strict statistical thresholds. The same is true for other omics technologies, especially when dealing with heterogeneous human samples. To address this problem of overreliance on statistical thresholding while maintaining a consistent gene selection strategy, we used more permissible nominal P value thresholds (0.05−1 × 10⁻⁴ range, heuristically determined depending on analysis) to identify gene candidates from genomics, transcriptomics, and proteomics studies [adjusted P values were also calculated in all cases via the false discovery rate (“FDR”) method using the rstatix R package]. The union of the candidate genes determined from each analysis was subsequently tested for phenotypic associations to finally prioritize candidate iPWC150 and dPWC150 genes. We adopted the more inclusive union-based strategy for primary gene selection instead of an intersection-based approach because different technology platforms are likely to capture different aspects of the underlying phenotype that would be missed if the focus was only on the common genes. This was confirmed by the observation that the overlap among top-scoring genes from each analysis in the present study was indeed low. In summary, we relied more on phenotypic corroboration, instead of strict statistical filtering, for candidate gene prioritization.
The analytic approach is divided into a discovery section and a validation section (Fig. 1). The discovery section is concerned with the identification of candidate genes, associated with iPWC150 or dPWC150, through an integrative bioinformatics analysis of different data streams arising from genomics (GWAS), baseline skeletal muscle transcriptomics, and baseline plasma proteomics of HERITAGE cohort samples. A separate metabolomics analysis of associations with iPWC150 and dPWC150 was also carried out. For GWAS analysis, we exploited data from several expression quantitative trait loci (eQTL) datasets to assess the impact of iPWC150- or dPWC150-associated SNPs in influencing nearby gene expression (cis-eQTLs). In addition, we examined the effects of sequence variation on biological processes through pathway enrichment analysis of genes proximal to associated SNPs. For transcriptomic, proteomic, and metabolomic data, we investigated the association of baseline analyte expression (genes, proteins, or metabolites) with iPWC150 or dPWC150 via multivariate regression modeling after adjustments for age, sex, baseline body mass index, and, additionally, iPWC150 (for models of dPWC150). Genes, proteins, and metabolites showing nominally significant associations were further queried for enrichment of biological pathways.
Figure 1.
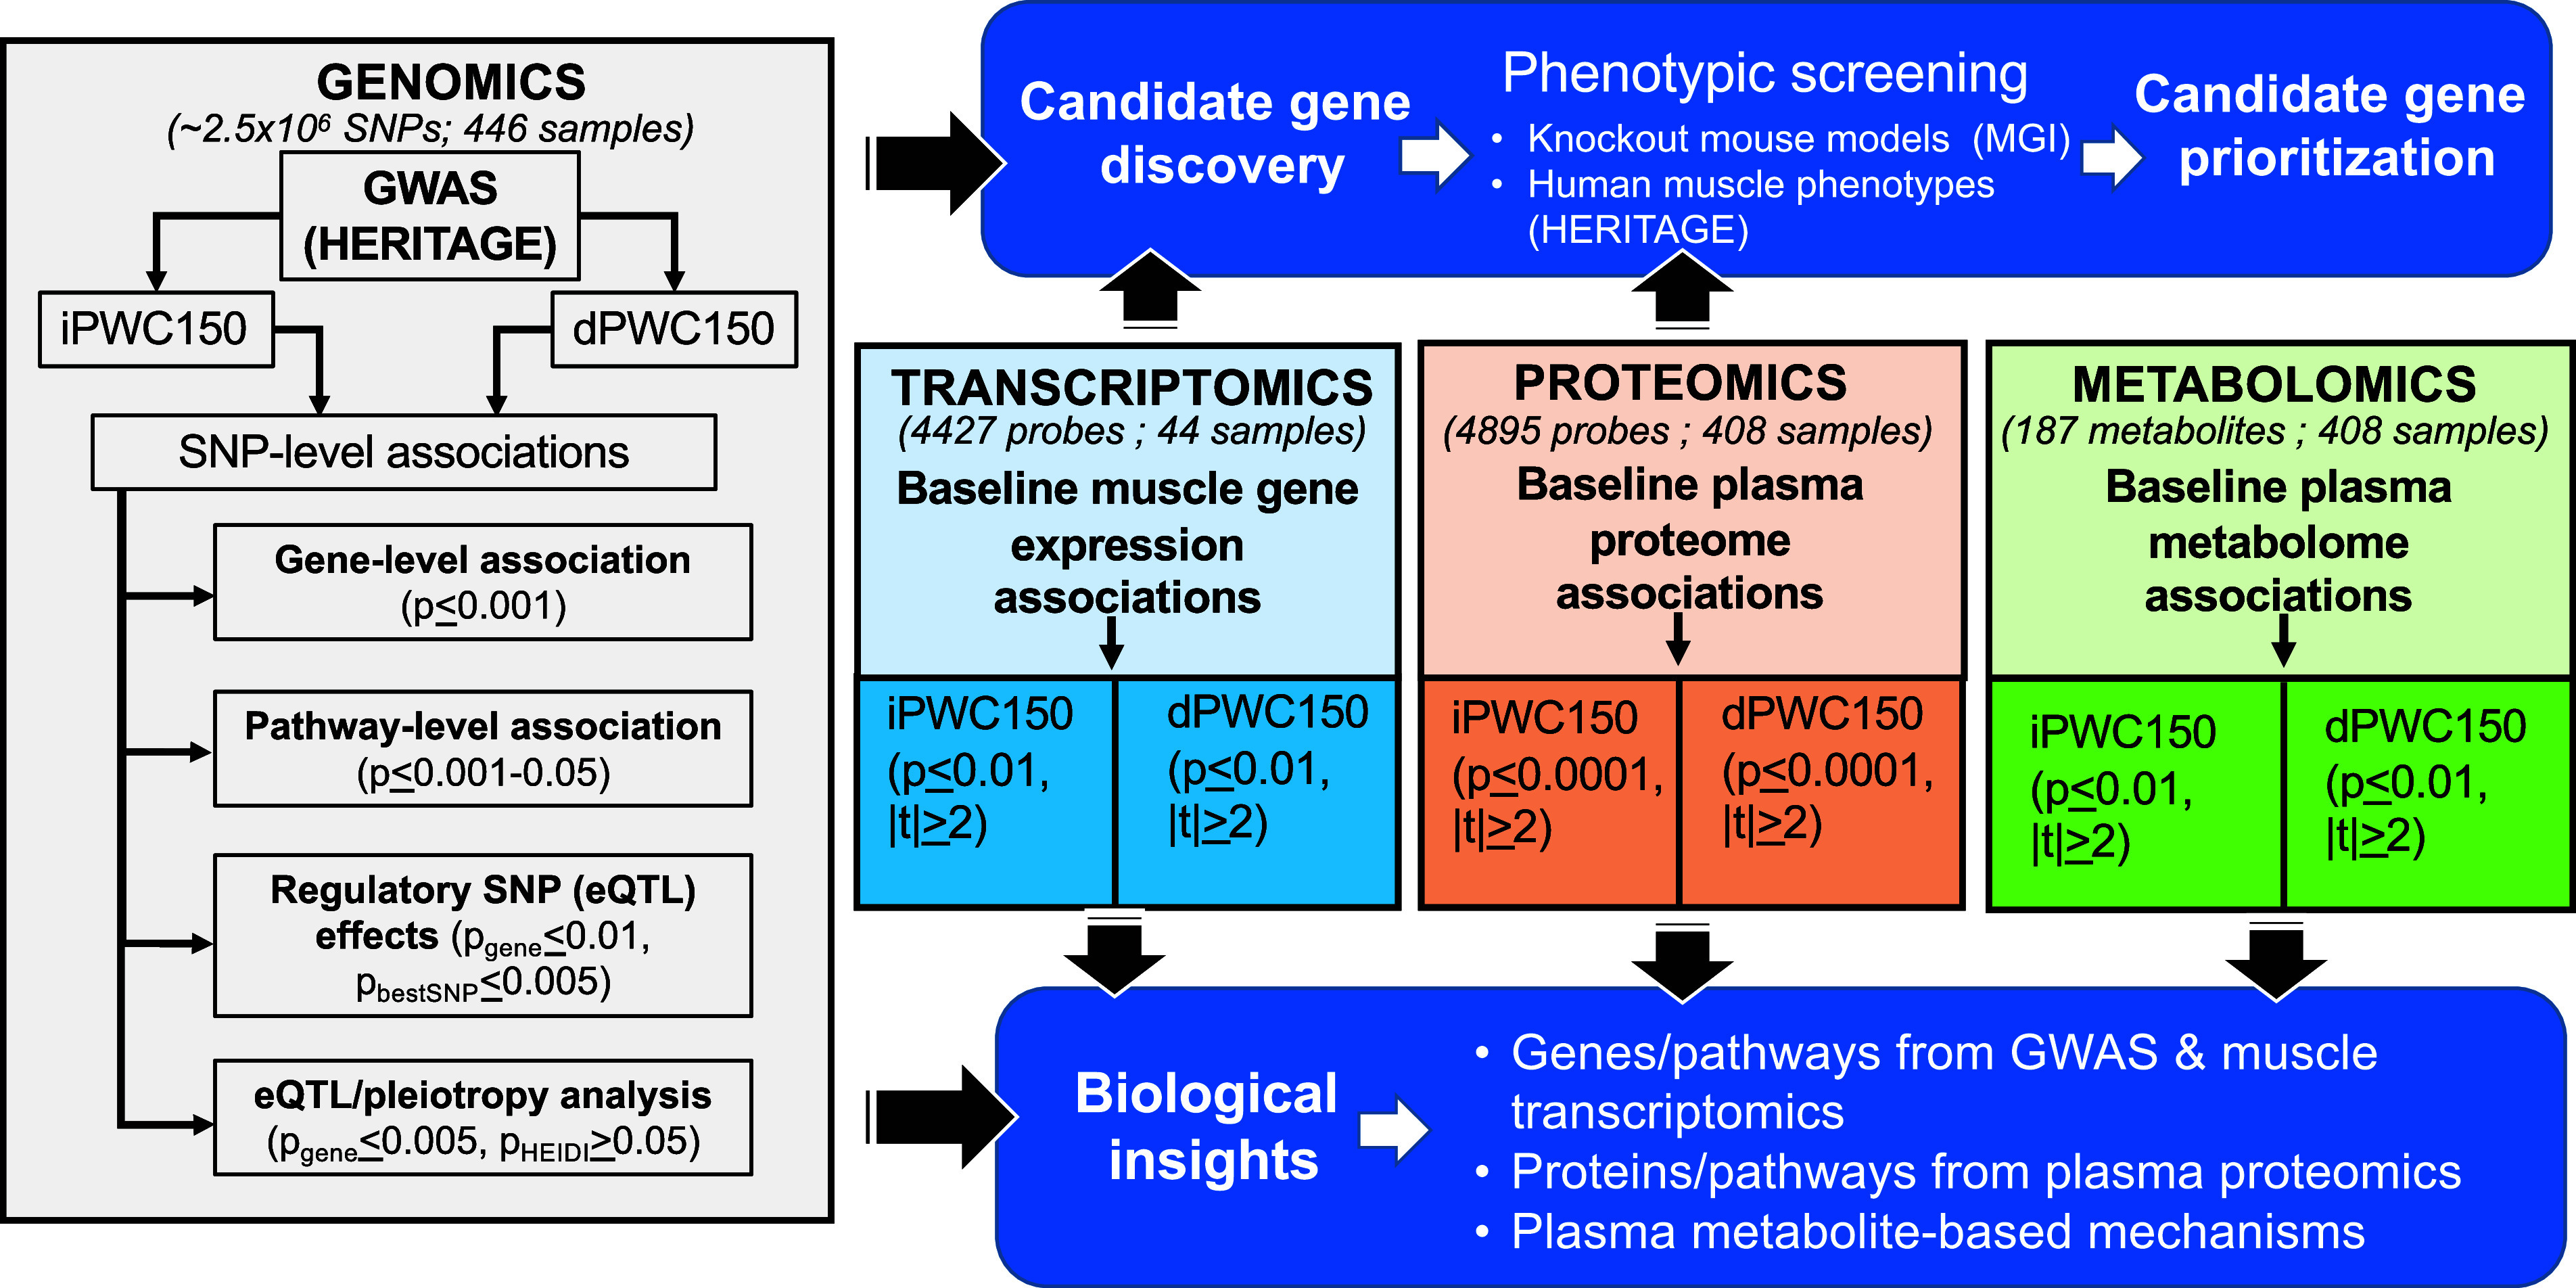
Schematic of the overall analysis approach. The four streams of analysis are shown in colored boxes: genome-wide association study (GWAS; gray), transcriptomics (blue), proteomics (orange), and metabolomics (green). For each stream, analysis is conducted independently for intrinsic and delta physical working capacity at a heart rate of 150 beats/min (iPWC150 and dPWC150, respectively) associations. The GWAS analysis pipeline consisted of using the single-nucleotide polymorphism (SNP)-level association data to compute gene- and pathway-level associations and to conduct expression quantitative trait loci (eQTL) analysis in skeletal muscle, adipose, and whole blood, including tests for pleiotropy of candidate eQTL SNPs. For transcriptomics, proteomics, and metabolomics data, the respective expression levels were tested for association to iPWC150 or dPWC150 via linear models, after adjustments for age, sex, and body mass index. GWAS, transcriptome, and proteome data were analyzed to identify a list of candidate genes (top blue box). The candidate genes were then examined for phenotypes in knockout mouse models (when available) and human cardiovascular and muscle-relevant phenotypes measured on HERITAGE participants. The results from the phenotype analyses were used to identify a list of prioritized candidate genes. in addition, the results from GWAS, transcriptomics, proteomics, and metabolomics were also interrogated to identify biological mechanisms (pathways) associated with iPWC150 and dPWC150 (bottom blue box).
From each of the genomic, transcriptomic, and proteomic data streams, a set of iPWC150- and dPWC150-associated candidate genes were identified and further evaluated for phenotypic corroboration. We interrogated potential genotype-phenotype associations of the candidate genes through an analysis of functional consequences of gene knockouts in mouse models (when available) from the MGI database. In addition to knockout mouse models, we also investigated the possible association of SNPs in the candidate genes with resting muscle-specific and resting and exercise-dependent cardiovascular phenotypes in HERITAGE subjects as described in Associations of SNPs With Cardiovascular and Skeletal Muscle Traits. As the metabolomics results are less suitable for the direct identification of candidate genes, we focused our analysis of metabolomics results more on the biological mechanisms affected in each of iPWC150 and dPWC150 comparisons.
Gene Scoring and Pathway Analysis
Pathway enrichment analysis of GWAS data was performed via two methods [Pascal (41) and GSA-SNP2 (42)], and the common and unique pathways identified in each method were determined. Pathways were obtained from the Kyoto Encyclopedia of Genes and Genomes (KEGG; c2.cp.kegg.v7.0.symbols, 186 gene sets), Hallmark (h.all.v7.0.symbols, 50 gene sets), and Gene Ontology Biological Process (GOBP; c5.bp.v7.0.symbols, 7,349 gene sets) databases downloaded from the Molecular Signature Database (MSigDB, RRID:SCR_016863) (v5.2) (43). Enrichment analysis was restricted to pathways containing between 15 and 200 gene members. Both Pascal and GSA-SNP2 rely on computing a gene-wide association P value from the P values of individual SNPs mapping to the gene (±20 kb upstream and downstream sequences) using method-specific statistics. Briefly, for GSA-SNP2, an adjusted gene score [adj(gi)] is generated for each gene according to the following equation:
where Pibest is the best P value among the SNPs assigned to gene gi and C(gi) is the estimated gene score derived from a monotonic cubic spline fit of the –log10(best P value) to the number of SNPs mapped to a gene. These adjusted gene scores are then used to arrive at a Z statistic for each pathway gene set Pj(1 ≤ j ≤ K) [Z(Pj)] according to the following equation:
where Pj is the average-adjusted gene score in the gene set, Pj and m and σ are the mean and standard deviation (SD), respectively, of all the adjusted gene scores, and Nj is the number of genes in the gene set. The pathway P value is derived from a one-tailed Z test, which offers better control of the false positive rate for GWAS data compared with a two-tailed test (44). In contrast to GSA-SNP2 scores, which are derived from the best P value of the gene-associated SNPs, in Pascal, we used the sum of χ squares (SOCS) statistic defined as follows:
where zi refers to the z score of the ith SNP (I = 1…n) mapped to a gene. These gene scores are then converted to pathway scores via empirical sampling using Monte Carlo-based methods.
Regulatory Genome Analysis: eQTLs
An eQTL-based gene-level estimate of association with iPWC150 or dPWC150 was developed via the Eugene package (34), by first combining all independent eQTLs (r2 < 0.05) found to alter expression of a gene in several eQTL datasets or by matching the eQTLs to their highest correlated proxy SNPs in the GWAS dataset (r2 > 0.8), if the eQTL SNP was not directly genotyped or imputed in GWAS. The observed GWAS association statistics of these SNPs with iPWC150 or dPWC150 were then converted to χ squares, and a gene-based sum statistic was calculated by adding all the χ squares. The statistical significance of the gene-level sum statistic was obtained via the Satterthwaite approximation method (35).
Summary Data-Based Mendelian Randomization
Evidence for a pleiotropic association of an eQTL SNP with both gene expression and genetic association to iPWC150 or dPWC150 was ascertained via the summary data-based Mendelian randomization (SMR) test (45). The SMR method tests the association of exposure (e.g., transcript) with an outcome (e.g., trait) using a genetic variant (e.g., top cis-eQTL strongly associated with gene expression) as the instrumental variable to remove nongenetic confounding. In other words, SMR tests if a transcript and phenotype are likely to be associated because of a shared causal variant (i.e., pleiotropy). Mathematically, if e is an exposure variable, o is the outcome variable, and i is an instrumental variable, then the MR estimate of the effect of exposure on outcome (beo) can be expressed as the ratio of the estimated effect of instrument on exposure (bie) and on outcome (bio), as follows:
beo = bio/bie
where bio and bie are available from gene expression, eQTL, and GWAS summary data.
To ensure that the instrument variable has a strong effect on exposure, only probes with at least one cis-eQTL at an eQTL P value < 5 × 10⁻⁸ were included in the eQTL summary data.
By itself, the SMR test reports a significant association that can arise either due to pleiotropy or linkage. In a pleiotropic model, the exposure and outcome are associated due to the same shared genetic variant. In contrast, a linkage model involves two or more genetic variants in linkage disequilibrium (LD) that affect the exposure and outcome independently. To distinguish between the two possibilities, the heterogeneity in independent instruments (HEIDI) test (45) examines the null hypothesis that a single causal variant is responsible for the observed associations to exposure and outcome. The test proceeds by considering multiple SNPs within a cis region and testing the homogeneity (or lack thereof) of the association patterns. A confirmation of the null hypothesis is interpreted as evidence in favor of the pleiotropy model. In this study, only significant SMR associations that were not significant in the HEIDI test (PHEIDI > 0.05) were retained. LD estimates were based on SNP data for 1000 Genomes European individuals (294 individuals, release 20130502_v5a) downloaded from the Eugene website (https://genepi.qimr.edu.au/staff/manuelF/eugene/download.html). eQTL data were examined from three whole blood datasets [Westra (46), CAGE (47), and GTEx_WB] and one GTEx-based dataset (48) each for skeletal muscle, subcutaneous adipose tissue (SAT), and VAT.
Affymetrix Microarray Analysis
Biopsies of vastus lateralis muscle were obtained in a sample of White subjects from the Laval University (Québec) Clinical Center of HERITAGE. Total RNA was isolated from frozen muscle biopsies preserved in Tissue-Tek using TRIzol and mRNA amplified with Ambion MessageAmp Premier following the manufacturer’s instructions. Global skeletal muscle gene expression profiles were generated by hybridization to Affymetrix HG-U133 Plus 2.0 arrays. Combined muscle gene expression and PWC phenotype data were available for 44 subjects. Background-corrected, quantile-normalized, and log2-transformed expression data were obtained via Robust Multichip Averages (RMA) (49). Probe sets with normalized maximum expression of ≥50 units (5.6 in log2 scale) and a coefficient of variation of ≥10% were retained, resulting in 4,427 probes for further analysis. The relation of gene expression to iPWC150 or dPWC150 levels was modeled via multivariate linear regression in R (tidyverse, https://www.tidyverse.org/). Association results for selected genes were visualized via partial residual regression plots via the “car” package in R (https://socialsciences.mcmaster.ca/jfox/Books/Companion/). The raw microarray data for this study have been deposited with Gene Expression Omnibus (GEO; RRID:SCR_005012) (50) and are accessible through GEO Series Accession No. GSE117070.
(https://www.ncbi.nlm.nih.gov/geo/query/acc.cgi?acc=GSE117070). Pathway enrichment analysis of gene expression data was conducted via the Gene Set Enrichment Analysis (GSEA) tool (RRID:SCR_003199) (51) using the same set of gene sets from MSigDB (KEGG, Hallmark, and GOBP) as was used for pathway analysis of GWAS data.
Proteomics Analysis
Baseline plasma proteome characterization was conducted via the SOMAScan platform from SomaLogic (www.somalogic.com) (52, 53). Briefly, archived baseline plasma samples stored at −80°C from HERITAGE were diluted in three different concentrations (40%, 1%, and 0.05%) and incubated with fluorescent single-stranded DNA aptamers (∼5,000 SOMAmers). Protein-aptamer complexes were isolated from unbound or nonspecifically bound proteins using a streptavidin bead-based immobilization procedure. Aptamers were subsequently eluted from the target proteins and quantified by their fluorescence on a DNA microarray chip. Samples were normalized to 12 hybridization control sequences within each microarray and across plates using the median signal for each dilution. After elimination of problematic analytes as reported by SomaLogic, which performed the assays for HERITAGE, 4,895 proteins were used for downstream analysis. Missing values in proteomic measurements were replaced by the median analyte expression across all samples. All proteomic abundance data were log2 normalized to approximate the normal distribution as determined by Shapiro test (54). Results of the association analysis were visualized for selected proteins via regression plots of the fitted protein expressions versus iPWC150 or dPWC150 values. The secretory status of a protein was ascertained by cross-referencing the human secretome data from the Universal Protein Resource, UniprotKB (RRID:SCR_002380, https://www.uniprot.org). Pathway enrichment analysis of proteomics data was conducted via the GSEA tool (51) using the same set of gene sets from MSigDB (KEGG, Hallmark, and GOBP) as was used for pathway analysis of GWAS data.
Metabolomics Analysis
Targeted metabolomics analyses were carried out on deproteinized archived baseline plasma samples stored at −80°C on two liquid chromatography-mass spectrometry (LC-MS)-based methods. In positive mode, normal phase hydrophilic interaction chromatography (HILIC) using a 2.1 × 150-mm 3-μm Atlantis column (Waters) was coupled to a 4000 QTrap triple quadrupole mass spectrometer (Applied Biosystems/Sciex) equipped with an electrospray ionization source and used a dynamic multiple reaction monitoring mechanism. In negative mode, HILIC chromatography using a 2.1 × 100-mm 3.5-μm Xbridge Amide column (Waters) was coupled to an Agilent 6490 triple quadrupole mass spectrometer equipped with an electrospray ionization source for detection using multiple reaction monitoring. Metabolite peak areas were integrated using Sciex MultiQuant software (positive mode) or Agilent Masshunter Quantitative Analysis software (RRID:SCR_015040) (negative mode). All metabolite peaks were manually reviewed for peak quality in a blinded manner by two separate analysts. Pooled plasma samples were interspersed within each analytic run at standardized intervals, enabling the monitoring and correction for temporal drift in MS performance. The drift-corrected data, measuring relative abundances of metabolites, were used without further transformation in downstream analysis. The final dataset consisted of 187 plasma metabolites measured in 408 HERITAGE White subjects. Due to the variation in estimated metabolite levels, the metabolomics data were “squished” before analysis such that for each metabolite, values at <2 percentile or >98 percentile were converted to the 2 percentile or 98 percentile values, respectively. The results of the association analysis were visualized via regression plots of the fitted metabolite expressions versus iPWC150 or dPWC150 values.
Analysis of Mouse Phenotypes
We queried the Mouse Genome Informatics (MGI; www.informatics.jax.org) database to identify and classify mouse phenotypes that are affected by knockout of the candidate genes identified from the bioinformatics (GWAS), genomic, and proteomic analyses. From the GWAS analysis of iPWC150 and dPWC150 data, genes were selected based on the collective evidence for one or more of the following: 1) top 0.1% of gene-trait association to iPWC150 or dPWC150; 2) membership in common pathways identified by GSA-SNP2 and Pascal and with gene-level GWAS association P value ≤ 0.05; 3) top 10 eQTL gene in adipose, skeletal muscle, and whole blood; and 4) gene transcriptionally affected by a pleiotropic SNP with SMR P value ≤ 5 × 10⁻⁴. From gene expression studies, genes with an association P value ≤0.05 and absolute regression coefficient ≥0.008 with iPWC150 or dPWC150 levels were selected. Similarly, plasma proteins with an association P value ≤0.0001 with iPWC150 or dPWC150 were also included. Only mouse phenotypes arising from spontaneous mutations, targeted gene knockout, or gene trap studies were considered, to avoid confounding effects in other mouse models (e.g., mutations in unrelated genes in chemical mutagenesis or multiple gene knockout-type models). Phenotypes associated with the query genes were further grouped into their “root phenotypes” according to the hierarchical ontology used in the MGI V6.07 mammalian phenotype browser.
Associations of SNPs With Cardiovascular and Skeletal Muscle Traits
Based on the bioinformatics analysis of GWAS and multi-omics-based correlations with iPWC150 and dPWC150, we identified several genes for which mapped SNPs (gene body ±50 kb upstream and downstream) were tested for associations with select resting and exercise cardiovascular and muscle-related traits. Highly correlated SNPs were removed before trait association analysis by filtering out biallelic SNPs with r2 ≤ 0.9 and MAF < 0.01, via the SNPClip module of LDLink software, using the 1000 Genomes (Phase 3) CEU reference panel for LD estimation (55). SNP-trait association was performed through the total association model of MERLIN (56) with age and sex as covariates. This model uses a variance-components framework to combine the phenotypic means model and the estimates of additive genetic, residual genetic, and residual environmental variances from a variance-covariance matrix into a single likelihood model. An association P value of ≤0.01 was considered significant.
RESULTS
Study Population and Intrinsic and Delta PWC150 Distributions
A total of 446 White subjects from the HERITAGE Family Study who completed the exercise program and had valid measures of iPWC150 and dPWC150 were available for the study. Their mean age and body mass index were 36 yr (SD = 14.6) and 25.8 kg/m2 (SD = 4.9), respectively. The basic characteristics of the study population are shown in Table 1. The mean iPWC150 was 118 W (SD = 41 W), and the mean increase in PWC150 with the exercise program (dPWC150) was 33 W (SD = 25). V̇o2max per kilogram body weight increased from 33.2 (SD = 8.8) at baseline to 38.6 (SD = 9.6) posttraining. The mean dPWC150 was 31% (SD = 25), which was substantially higher than the 17% gain in V̇o2max registered for this population. The distributions of iPWC150 and dPWC150 were highly heterogeneous, as shown in Fig. 2.
Table 1.
Basic characteristics of HERITAGE White adults constituting the study population (n = 446)
| Variable | Baseline | Posttraining | Change | Percent Change |
|---|---|---|---|---|
| Age, yr | 36.0 (14.6) | |||
| Body mass index, kg/m2 | 25.8 (4.9) | 25.7 (5.0)† | −0.07 (0.7) | −0.2 (2.8) |
| PWC150, W | 118 (41) | 151 (51)* | 33 (25) | 31.0 (25.0) |
| Heart rate at 50 W, beats/min | 117 (17) | 106 (14)* | −11 (10) | −8.7 (7.6) |
| Workload at maximum, W | 183.3 (58.0) | 233.7 (72.6)* | 50.4 (26.5) | 28.5 (13.8) |
| V̇o2max, mL/min | 2449 (725) | 2843 (798)* | 393 (216) | 16.9 (9.0) |
| V̇o2max, mL/kg/min | 33.2 (8.8) | 38.6 (9.6)* | 5.4 (3.1) | 17.2 (9.8) |
Values given as means (SD). PWC150, physical working capacity at a heart rate of 150 beats/min; V̇o2max, maximal oxygen consumption. *P < 0.0001 and †P < 0.05 for difference compared with the baseline value.
Figure 2.

Distribution of intrinsic and delta physical working capacity at a heart rate of 150 beats/min (iPWC150 and dPWC150, respectively) responses to training in HERITAGE subjects. A: distribution of iPWC150 values in HERITAGE subjects in the sedentary state ordered from low to high. B: histogram of dPWC150 values across 10 classes of response levels to the exercise training program in the same set of HERITAGE White adults. Results are based on complete data on 446 White adults.
Our first hypothesis, which stipulates that the panel of identified genes will be substantially different between intrinsic V̇o2max and iPWC150, assumed that there was only a moderate correlation between intrinsic V̇o2max and iPWC150. This assumption was borne out by the fact that the common variance between intrinsic V̇o2max and iPWC150, both adjusted for age and sex, reached 32% (P < 0.0001), implying that there was substantial differential variance between both indicators of cardiorespiratory fitness.
Our second hypothesis specified that the panel of prioritized genes will differ markedly between iPWC150 and its training response. This was predicated on the fact that there would be only weak correlations between iPWC150 and dPWC150. Again, the data strongly suggested that it was truly the case, as the correlation between iPWC150 (adjusted for age and sex) and dPWC150 (adjusted for age, sex, and iPWC150) was a negative, −0.18 (P < 0.0001). Thus, the two PWC traits are independent of each other, which should be reflected in the underlying biology, as explored in the present study.
Gene-Level GWAS Association Scores
From the SNP-level association P values for iPWC150 or dPWC150, we generated gene-level association scores and P values through the sum of χ squares method in Pascal. Sixteen genes (SEPTIN14, FAM92B, LRGUK, LMO7, CBLB, EDDM3B, HSD17B6, ZNF845, TMEM256, BAZ2A, EPHA7, RNASE6, ATP5B, SNORD59A, SNORD59B, and ANXA6) were associated with iPWC150 at a P value of ≤1 × 10⁻³, whereas for dPWC150, seven genes were associated at the same P value threshold (RTP1, LBX1, DNAH10, FLJ41350, LIG4, ACTR3BP, and GUCY1A3). Details of the gene-wide association scores are provided in Supplemental Table S2.
Pathway Enrichment Analysis: GWAS
Pathway enrichment analysis was conducted on SNP-level data via GSA-SNP2 and Pascal through query of the KEGG, Hallmark, and GOBP pathway databases from MSigDB. Due to differences in the total number of pathways present in each pathway database and the statistical tests used in each pathway enrichment tool, we adjusted the criteria of pathway significance as follows: nominal P values of <0.05 for KEGG and Hallmark pathways and <0.001 for GOBP pathways for GSA-SNP2 and nominal P values of <0.05 for KEGG and Hallmark and <0.01 for GOBP for Pascal (empirical P value) (full results from all pathway analysis are provided in Supplemental Table S3). Based on these criteria, a total of 123 and 58 pathways were found to be significant for baseline data in GSA-SNP2 and Pascal, respectively, of which 17 pathways were identified by both tools (Poverlap < 2.2 × 10⁻¹⁶ by Fisher’s exact test). For dPWC150 data, 66 and 56 pathways were significant in GSA-SNP2 and Pascal, with 5 pathways called by both (Poverlap < 1.08 × 10⁻¹⁵ by Fisher’s exact test; Fig. 3, A and B). Pathways related to calcium transport and signaling, purinergic signaling, neurotransmitter secretion, and the immune response were among those significantly associated with iPWC150. Pathways related to oxygen and amino acid transport, chromosomal integrity, and reactive oxygen species generation were significantly associated with dPWC150.
Figure 3.

Pathway enrichment analysis based on single-nucleotide polymorphism (SNP) associations to intrinsic and delta physical working capacity at a heart rate of 150 beats/min (iPWC150 and dPWC150, respectively). A: pathways identified in common by GSASNP2 and Pascal for iPWC150-associated SNPs. The dendrogram was arranged by the extent of gene overlap between pathways. The enrichment P values for each pathway in GSASNP2 and Pascal are indicated in the table to the right of the dendrogram. B: dendrogram of common enriched pathways based on dPWC150-associated SNPs. Pathway P values in GSASNP2 and Pascal are indicated to the right of each pathway. KEGG, Kyoto Encyclopedia of Genes and Genomes.
Analysis of eQTL
We performed a gene-based association analysis of eQTL by interrogating eQTL datasets related to adipose, skeletal muscle, and whole blood through the algorithm implemented in Eugene (57). For adipose and skeletal muscle, we used eQTL data available from GTEx (48), whereas for whole blood eQTLs, data were examined from three different sources (46–48). By restricting the analysis to gene-based P values ≤ 0.01, where the best independent eQTL (or its proxy) for the gene had a GWAS P value ≤ 0.005, we identified 53 eQTL target genes in iPWC150 and 52 eQTL-associated genes in dPWC150 (Supplemental Table S4). Of these, six genes were eQTL targets in two or more tissues for baseline iPWC150 (PSPHP1, EMC1, PQLC3, RP11-18H21.1, RP11-499P20.2, and RP1-15D23.2), whereas seven genes were multitissue eQTL targets in dPWC150 (C15orf65, SEPTIN2, C14orf79, HAUS4, RP11-616M22.5, TOM1L2, and TPSD1). Several of the eQTL genes with names beginning with RP11 were noncoding (antisense and lincRNAs). The top five eQTL-associated genes from each tissue are shown in Table 2, along with the direction of gene expression and trait association.
Table 2.
Top Eugene-supported trait-associated genes based on adipose, skeletal muscle, and whole blood eQTL data analysis
| Gene | Gene-Based P Value | Best eQTL or Proxy | GWAS Effect Allele | GWAS Effect Size | GWAS P Value | eQTL Effect Allele | eQTL Effect Size | eQTL P Value | eQTL Study | Trait |
|---|---|---|---|---|---|---|---|---|---|---|
| RP11-18H21.1 | 1.12E-04 | rs17276450 | A | 0.298 | 1.62E-04 | A | −0.73872 | 1.42E-19 | Adipose (GT) | iPWC150 |
| RNF165 | 1.49E-04 | rs12604983 | G | −0.36 | 1.49E-04 | A | 0.585809 | 5.98E-19 | Adipose (GT) | iPWC150 |
| KCNE3 | 4.20E-04 | rs3853688 | G | −0.271 | 4.20E-04 | G | −0.49713 | 3.21E-25 | Adipose (GT) | iPWC150 |
| RP11-702H23.6 | 4.20E-04 | rs3853688 | G | −0.271 | 4.20E-04 | G | −0.50854 | 9.19E-23 | Adipose (GT) | iPWC150 |
| RP1-15D23.2 | 6.60E-04 | rs704841 | C | 0.281 | 6.60E-04 | C | −0.50184 | 3.15E-15 | Adipose (GT) | iPWC150 |
| PSPHP1 | 6.85E-04 | rs4948075 | A | −0.017 | 1.08E-04 | A | 1.11999 | 8.27E-74 | Muscle (GT) | iPWC150 |
| RP1-15D23.2 | 7.99E-04 | rs12749912 | G | −0.252 | 7.99E-04 | G | 0.392965 | 1.78E-11 | Muscle (GT) | iPWC150 |
| PDSS2 | 1.03E-03 | rs7774958 | C | −0.286 | 1.03E-03 | C | 0.361829 | 3.38E-23 | Muscle (GT) | iPWC150 |
| EMC1 | 1.15E-03 | rs3748759 | C | 0.239 | 1.15E-03 | G | −0.43259 | 7.47E-22 | Muscle (GT) | iPWC150 |
| CHD1L | 1.39E-03 | rs6658826 | A | −0.246 | 1.39E-03 | A | 0.534457 | 2.38E-23 | Muscle (GT) | iPWC150 |
| GALNT3 | 4.34E-04 | rs2304002 | A | −0.257 | 4.34E-04 | A | 0.630615 | 1.61E-23 | Adipose (GT) | dPWC150 |
| DDX25 | 7.59E-04 | rs540225 | C | 0.273 | 7.59E-04 | C | −0.52985 | 6.61E-11 | Adipose (GT) | dPWC150 |
| TOM1L2 | 1.10E-03 | rs3744115 | G | −0.249 | 1.10E-03 | G | 0.25181 | 1.93E-10 | Adipose (GT) | dPWC150 |
| C8orf33 | 1.13E-03 | rs13270948 | A | −0.295 | 1.13E-03 | C | 0.36659 | 1.43E-12 | Adipose (GT) | dPWC150 |
| HAUS4 | 1.28E-03 | rs2295687 | A | −0.247 | 1.28E-03 | G | −0.48066 | 8.33E-17 | Adipose (GT) | dPWC150 |
| HDHD3 | 2.65E-04 | rs16936474 | A | −0.498 | 2.65E-04 | C | −0.67445 | 2.83E-21 | Muscle (GT) | dPWC150 |
| TOM1L2 | 1.10E-03 | rs16960744 | A | −0.249 | 1.10E-03 | T | 0.346506 | 2.08E-20 | Muscle (GT) | dPWC150 |
| HLA-K | 1.21E-03 | rs2517897 | A | −0.378 | 3.09E-04 | A | −0.52585 | 3.10E-10 | Muscle (GT) | dPWC150 |
| HAUS4 | 1.28E-03 | rs2295687 | A | −0.247 | 1.28E-03 | G | −0.3215 | 5.87E-13 | Muscle (GT) | dPWC150 |
| C14orf79 | 1.51E-03 | rs2582577 | T | 0.308 | 1.51E-03 | T | 0.371368 | 7.29E-15 | Muscle (GT) | dPWC150 |
| FLVCR1-AS1 | 3.87E-05 | rs1692189 | A | 0.357 | 3.23E-05 | G | −0.61773 | 2.43E-18 | WB (WA) | dPWC150 |
| ALG1L2 | 6.39E-04 | rs10934906 | T | −0.307 | 6.39E-04 | C | −0.68378 | 4.09E-17 | WB (GT) | dPWC150 |
| HMGXB3 | 7.72E-04 | rs245076 | C | 0.293 | 7.72E-04 | C | −0.18942 | 1.60E-09 | WB (LJ) | dPWC150 |
| EIF2B1 | 9.37E-04 | rs11057379 | G | 0.025 | 4.13E-05 | G | 7.39 | 1.50E-13 | WB (FE) | dPWC150 |
| CSF1R | 1.01E-03 | rs245080 | G | 0.302 | 4.04E-04 | G | 0.338523 | 1.20E-26 | WB (LJ) | dPWC150 |
| RP11-18H21.1 | 1.12E-04 | rs17276450 | A | 0.298 | 1.62E-04 | A | −0.73872 | 1.42E-19 | WB (GT) | iPWC150 |
| RNF165 | 1.49E-04 | rs12604983 | G | −0.36 | 1.49E-04 | A | 0.585809 | 5.98E-19 | WB (GT) | iPWC150 |
| CCDC137 | 2.63E-04 | rs12452184 | T | −0.268 | 2.63E-04 | C | 0.025649 | 6.64E-15 | WB (YA) | iPWC150 |
| KCNE3 | 4.20E-04 | rs3853688 | G | −0.271 | 4.20E-04 | G | −0.49713 | 3.21E-25 | WB (GT) | iPWC150 |
| RP11-702H23.6 | 4.20E-04 | rs3853688 | G | −0.271 | 4.20E-04 | G | −0.50854 | 9.19E-23 | WB (GT) | iPWC150 |
The top five trait-associated genes from each tissue are reported for intrinsic and delta physical working capacity at a heart rate of 150 beats/min (iPWC150 and dPWC150, respectively), sorted by the gene P values. For genes targeted by multiple independent eQTLs, the SNP with the smallest eQTL P value is retained. Column 1, gene name; column 2, Eugene supported gene-trait association P value; column 3, best eQTL SNP (or GWAS proxy) targeting the gene; column 4, GWAS effect allele; column 5, GWAS effect size; column 6, GWAS P value; column 7, eQTL effect allele; column 8, eQTL effect size; column 9, eQTL P value; column 10, public eQTL database [WB, whole blood; GT, GTEx; LJ, Lloyd Jones (CAGE); FE, Fehrmann; WA, Walsh; YA, Yao]; column 11, GWAS used (iPWC150 or dPWC150).
Analysis of Pleiotropy in eQTL SNPs by SMR
We next examined if the identified eQTLs also showed evidence of pleiotropy (same SNP responsible for influencing gene expression as well as association to iPWC150 or dPWC150) contrasted to linkage (2 linked SNPs independently affecting gene expression and trait association). The analysis used a Mendelian randomization-based approach developed in the SMR program. SMR analysis was restricted to eQTL data from whole blood, SAT, VAT, and skeletal muscle datasets, as described in methods. A total of 47 and 55 genes were found to be significant in SMR analysis in at least one eQTL database (PSMR ≤ 0.005) for the iPWC150 and dPWC150 data, respectively, with strong evidence for pleiotropy (PHEIDI > 0.05; Supplemental Table S5). A subset of these genes was found to be eQTLs in more than one tissue type including skeletal muscle (RP11-499P20.2 and CHD1L for iPWC150 and SEPTIN2, C14orf79, GALNT3, HAUS4, TOM1L2, and TPSD1 for dPWC150), as shown in Table 3. Of these, the RP11-499P20.2 and SEPTIN 2 genes were significant eQTL targets in all four tissue types examined in SMR (whole blood, SAT, VAT, and muscle), whereas others, such as the actin filament-associated protein 1 (AFAP1) gene, were only significant in skeletal muscle eQTLs. Locus and effect plots for RP11-499P20.2 and AFAP1 in skeletal muscle are shown in Fig. 4, A and B. In these plots, the top panel shows SNP P values for the relevant GWAS experiments (iPWC150 or dPWC150) and the bottom plots show the eQTL P value distribution of the same SNPs from the relevant eQTL database, along with genomic features around the cis-eQTLs.
Table 3.
Top SMR hits from PWC150 GWAS and skeletal muscle eQTLs
| Gene | topSNP | topSNP_pos | GWAS Effect Allele | GWAS Other Allele | Effect Allele Frequency | Effect Size (GWAS) | P value (GWAS) | Effect Size (eQTL) | P value (eQTL) | Effect Size (SMR) | P value (SMR) | P value (HEIDI) | eQTL Database | Trait |
|---|---|---|---|---|---|---|---|---|---|---|---|---|---|---|
| CHD1L | rs2353986 | 1:146821869 | C | T | 0.66 | 0.25 | 1.39E-03 | −0.43 | 4.97E-20 | −0.58 | 2.55E-03 | 8.53E-01 | MUS (G) | iPWC150 |
| CHD1L | rs10793652 | 1:146707543 | A | G | 0.51 | 0.25 | 8.12E-04 | 0.31 | 3.97E-23 | 0.80 | 1.50E-03 | 7.35E-01 | WB (G) | iPWC150 |
| DEFB124 | rs717064 | 20:30066356 | T | G | 0.14 | 0.37 | 2.01E-03 | 0.83 | 5.67E-27 | 0.44 | 2.96E-03 | 9.37E-01 | MUS (G) | iPWC150 |
| EMC1 | rs12062540 | 1:19529204 | G | A | 0.40 | 0.24 | 1.16E-03 | −0.32 | 2.16E-21 | −0.75 | 1.99E-03 | 1.00E-01 | MUS (G) | iPWC150 |
| EMC1 | rs709683 | 1:19565344 | G | C | 0.32 | 0.22 | 3.26E-03 | −0.42 | 2.67E-32 | −0.52 | 4.25E-03 | 3.90E-01 | SAT (G) | iPWC150 |
| ENTPD1-AS1 | rs3088372 | 10:97927802 | A | T | 0.11 | 0.38 | 1.36E-03 | 0.42 | 1.57E-09 | 0.91 | 4.58E-03 | 1.92E-01 | MUS (G) | iPWC150 |
| MTMR6 | rs1129861 | 13:25909954 | A | G | 0.07 | −0.35 | 3.65E-03 | 0.42 | 3.59E-28 | −0.83 | 4.94E-03 | 4.59E-01 | MUS (G) | iPWC150 |
| PDSS2 | rs7774958 | 6:107493418 | C | T | 0.29 | −0.29 | 1.03E-03 | 0.32 | 1.19E-25 | −0.90 | 1.71E-03 | 3.43E-01 | MUS (G) | iPWC150 |
| RP11-499P20.2 | rs10741091 | 10:18802307 | G | C | 0.38 | −0.23 | 2.99E-03 | 0.45 | 1.47E-19 | −0.51 | 4.72E-03 | 5.35E-01 | MUS (G) | iPWC150 |
| RP11-499P20.2 | rs10764582 | 10:18823279 | A | T | 0.39 | −0.23 | 2.99E-03 | 0.69 | 1.55E-42 | −0.33 | 3.66E-03 | 1.66E-01 | SAT (G) | iPWC150 |
| RP11-499P20.2 | rs7088091 | 10:18804094 | C | T | 0.38 | −0.23 | 2.99E-03 | 0.74 | 5.17E-31 | −0.31 | 3.97E-03 | 1.21E-01 | VAT (G) | iPWC150 |
| RP11-499P20.2 | rs11015312 | 10:18932953 | A | G | 0.38 | −0.23 | 2.99E-03 | 0.69 | 8.17E-33 | −0.33 | 3.91E-03 | 2.36E-01 | WB (G) | iPWC150 |
| RP13-467H17.1 | rs4567083 | 8:143488279 | T | C | 0.84 | 0.30 | 2.39E-03 | 0.47 | 3.21E-14 | 0.63 | 4.64E-03 | 2.66E-01 | MUS (G) | iPWC150 |
| RP13-467H17.1 | rs6583620 | 8:143450095 | C | G | 0.13 | −0.35 | 5.27E-04 | −0.57 | 2.39E-10 | 0.60 | 2.45E-03 | 4.48E-01 | SAT (G) | iPWC150 |
| ZNF845 | rs8113071 | 19:53834333 | G | T | 0.55 | 0.25 | 9.33E-04 | 0.34 | 5.01E-16 | 0.73 | 2.28E-03 | 4.53E-01 | MUS (G) | iPWC150 |
| AFAP1 | rs13127935 | 4:7913961 | T | C | 0.36 | 0.26 | 1.01E-03 | −0.20 | 2.64E-10 | −1.31 | 3.41E-03 | 1.21E-01 | MUS (G) | dPWC150 |
| C14orf79 | rs2582574 | 14:105454529 | G | A | 0.21 | 0.30 | 1.52E-03 | 0.39 | 4.50E-20 | 0.77 | 2.65E-03 | 9.12E-01 | MUS (G) | dPWC150 |
| C14orf79 | rs2582577 | 14:105450112 | T | C | 0.22 | 0.31 | 1.51E-03 | 0.51 | 1.81E-24 | 0.60 | 2.43E-03 | 3.50E-01 | SAT (G) | dPWC150 |
| C14orf79 | rs2582574 | 14:105454529 | G | A | 0.21 | 0.30 | 1.52E-03 | 0.35 | 6.90E-14 | 0.85 | 3.41E-03 | 8.94E-01 | VAT (G) | dPWC150 |
| GALNT3 | rs2304002 | 2:166714095 | A | G | 0.43 | −0.26 | 4.34E-04 | 0.50 | 1.85E-23 | −0.52 | 9.00E-04 | 2.58E-01 | MUS (G) | dPWC150 |
| GALNT3 | rs2304002 | 2:166714095 | A | G | 0.43 | −0.26 | 4.34E-04 | 0.62 | 1.13E-35 | −0.42 | 7.04E-04 | 2.92E-01 | SAT (G) | dPWC150 |
| GALNT3 | rs2304002 | 2:166714095 | A | G | 0.43 | −0.26 | 4.34E-04 | 0.41 | 1.90E-16 | −0.62 | 1.21E-03 | 1.88E-01 | VAT (G) | dPWC150 |
| HAUS4 | rs4981455 | 14:23422453 | G | A | 0.53 | 0.25 | 1.28E-03 | −0.35 | 4.51E-27 | −0.71 | 2.11E-03 | 4.93E-01 | MUS (G) | dPWC150 |
| HAUS4 | rs4981455 | 14:23422453 | G | A | 0.53 | 0.25 | 1.28E-03 | −0.70 | 1.25E-80 | −0.35 | 1.56E-03 | 3.73E-01 | SAT (G) | dPWC150 |
| HAUS4 | rs4981455 | 14:23422453 | G | A | 0.53 | 0.25 | 1.28E-03 | −0.56 | 2.36E-34 | −0.44 | 1.92E-03 | 3.87E-01 | VAT (G) | dPWC150 |
| IFI27L1 | rs882269 | 14:94566559 | T | C | 0.56 | −0.23 | 2.69E-03 | 0.50 | 7.04E-49 | −0.46 | 3.42E-03 | 7.34E-01 | MUS (G) | dPWC150 |
| MED23 | rs3756784 | 6:131950233 | G | T | 0.21 | 0.34 | 1.11E-03 | −0.27 | 4.10E-11 | −1.28 | 3.47E-03 | 8.06E-01 | MUS (G) | dPWC150 |
| N4BP2 | rs7674515 | 4:40064563 | T | C | 0.08 | −0.48 | 2.57E-03 | 0.88 | 1.42E-15 | −0.54 | 4.90E-03 | 4.63E-02 | MUS (G) | dPWC150 |
| SEPTIN2 | rs11681497 | 2:242344333 | G | A | 0.09 | 0.49 | 2.13E-04 | 0.35 | 1.47E-14 | 1.41 | 8.86E-04 | 1.47E-01 | WB(LJ) | dPWC150 |
| SEPTIN2 | rs2074771 | 2:242350944 | G | A | 0.09 | 0.48 | 3.41E-04 | 1.17 | 7.26E-139 | 0.41 | 3.70E-04 | 1.40E-01 | WB(LJ) | dPWC150 |
| SEPTIN2 | rs2074771 | 2:242350944 | G | A | 0.09 | 0.48 | 3.41E-04 | 1.26 | 5.99E-162 | 0.38 | 3.63E-04 | 9.19E-02 | WB(LJ) | dPWC150 |
| SEPTIN2 | rs7601738 | 2:242375813 | T | A | 0.09 | 0.49 | 2.13E-04 | 0.68 | 4.11E-45 | 0.73 | 3.62E-04 | 2.82E-01 | MUS (G) | dPWC150 |
| SEPTIN2 | rs757978 | 2:242371101 | T | C | 0.09 | 0.49 | 2.13E-04 | 0.77 | 1.21E-53 | 0.64 | 3.36E-04 | 9.97E-02 | SAT (G) | dPWC150 |
| SEPTIN2 | rs7601738 | 2:242375813 | T | A | 0.09 | 0.49 | 2.13E-04 | 0.71 | 1.67E-41 | 0.70 | 3.76E-04 | 2.03E-01 | VAT (G) | dPWC150 |
| SEPTIN2 | rs7601738 | 2:242375813 | T | A | 0.09 | 0.49 | 2.13E-04 | 0.49 | 4.23E-31 | 1.02 | 4.43E-04 | 2.32E-02 | WB (G) | dPWC150 |
| SEPTIN2 | rs7601738 | 2:242375813 | T | A | 0.09 | 0.49 | 2.13E-04 | 1.03 | 6.42E-294 | 0.48 | 2.44E-04 | 1.16E-01 | WB(W) | dPWC150 |
| TOM1L2 | rs8066560 | 17:17728043 | G | A | 0.58 | 0.25 | 1.26E-03 | 0.35 | 3.10E-34 | 0.70 | 1.76E-03 | 8.46E-01 | MUS (G) | dPWC150 |
| TOM1L2 | rs7501812 | 17:17750907 | A | G | 0.56 | 0.25 | 1.10E-03 | 0.28 | 7.75E-19 | 0.88 | 2.12E-03 | 6.85E-01 | SAT (G) | dPWC150 |
| TPSD1 | rs2745084 | 16:1294025 | G | A | 0.52 | 0.22 | 3.60E-03 | 0.77 | 2.47E-54 | 0.29 | 4.26E-03 | 1.04E-01 | MUS (G) | dPWC150 |
| TPSD1 | rs2745084 | 16:1294025 | G | A | 0.52 | 0.22 | 3.60E-03 | 0.97 | 2.73E-69 | 0.23 | 4.12E-03 | 1.02E-01 | SAT (G) | dPWC150 |
| VPS37C | rs471718 | 11:60913487 | C | A | 0.55 | 0.25 | 1.44E-03 | −0.17 | 1.58E-13 | −1.46 | 3.48E-03 | 7.54E-01 | MUS (G) | dPWC150 |
| WISP1 | rs16904845 | 8:134199776 | C | T | 0.34 | −0.27 | 1.36E-03 | 0.34 | 4.14E-09 | −0.80 | 4.92E-03 | 5.56E-01 | MUS (G) | dPWC150 |
Genes with summary data-based Mendelian randomization (SMR) P values of ≤5E − 03 and HEIDI P values of >0.05 are shown. Column 1, gene name; column 2, top instrumental single-nucleotide polymorphism (SNP) used in SMR; column 3, chromosome and position of top SNP (hg19); column 4, effect allele; column 5, noneffect allele; column 6, effect allele frequency; column 7, SNP effect size in genome-wide association study (GWAS); column 8, SNP GWAS P value; column 9, SNP effect size in expression quantitative trait loci (eQTL) data; column 10, SNP eQTL P value; column 11, SNP effect size in SMR; column 12, SNP SMR P value; column 13, SNP HEIDI P value; column 14, eQTL tissue (MUS, skeletal muscle; SAT, subcutaneous adipose tissue; VAT, visceral adipose tissue; WB, whole blood; G, GTEx; W, Westra eQTL data; LJ, Lloyd Jones (CAGE); column 15, GWAS study.
Figure 4.
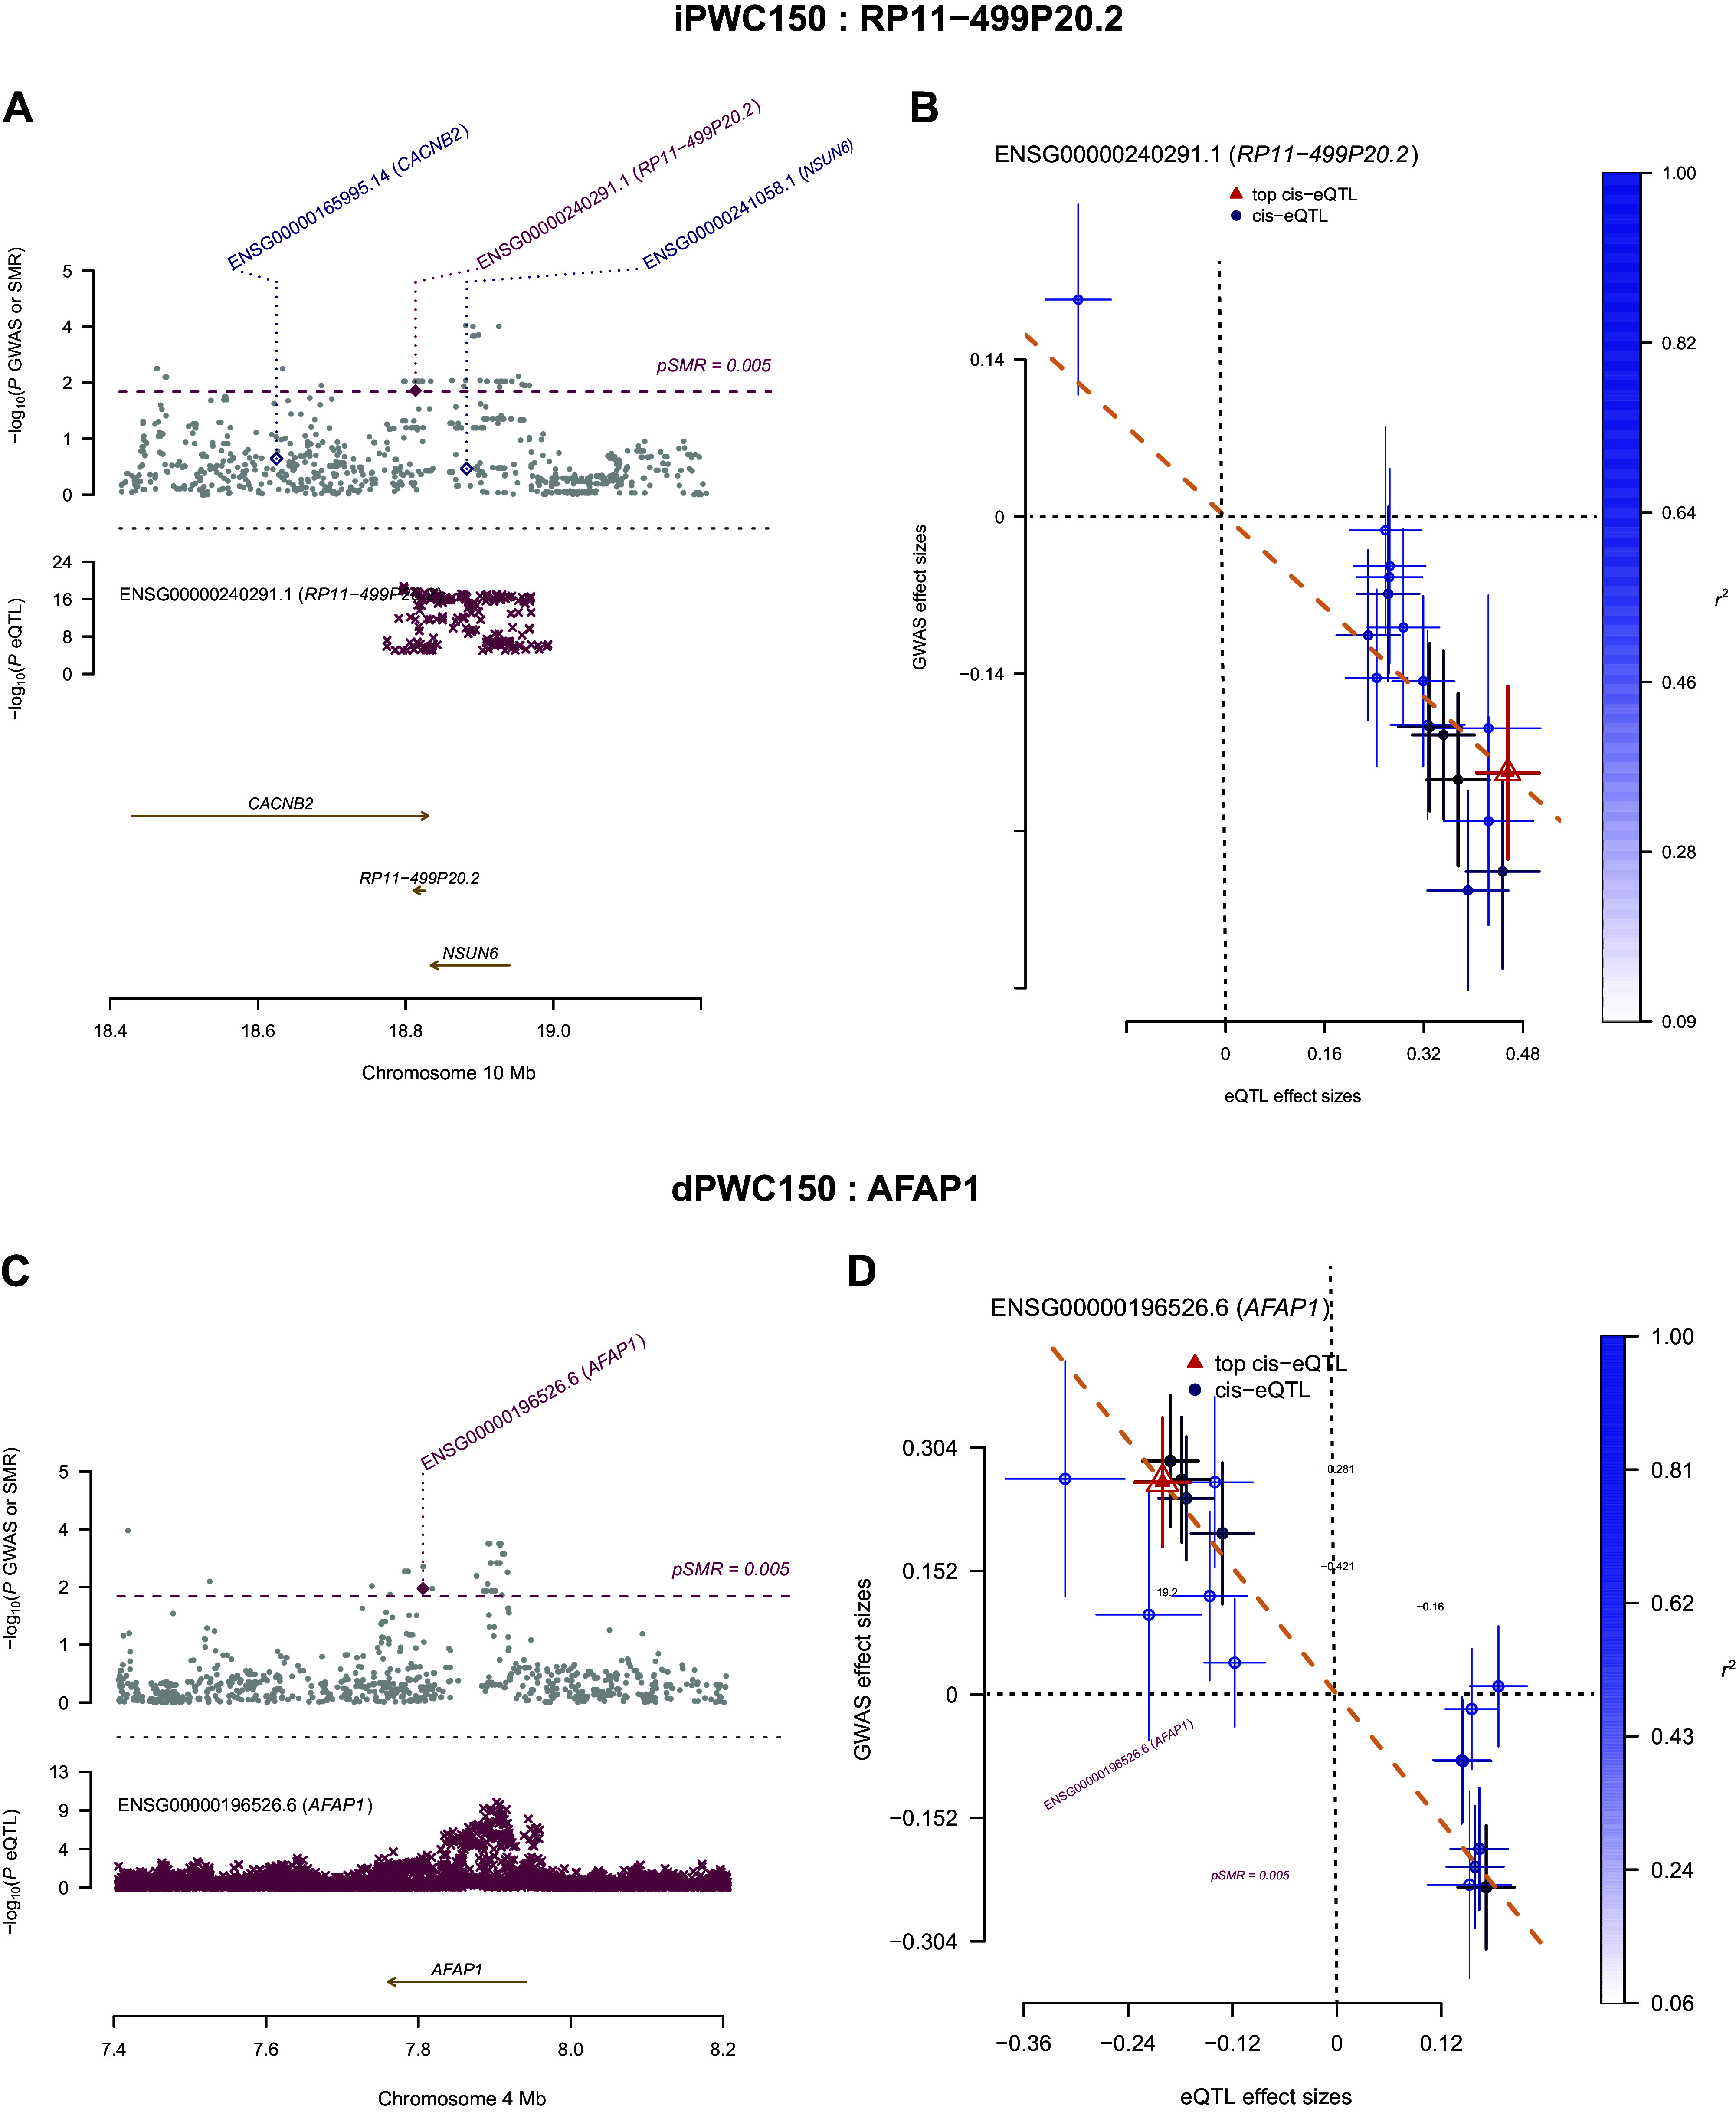
Summary data-based Mendelian randomization (SMR)-based expression quantitative trait loci (eQTL) analysis in skeletal muscle. A: SMR-based locus plot shown for RP11-499P20.2 lncRNA, as an example. Top: −log10(P values) of the single-nucleotide polymorphisms (SNPs) near the RP11-499P20.2 locus from the genome-wide association study (GWAS) analysis of intrinsic physical working capacity at a heart rate of 150 beats/min (iPWC150). Red and blue diamonds represent −log10(P values) from the SMR tests for associations of gene expression with iPWC150. Probes showing pleiotropy (not rejected by the HEIDI test) are indicated by solid diamonds. Bottom: plot showing –log10(P values) of the SNP association for gene expression probe ENSG00000185324.17 (tagging RP11-499P20.2) from the GTEx skeletal muscle eQTL database and the genomic features around the SMR significant SNP. B: comparison of effect sizes in GWAS and eQTL datasets for probe ENSG00000185324.17 (red triangle). eQTLs around the top cis-eQTLs were positively associated with increased expression of RP11-499P20.2 (x-axis) and inversely associated with iPWC150 levels (y-axis), suggesting that increased lncRNA expression may regulate one or more genes associated with iPWC150. The color bar to the right shows the level of correlation of eQTLs with the top cis-eQTL. C: SMR-based locus plot for the actin filament-associated protein 1 (AFAP1) gene. Plot elements are same as for the locus plot for RP11-499P20.2. D: comparison of effect sizes in GWAS and eQTL for the AFAP1 probe. AFAP1-associated cis-eQTLs were negatively associated with both skeletal muscle AFAP1 gene expression and delta intrinsic physical working capacity at a heart rate of 150 beats/min (dPWC150) levels. Plot elements are the same as for effect size comparisons with RP11-499P20.2-associated SNPs.
Based on the results from multiple analyses of the GWAS data, including gene-level association scores for iPWC150 or dPWC150, pathway enrichment analysis, gene-based eQTL analysis, and SMR analysis, we identified 213 candidate genes (130 and 83 genes from iPWC150 and dPWC150 analyses, respectively) for further querying in knockout mouse models and examination for genetic association with cardiovascular and muscle phenotypes (available in HERITAGE participants).
Analysis of Gene Expression in Skeletal Muscle Biopsies
Whole genome expression profiling data of vastus lateralis muscle biopsies from a subset of 44 genotyped participants was analyzed via linear models to identify genes that were transcriptionally correlated with iPWC150 or dPWC150 levels, after adjustments for age, sex, body mass index, and scan date. For dPWC150 analysis, an additional adjustment for iPWC150 levels was also made. Based on a regression P value of ≤0.05 and absolute t statistic of ≥2.0, 52 and 123 genes were significantly associated with iPWC150 and dPWC150 levels, respectively. No overlap was noted among the significant genes from the two phenotypes. Partial residual plots for selected significant genes associated with iPWC150 and dPWC150 are shown in Fig. 5, A and B. The full results of the linear modeling analysis for iPWC150 and dPWC150 data are provided in Supplemental Table S6.
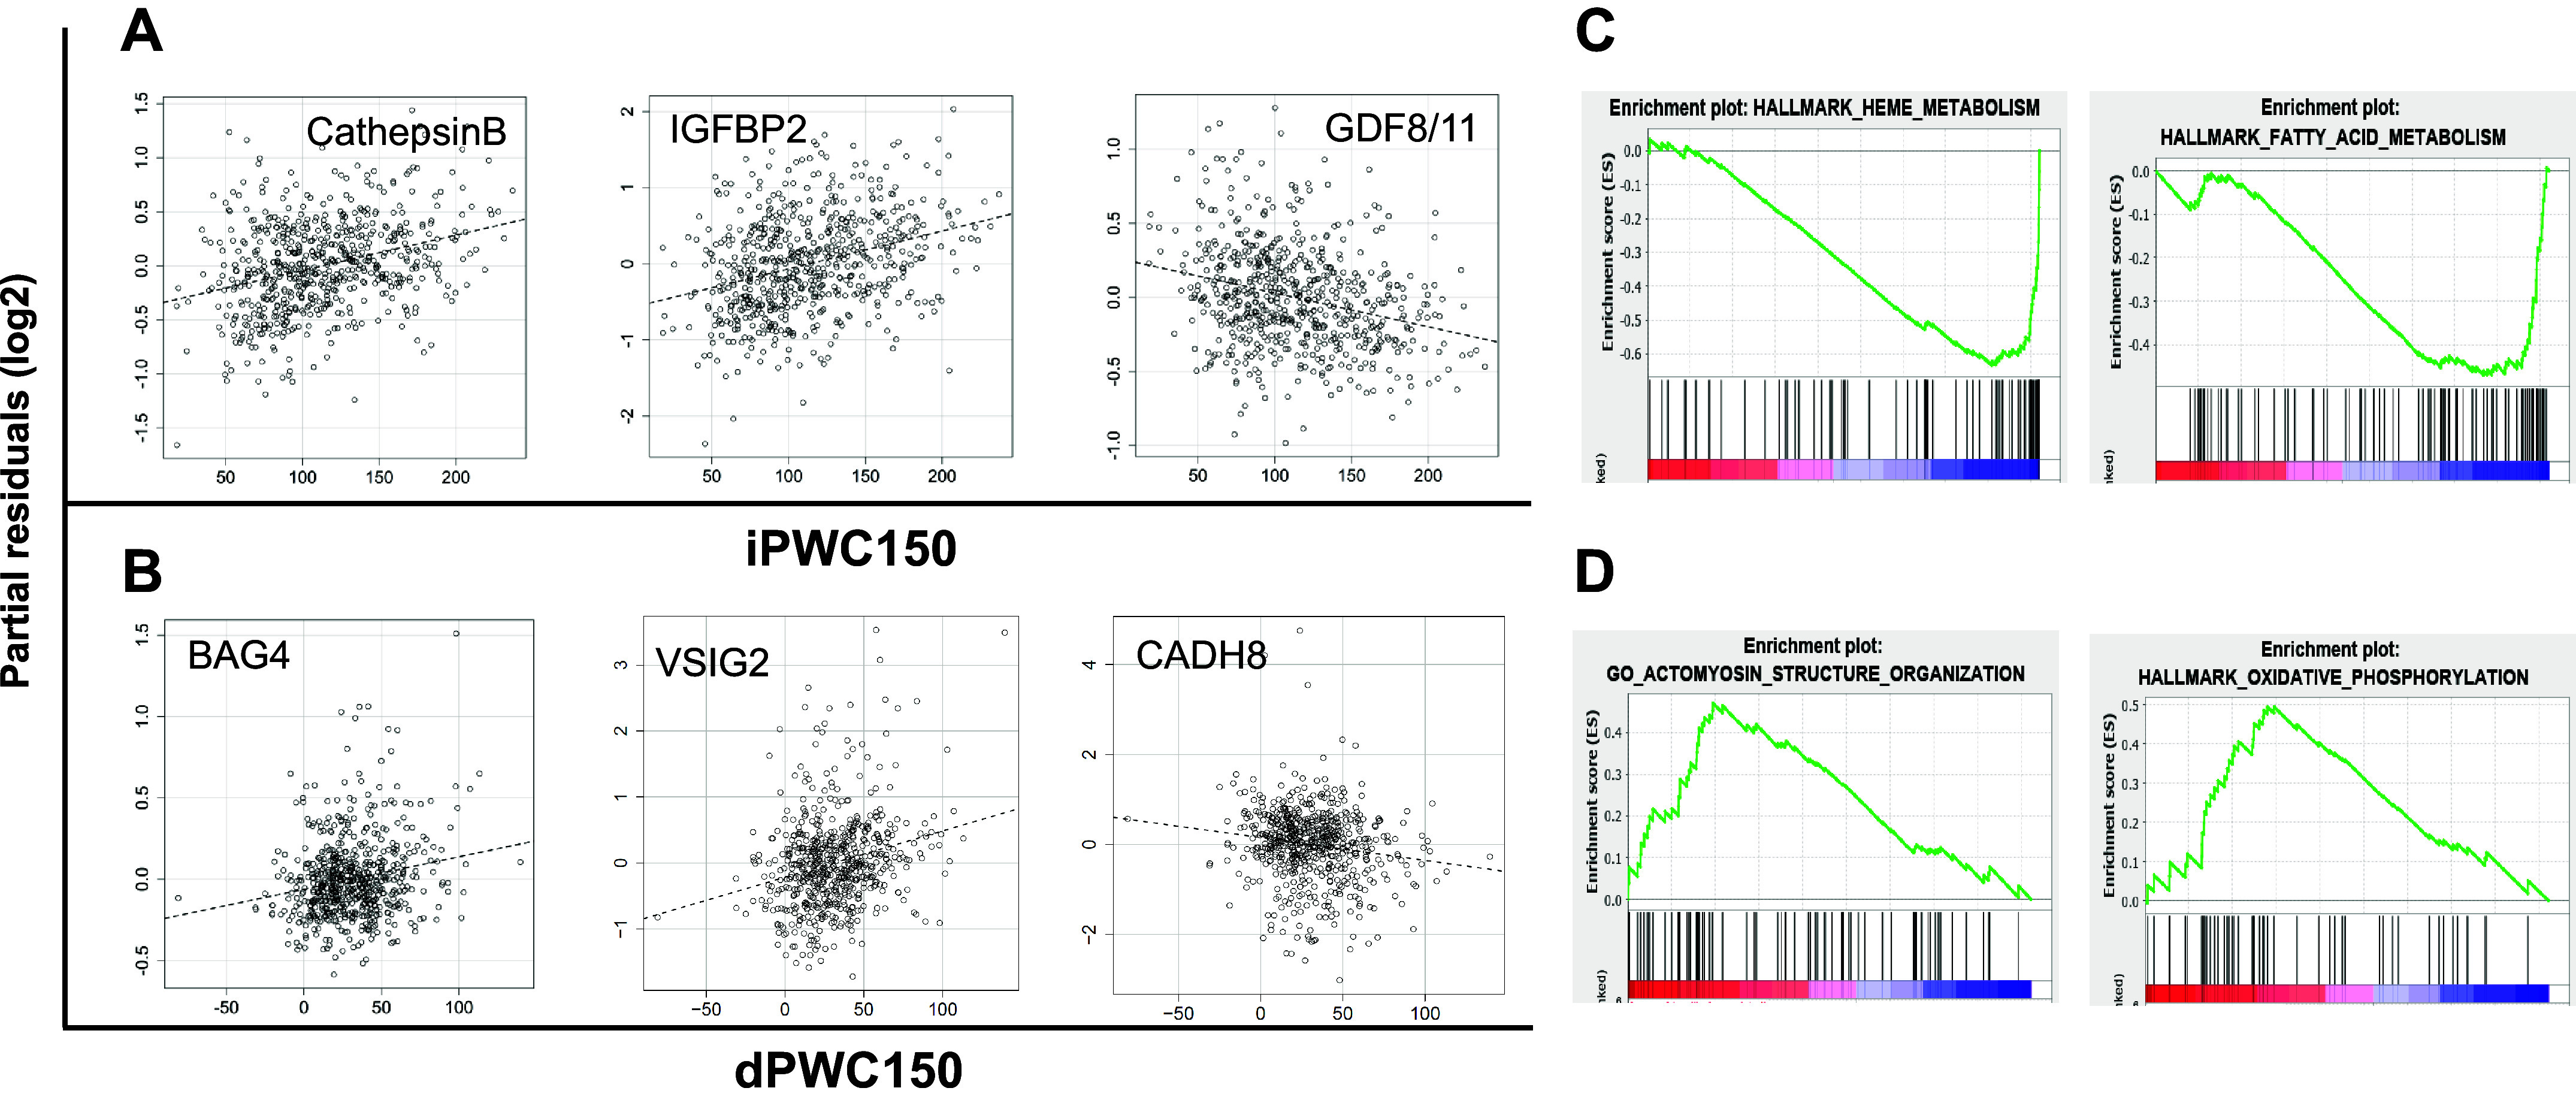
Figure 5.
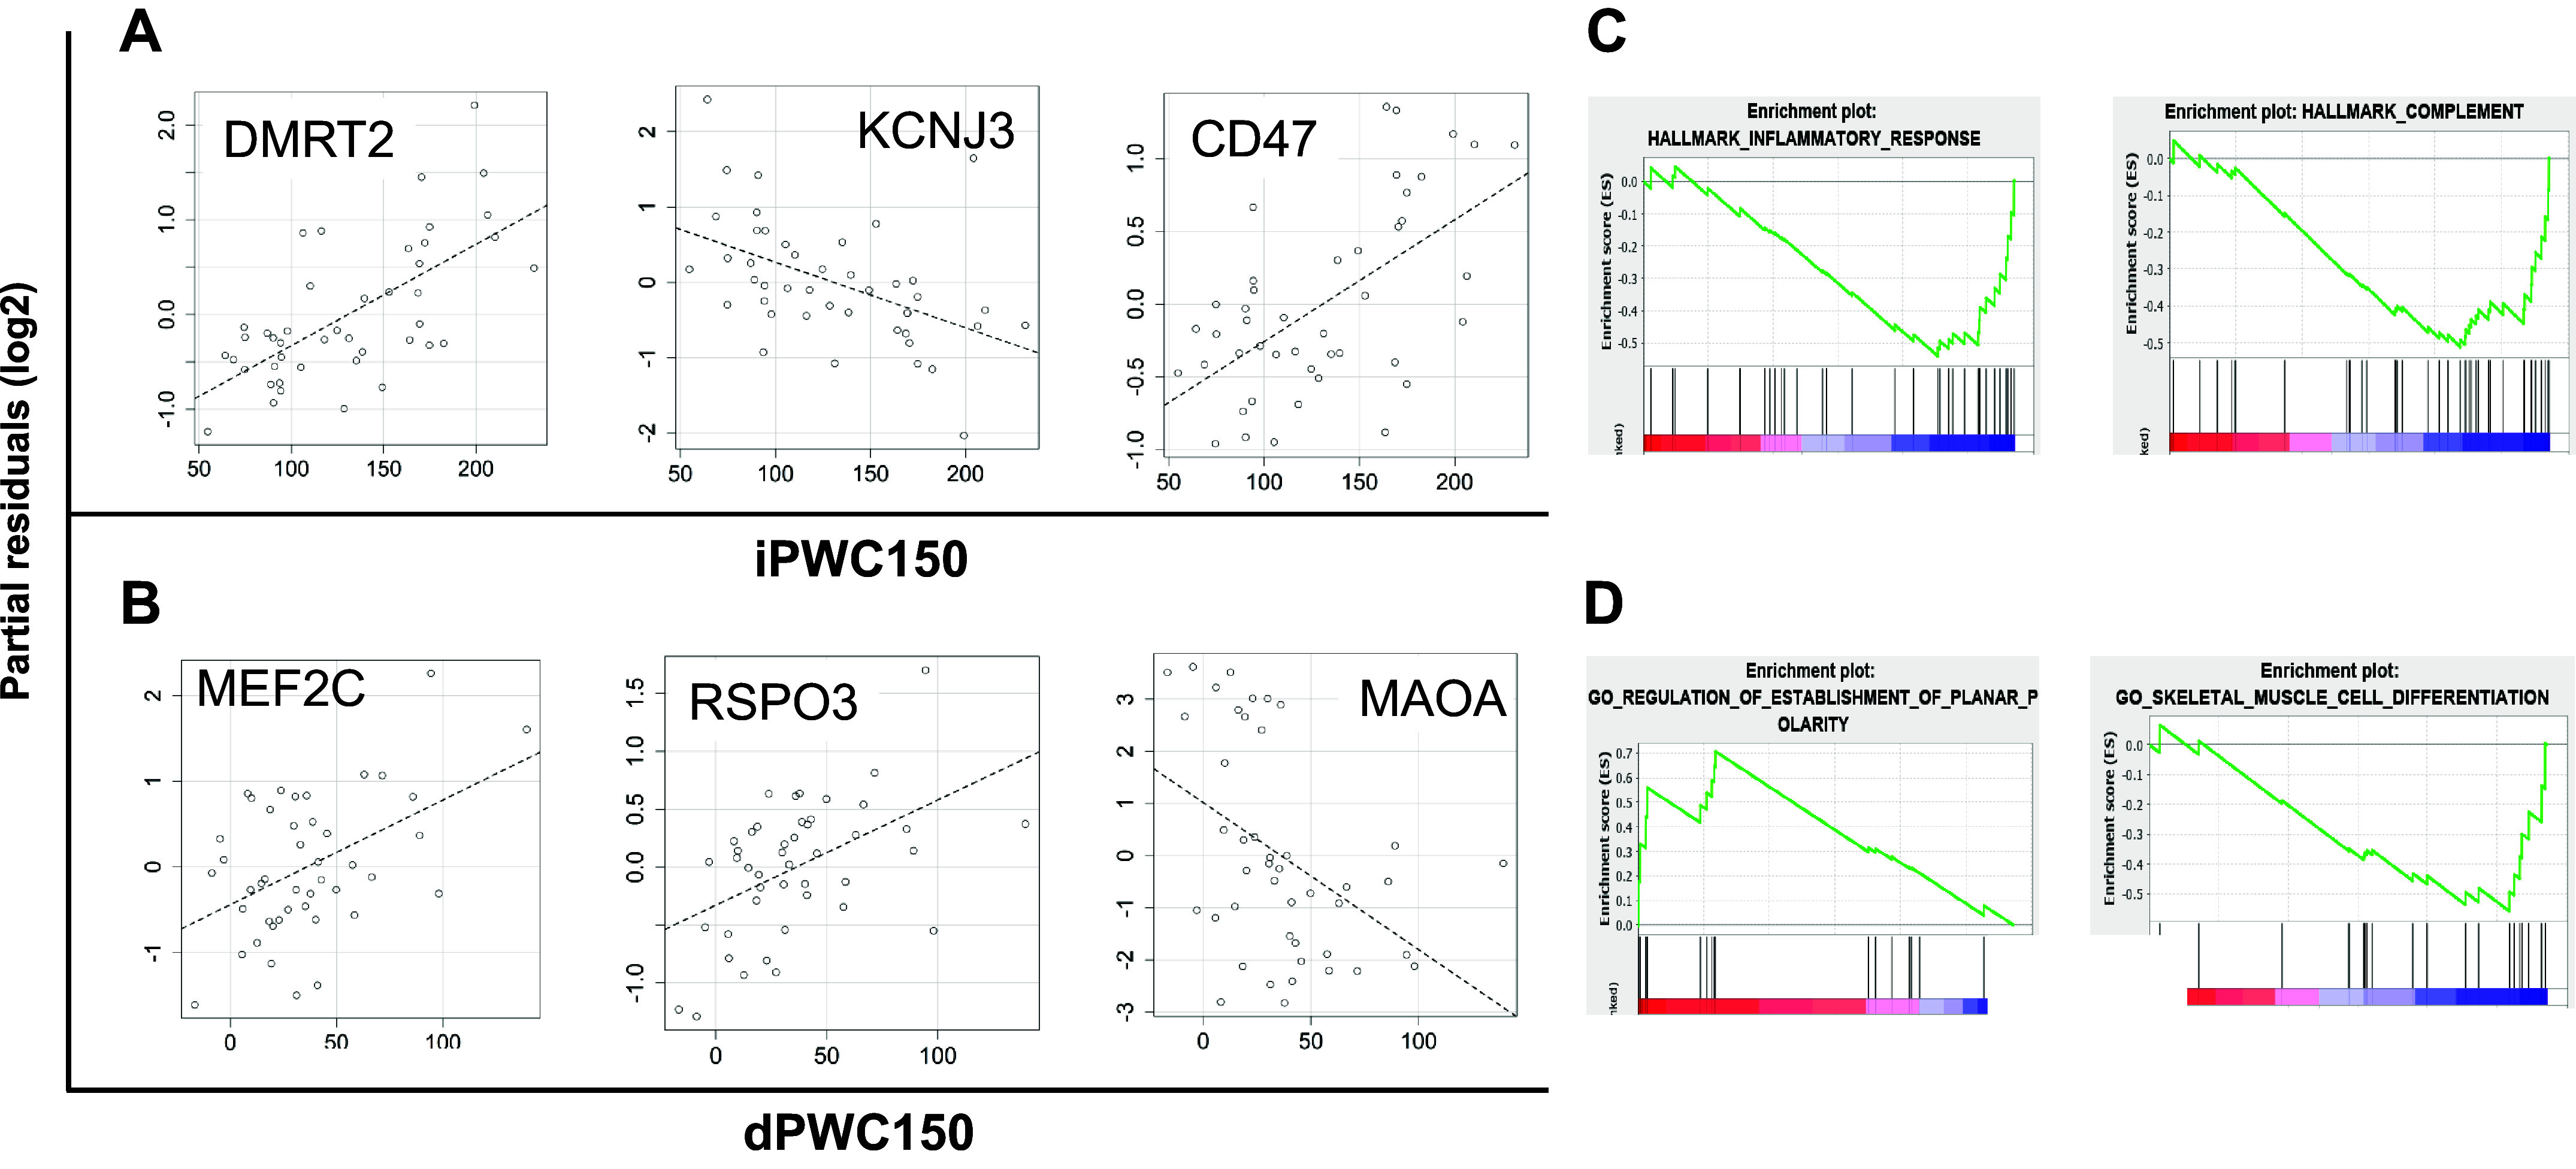
Transcriptomics analysis of intrinsic and delta physical working capacity at a heart rate of 150 beats/min (iPWC150 and dPWC150, respectively) associations. A: partial residual plots of log2 gene expression versus iPWC150 levels for selected significantly associated genes. The name of the gene is indicated at the top of each plot. iPWC150 values are plotted on the x-axis, and the partial residual scores are plotted on the y-axis. The dashed line represents the line of best fit from linear regression analysis. B: partial residual plots for selected genes significantly associated with dPWC150. Plots are constructed in exactly the same way as described for iPWC150. C and D: enrichment plots of selected pathways from Gene Set Enrichment Analysis of gene expression association with iPWC150 or dPWC150, respectively. Pathway names are listed at the top of each plot. The enrichment of upregulated or downregulated genes in a given pathway is shown in the enrichment plots (negative enrichment scores in the plot imply downregulation of gene expression with iPWC150 or dPWC150 levels, and vice versa).
Pathway Analysis: Transcriptomics
We next conducted pathway enrichment analysis by using the gene expression regression coefficients for iPWC150 or dPWC150 in the GSEA framework and by querying three independent pathway databases from MSigDB (KEGG, Hallmark, and GOBP). A total of 30 and 8 pathways were significantly enriched with genes associated with iPWC150 and dPWC150, respectively (FDR ≤ 0.1). Notably, pathways related to proinflammatory signaling (e.g., chemokine production and the inflammatory response), complement gene expression, and extracellular matrix-receptor interactions were downregulated in the iPWC150-associated genes. The skeletal muscle cell differentiation pathway was enriched in genes negatively associated with dPWC150, whereas increased dPWC150 was positively associated with the planar cell polarity pathway. Figure 5, C and D, shows the GSEA enrichment plots for some top-scoring pathways from iPWC150 and dPWC150 analysis. Full details of pathway analysis results are provided in Supplemental Table S7.
Analysis of Plasma Protein Levels
Plasma protein expression data from 408 genotyped participants were analyzed via linear models to identify proteins that were associated with adjusted iPWC150 or dPWC150 levels, after adjustments for age, sex, and body mass index. Based on a regression P value of ≤1 × 10⁻⁴ and absolute t statistic of ≥2.0, 29 and 36 proteins were significantly associated with baseline and dPWC150 levels, respectively. Of the 29 iPWC150-associated proteins, 19 were annotated as “secreted” in UniprotKB, whereas 9 of the 36 dPWC150-associated proteins were also secreted (Supplemental Fig. S1). Again, no overlap was noted among the significant proteins from the two phenotypes. Partial residual plots for selected significant proteins are shown in Fig. 6, A and B. Details of the linear modeling analysis for iPWC150 and dPWC150 data are provided in Supplemental Table S8.
Figure 6.
Proteomics analysis of intrinsic and delta physical working capacity at a heart rate of 150 beats/min (iPWC150 and dPWC150, respectively) associations. A: partial residual plots of log2 protein expression versus iPWC150 levels for selected significantly associated proteins. The name of the protein is indicated at the top of each plot. iPWC150 values are plotted on the x-axis, and partial residual scores are plotted on the y-axis. The dashed line represents the line of best fit from linear regression analysis. B: partial residual plots for selected proteins significantly associated with dPWC150. Plots are constructed in exactly the same way as described for iPWC150. C and D: enrichment plots of selected pathways from Gene Set Enrichment Analysis of protein expression association with iPWC150 or dPWC150, respectively. Pathway names are listed at the top of each plot. The enrichment of upregulated or downregulated genes in a given pathway is depicted in the enrichment plots.
Pathway Analysis: Proteomics
Pathway enrichment analysis of the proteomics data was conducted via GSEA using the protein expression regression coefficients for iPWC150 or dPWC150 as input. For GSEA, 18 and 235 pathways were identified at FDR < 0.1 from a combined analysis of KEGG, Hallmark, and GOBP pathways on iPWC150- and dPWC150-associated proteomics data, respectively. Four pathways overlapped between the iPWC150- and dPWC150-associated pathways. For iPWC150, strong downregulation was noted for fatty acid- and heme metabolism-related pathways, whereas pathways related to mTOR signaling, oxidative phosphorylation, and actinomyosin structure formation were upregulated among the dPWC150-associated pathways. GSEA enrichment plots for some top-scoring pathways from iPWC150 and dPWC150 analysis are shown in Fig. 6, C and D. Full details of pathway analysis results are provided in Supplemental Table S9.
Analysis of Plasma Metabolite Levels
Data for 187 targeted plasma metabolites in 408 subjects were analyzed via linear regression to identify metabolites associated with adjusted (age, sex, and body mass index) iPWC150 or dPWC150. A total of 25 and 49 metabolites were found to be nominally associated with baseline and dPWC150, respectively (P < 0.05, absolute t > 2), with two metabolites, acetylcholine and niacinamide, identified in both sets (Supplemental Table S10). Notably, three metabolites involved in ketone body metabolism (acetoacetate, 2-hydroxybutyrate, and 3-hydroxybutyrate) were all negatively associated with iPWC150 (Fig. 7A). For dPWC150, a strong positive association was observed for several purine nucleotides including AMP, ADP, and ATP as well as for aspartate, glutamate, and carnitine conjugates (Fig. 7B). The amino acid derivative carnitine and several medium- and long-chain fatty acyl-carnitines (C6-, C7-, and C16-acylcarnitines) were also positively associated with dPWC150. Although we did not carry out a general pathway enrichment analysis with metabolite data (due to the small number of metabolites tested), we mapped a subset of the dPWC150-associated metabolites onto two KEGG pathway diagrams to visualize the potential impact of such changes on pathway activity, as shown in Fig. 7C.
Figure 7.
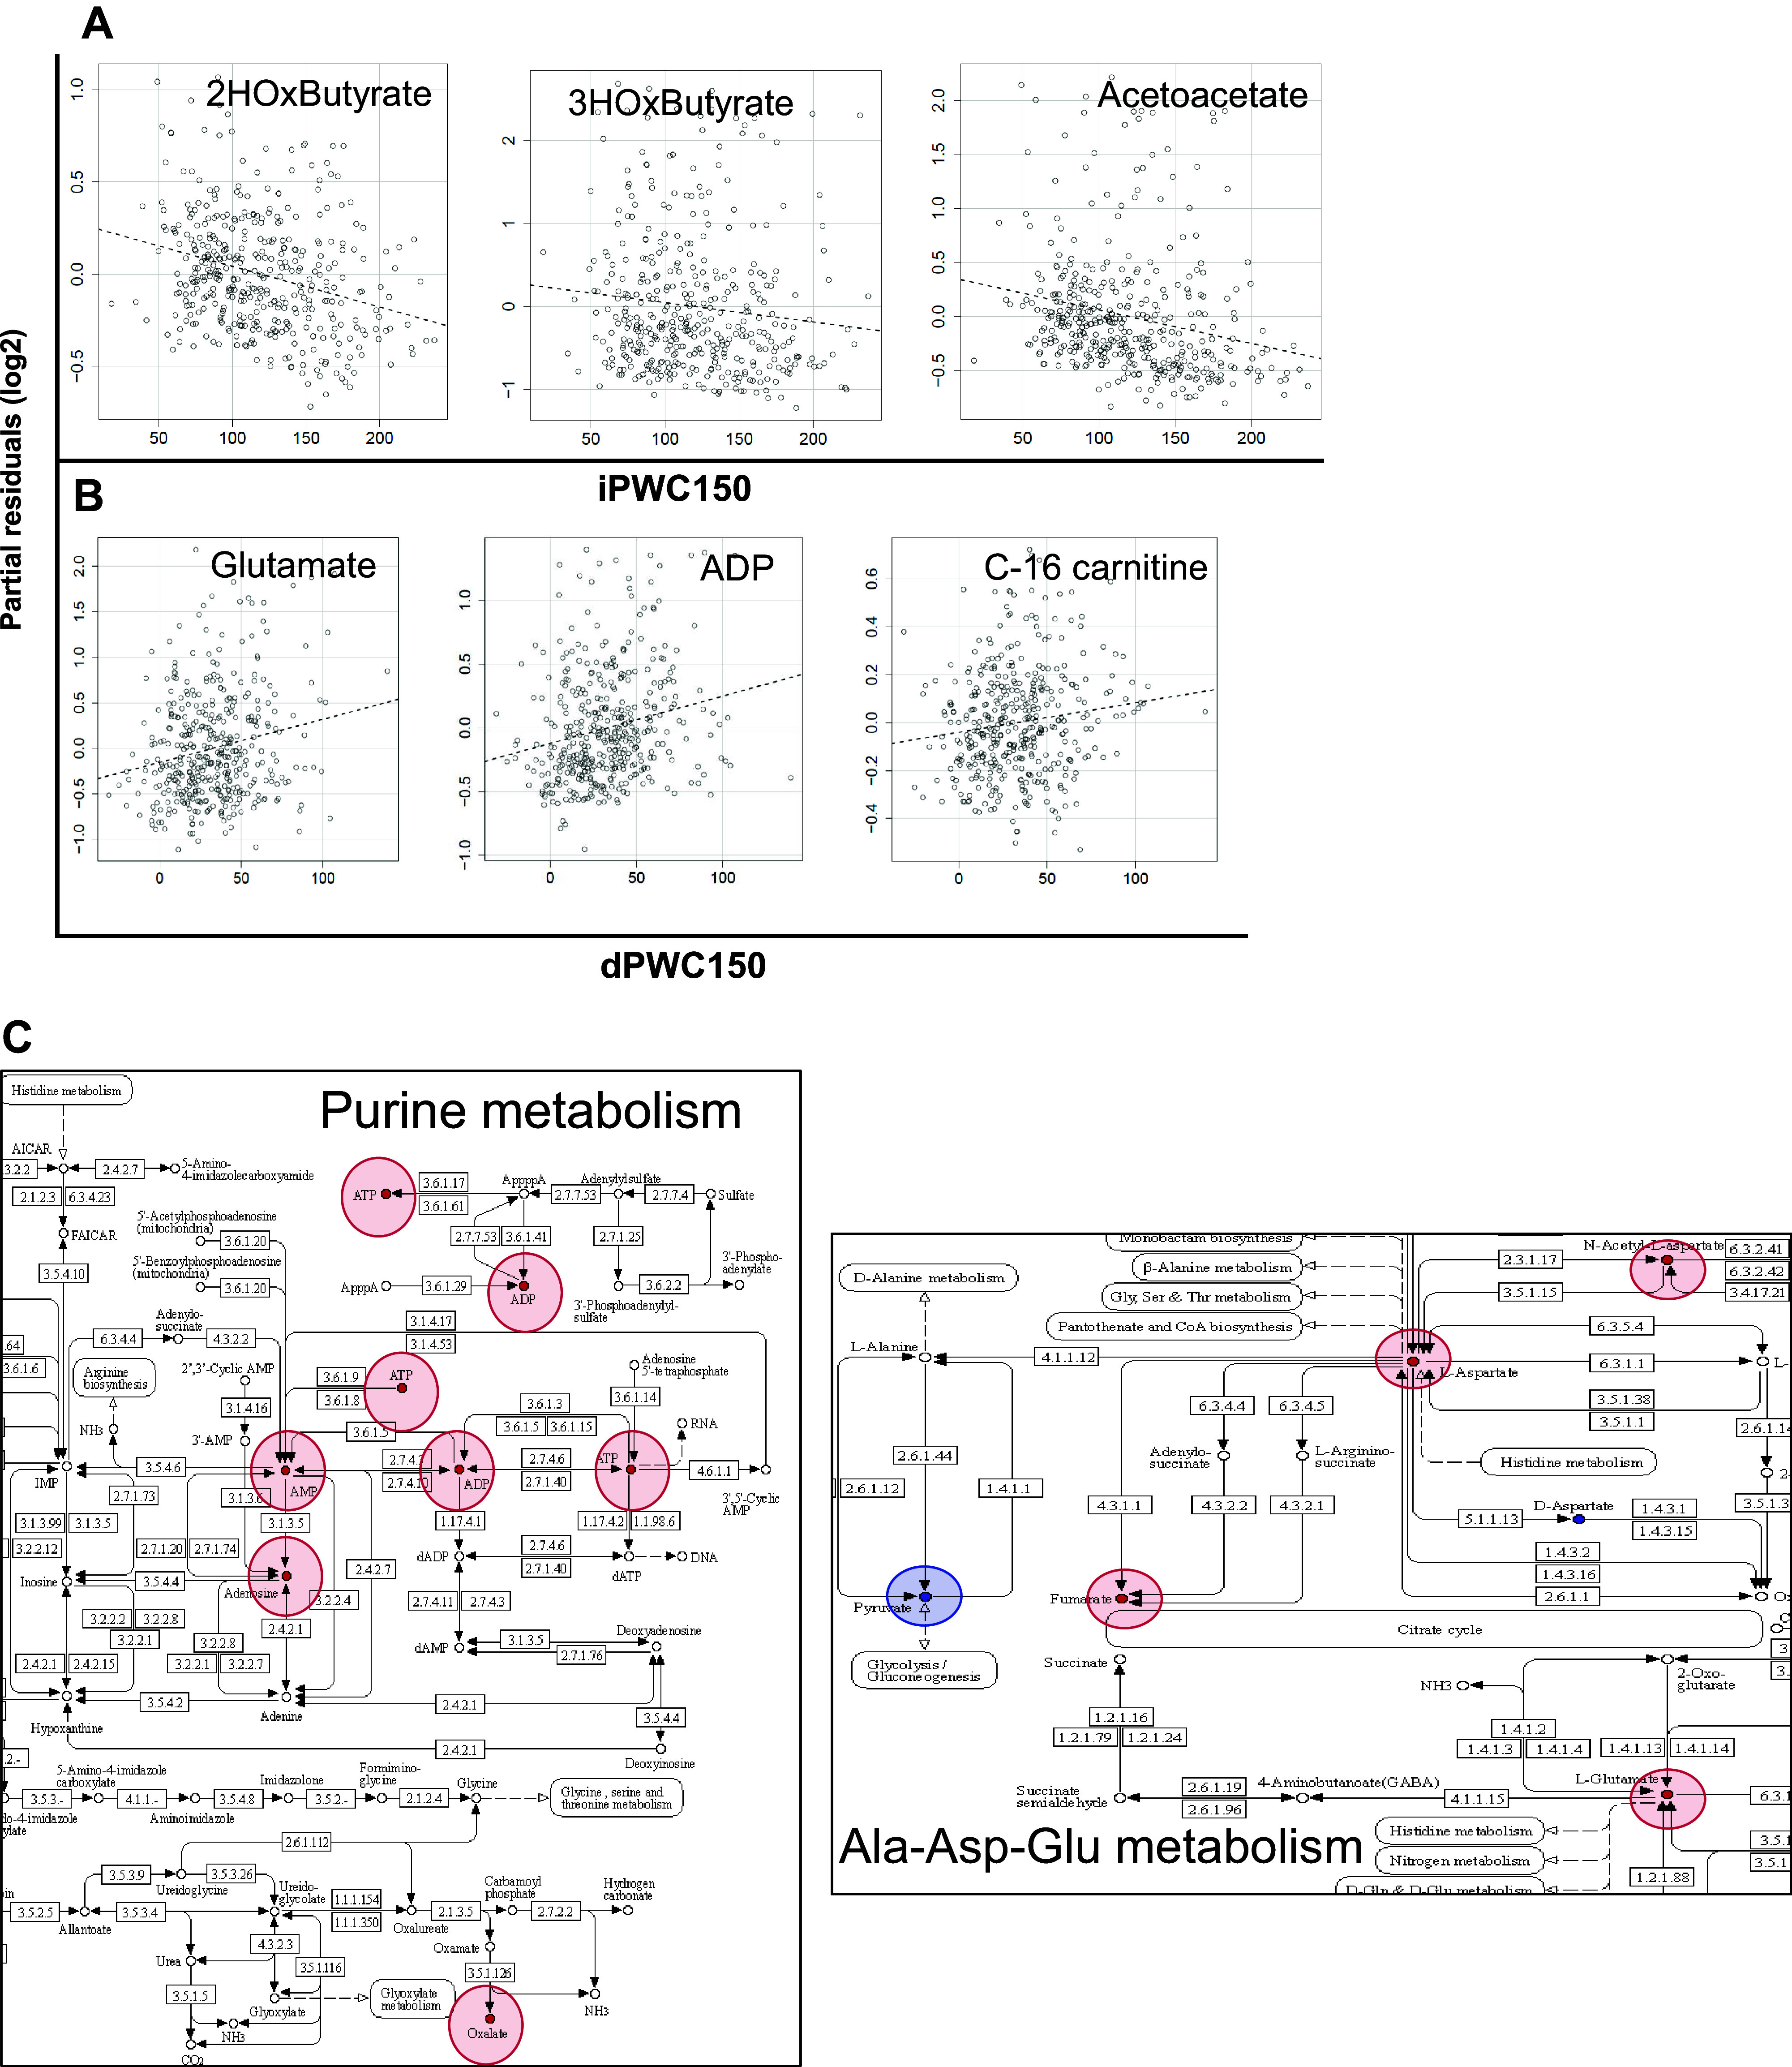
Metabolomics analysis of intrinsic and delta physical working capacity at a heart rate of 150 beats/min (iPWC150 and dPWC150, respectively) associations. A: partial residual plots of selected significantly associated metabolites to iPWC150. The name of the metabolite is indicated at the top of each plot. iPWC150 values are plotted on the x-axis, and partial residuals for relevant metabolites are shown on the y-axis. The dashed line represents the line of best fit from linear regression analysis. B: partial residual plots for selected metabolites significantly associated with dPWC150. Plots are constructed in exactly the same way as described for iPWC150. C: visualization of metabolites significantly associated to dPWC150 in selected Kyoto Encyclopedia of Genes and Genomes pathways. Positive associations are shown in red, and negative associations are shown in blue.
Analysis of Knockout Mouse Phenotypes
A total of 322 candidate genes were retained from the combined analyses of GWAS, transcriptomic, and proteomic data from iPWC150 and dPWC150 and queried for knockout mouse phenotypes from MGI. The numbers of dPWC150-associated genes were 85 from GWAS, 29 from transcriptomics, and 37 from proteomics analyses. From this list, knockout mouse phenotypes were available for 117 iPWC150-associated genes and 90 dPWC150-associated genes. The list of all genes selected from GWAS, genomics, and proteomics is provided in Supplemental Table S11. Notably, the myoglobin (MB) and ROCK2 genes were identified in both GWAS and proteomics analysis, whereas the myocyte enhancer factor 2 C (MEF2C) gene was identified in GWAS as well as transcriptomics analysis. The individual knockout phenotypes obtained from MGI for each gene were further aggregated into broader categories (“root phenotypes”) reflecting the organ systems affected (e.g., cardiovascular, muscle, nervous system, etc.) (Fig. 8A). The largest category (NA) consisted of genes for which no knockout mouse data are available, followed by organ systems such as the cardiovascular system, behavior/neurological system, or homeostasis/metabolism. From this list, we focused on a group of six root phenotypes including adipose, cardiovascular, hematopoietic, homeostasis/metabolism, immune, and muscle due to their greater potential relevance for submaximal indicators of cardiorespiratory fitness (Fig. 8B).
Figure 8.

Phenotypic consequences of candidate intrinsic and delta physical working capacity at a heart rate of 150 beats/min (iPWC150 and dPWC150, respectively) associated gene knockouts in the Mouse Genome Informatics (MGI) database. A: genes selected from genome-wide association study (GWAS), transcriptomics, and proteomics approaches were used to query the MGI database for phenotypes arising from targeted gene knockouts or gene trap models. The left and right graphs show results for dPWC150- and iPWC150-associated genes, respectively. The number of top-level phenotypes (root phenotypes) impacted are plotted. The root phenotype categories are indicated on the y-axis, and the total number of genes observed for each category are shown on the x-axis (genes without knockout mouse data are indicated as NA). B and C: heatmap depicting genes with ≥3 root phenotypes in the MGI database. B: iPWC150-associated genes. C: dPWC150-associated genes. Genes are listed in rows, and root phenotypes are listed in columns. The presence of a root phenotype in a gene knockout is indicated by shaded cells. The source of the genes is indicated next to the gene names in parentheses [GWAS (GW), transcriptomics (G), and proteomics (P)].
For both iPWC150- and dPWC150-selected genes, the largest number of root phenotypes were related to homeostasis/metabolism, followed by cardiovascular phenotypes. Among the iPWC150-selected genes, ADIPOQ, SIRT1, CD47, P2RY14, IL1R1, DLL4, MB, CACNB3, CLEC2B, MSTN, PLCG2, and CAMK1D affected four or more of the six root phenotypes. Similarly, the dPWC150-selected genes, ARNTL, PCSK1, TCF4, MEF2C, MB, TOM1L2, TWSG1, NFAT5, GALNT3, and SEMA4D also displayed knockout effects in four or more root phenotypes. For each selected root phenotype, we then investigated the individual phenotypes for the candidate genes of interest (Supplemental Figs. S2 and S3). For iPWC150-associated genes, many adipose tissue-related phenotypes were observed in myostatin (MSTN/GDF8) and type 1 interleukin 1 receptor (IL1R1) knockout mice. Neuropilin 1 (NRP1) and delta-like 4 homolog (DLL4) gene knockouts displayed the largest number of cardiovascular phenotypes. Hematopoietic phenotypes were dominated by caspase recruitment domain family member 11 (CARD11) and interleukin 2 receptor-β (IL2RB) genes, whereas knockout of adiponectin (ADIPOQ) showed the largest homeostasis/metabolism-related phenotypes. Immune phenotypes were most prominent in CARD11 knockout mice, and a significant number of muscle-specific effects were observed for knockouts in MSTN and MET proto-oncogene genes.
A similar analysis with dPWC150-associated gene candidates revealed the largest number of adipose phenotypes in patatin-like phospholipase domain-containing 2 gene (PNPLA2) knockouts, whereas the largest number of cardiovascular phenotypes was observed for knockout of the MEF2C gene. Hematopoietic phenotypes were observed in knockout of the DNA cross-link repair 1 C (DCLRE1C) gene, whereas arylhydrocarbon receptor nuclear translocator-like (ARNTL) and PNPLA2 gene knockouts displayed the largest number of homeostasis/metabolism phenotypes. The DNA ligase 4 (LIG4) gene knockout showed the greatest effects on immune-related phenotypes, whereas the desmin (DES) gene knockout was associated with the greatest number of muscle-specific phenotypes.
SNP-Trait Associations With Cardiovascular and Muscle-Specific Phenotypes
In addition to phenotype queries in knockout mouse models, we also examined whether SNPs mapping to the query genes showed evidence of association with resting and exercise-related cardiovascular and muscle-specific traits measured in HERITAGE participants. In addition, eQTL SNPs of interest identified from Eugene and SMR analysis were also included. A total of 29 cardiovascular and muscle traits were examined for the SNP association analyses. The analysis identified 1,963 SNPs mapping to 161 iPWC150-associated genes that were nominally associated (P < 0.01) with at least one of the cardiovascular and muscle traits examined. Similarly, 937 SNPs mapping to 131 dPWC150-associated genes were nominally associated with one or more examined traits. Figure 9, A and B, shows the trait-association results for a selection of the genes associated with five or more traits. From the iPWC150-associated genes, PLCG2, CAMK1D, RNF165, DLG2, PDE4D, and SHISA6 displayed significant associations with ≥10 cardiovascular traits, whereas CAMK1D, DLG2, PDE4D, DMRT2, UNC5C, SMOC1, and EPHA7 displayed significant associations with ≥10 muscle traits. For dPWC150, genes such as MEF2C, MRPS17, LIG4, UNC13C, GUCY1A3, RPS14P3, CSMD2, MCTP2, CTD-2324F15.2, and ZBTB20 showed associations with ≥5 cardiovascular traits, whereas LIG4, CSMD2, MCTP2, MB, UNC13C, and CTD-2324F15.2 also showed significant associations with ≥7 muscle traits. The list of the 29 examined traits and the significant SNP association results are provided in Supplemental Table S12.
Figure 9.
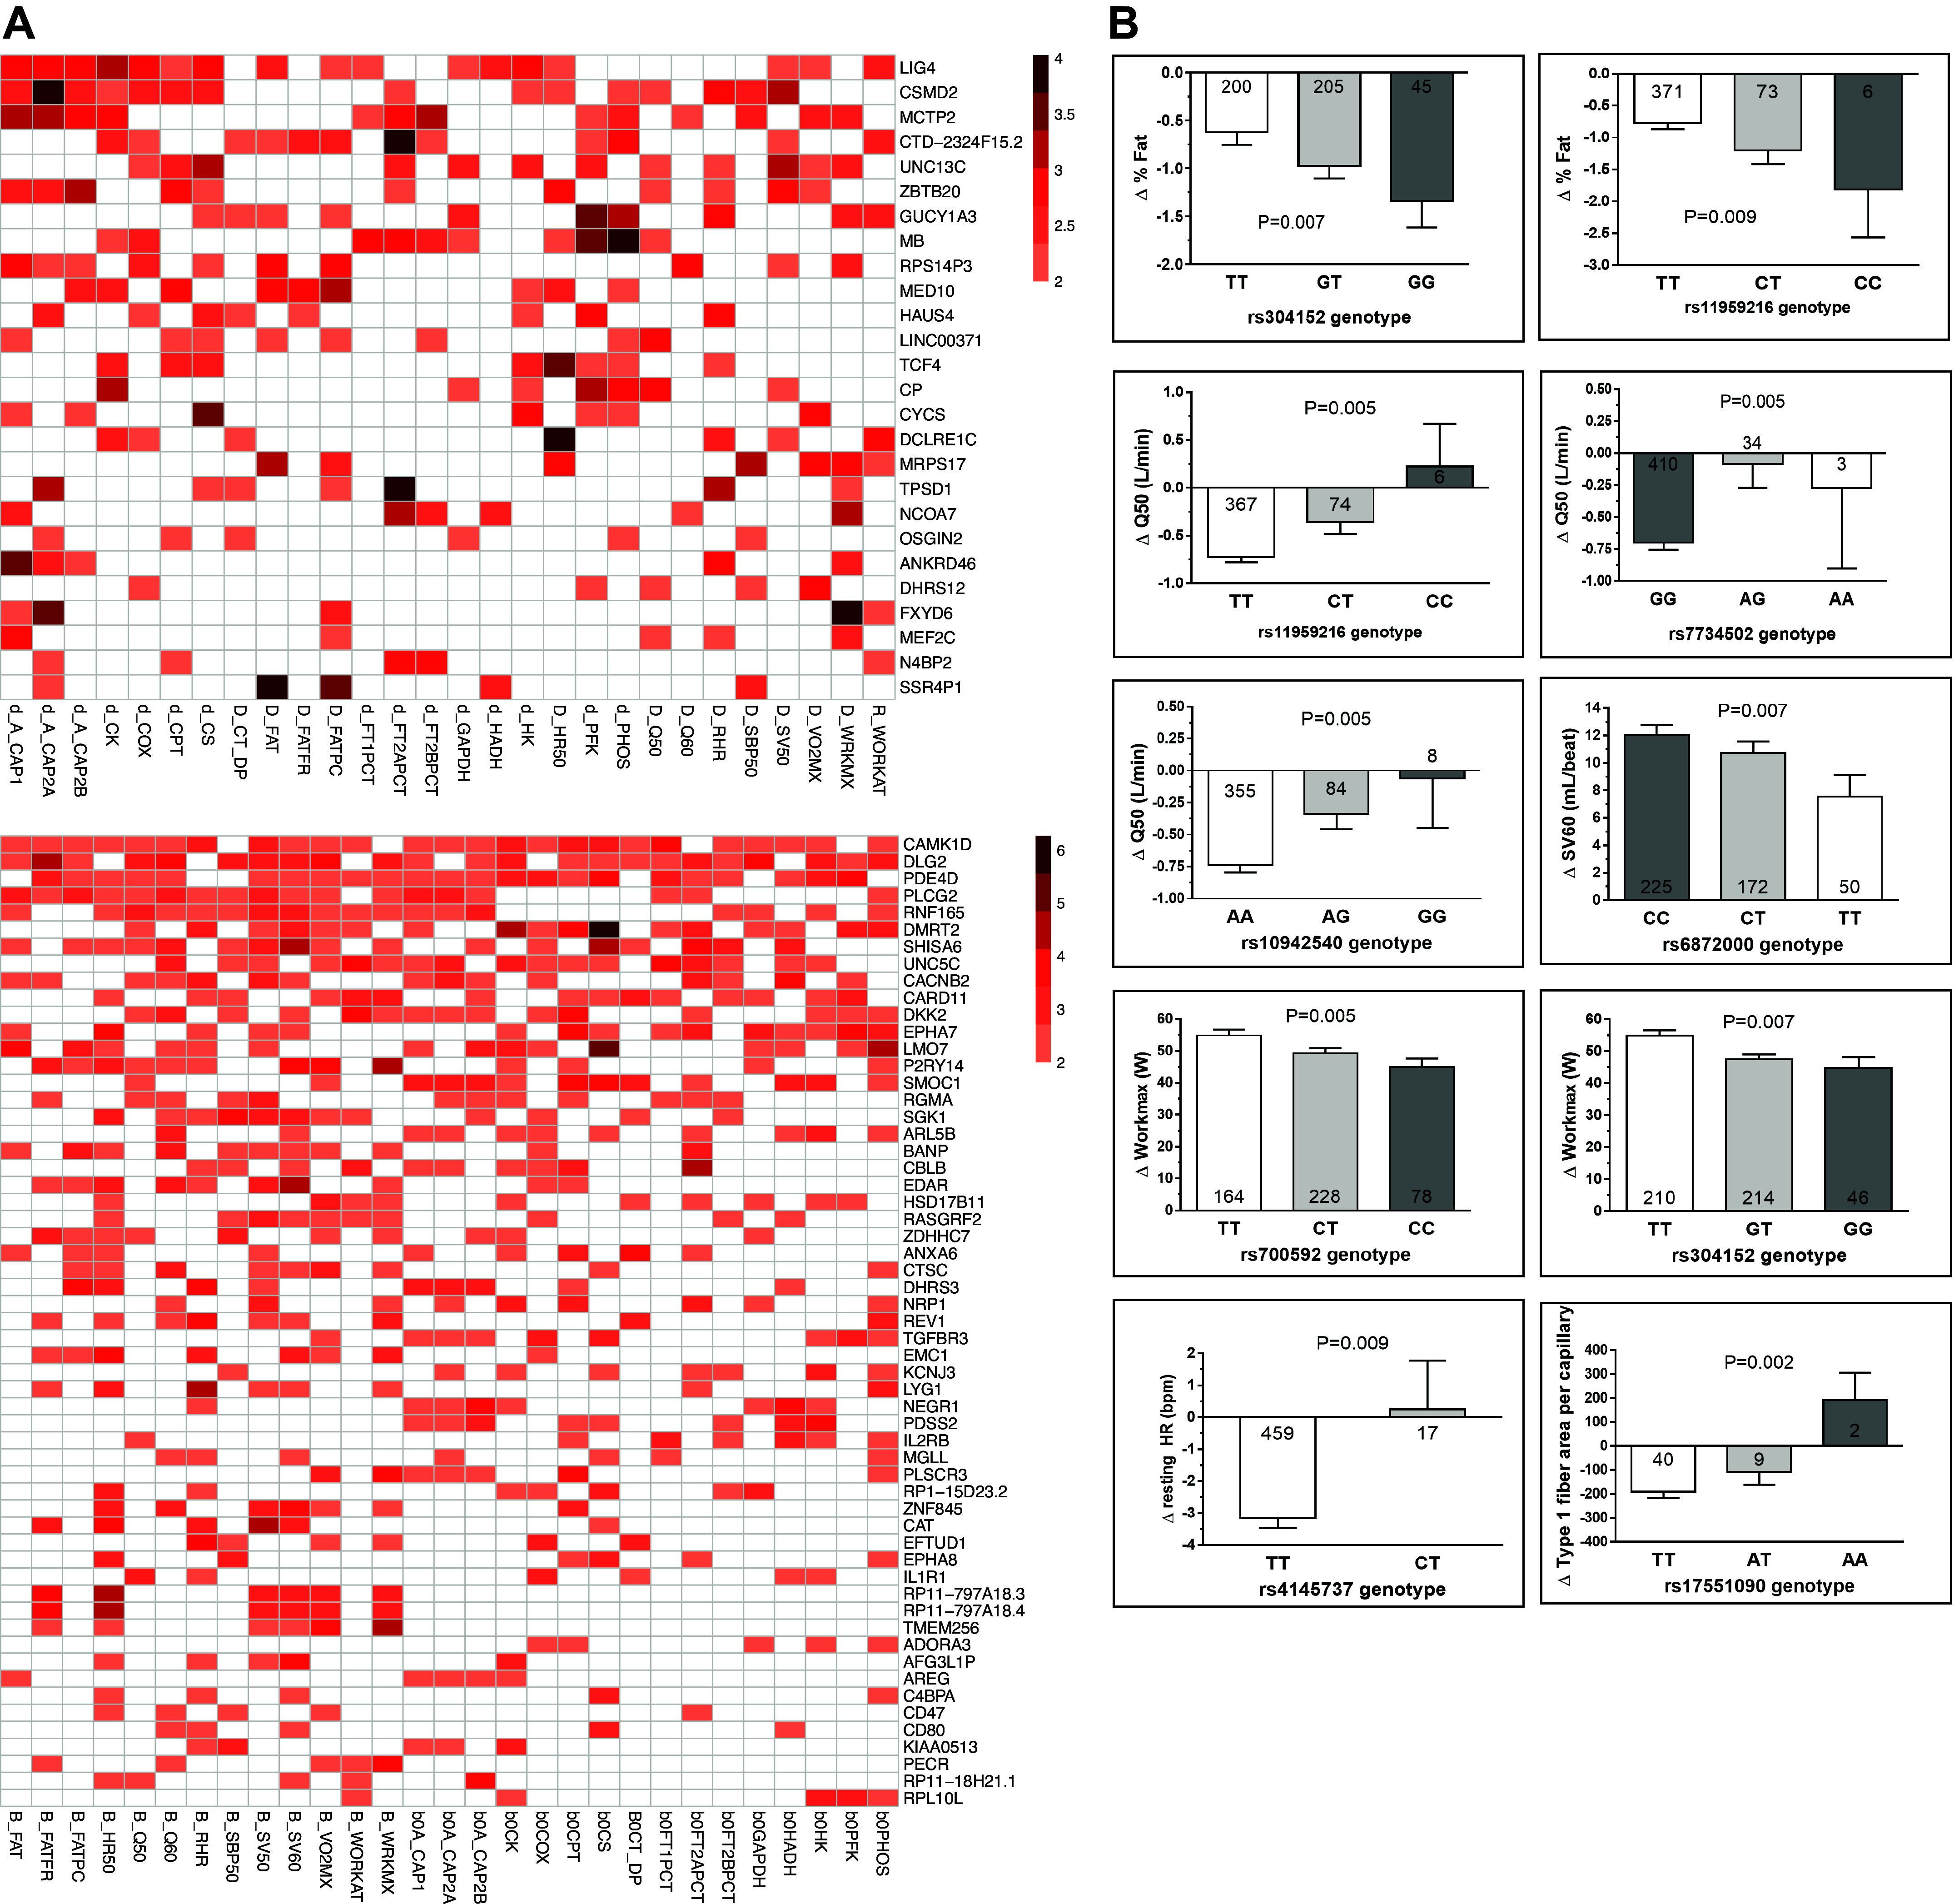
Single-nucleotide polymorphism (SNP)-trait association analysis for cardiovascular and muscle traits. A: heatmap of gene-trait associations. Genes are shown in rows, and traits are shown in columns. Heatmaps are color coded by the maximum of the negative log P values obtained for SNP-trait associations for all SNPs mapping to a gene (P < 0.01). For multiple significant SNPs mapping to a gene, the lowest SNP-trait association P value is used to represent the gene association P value. Only genes with association to ≥5 traits (out of 29 traits) are shown in the heatmap. Left: intrinsic physical working capacity at a heart rate of 150 beats/min (iPWC150); right: delta physical working capacity at a heart rate of 150 beats/min (dPWC150). B: an example of SNP-trait association for multiple SNPs in the myocyte enhancer factor 2 C (MEF2C) gene. SNP genotypes are plotted on the x-axis and average trait values (±SE) are shown on the y-axis in each plot.
Prioritization of Candidate Genes
We took advantage of knockout mouse phenotypes and human SNP-trait association analyses to prioritize a panel of candidate genes. The goal was to use phenotypic corroboration as a tool to identify genes that may be causally associated with iPWC150 or dPWC150, instead of relying solely on the statistical associations observed in the genomics, transcriptomics, or proteomics analyses. However, as knockout mouse phenotype data were not available for all candidate genes, we used two different approaches to gene prioritization. In the first case (phenotype-focused prioritization), genes showing evidence for effects in both knockout mouse phenotypes and human cardiovascular and muscle-specific phenotypes were selected, based on the extent of the phenotypes affected. In the second case (eQTL-focused prioritization), genes that were significant eQTLs in skeletal muscle and displayed significant muscle SNP-trait associations were selected. For phenotype-focused prioritization, we retained candidate genes with greater than or equal to five significant (P < 0.01) SNP-trait associations and greater than or equal to three knockout mouse root phenotypes. This resulted in 13 candidate genes for iPWC150 associations (CAMK1D, PLCG2, CARD11, P2RY14, EDAR, HSD17B11, TGFBR3, NEGR1, IL1R1, CAT, CD47, ADORA3, and AREG) and 6 candidate genes for dPWC150 associations (MB, TCF4, CP, CYCS, DCLRE1C, and MEF2C). For eQTL-focused prioritization, candidate genes with a significant muscle eQTL association (P ≤ 0.01) and greater than or equal to five significant (P < 0.01) SNP-trait associations were retained, resulting in two candidate genes for iPWC150 (ENTPD1-AS1 and RP13-467H17.1) and five candidate genes for dPWC150 [HAUS4, TPSD1, AFAP1, N4BP2, and CCN4(WISP1)]. The list of the prioritized candidate genes is shown in Table 4, along with a brief description of gene function. The combined results from the knockout mouse phenotype experiments and SNP-trait association experiments for all candidate genes are provided in Supplemental Table S13.
Table 4.
Prioritization of candidate genes based on “phenotype-focused” or “eQTL-focused” gene selection
| Gene | Transcriptomics (P < 0.05, Abs. β >=0.008) | Proteomics | GWAS_Genescore (P < 0.01) | GWAS_Common_Pathway | eQTL_Eugene_WB | eQTL_Eugene_SAT/VAT | eQTL_Eugene_Muscle | eQTL_SMR_WB | eQTL_SMR_SAT/VAT | eQTL_SMR_Muscle | KO_Mouse_Adipose Phenotypes | KO_Mouse_Cardiovascular Phenotypes | KO_Mouse_Hematopoietic Phenotypes | KO_Mouse_Homeostasis/Metabolism Phenotypes | KO_Mouse_Immune Phenotypes | KO_Mouse_Muscle | Total_Count_KO_Mouse_Phenotypes | SNP_CVtraits_Association | SNP_Muscletraits_Association | Total_Count_SNP_Trait_Association | Biological Function | Trait | Basis of selection |
|---|---|---|---|---|---|---|---|---|---|---|---|---|---|---|---|---|---|---|---|---|---|---|---|
| ADORA3 | 0 | 0 | 1 | 1 | 0 | 0 | 0 | 0 | 0 | 0 | 0 | 1 | 0 | 1 | 1 | 0 | 3 | 0 | 5 | 5 | Receptor for adenosine, has cardioprotective function during cardiac ischemia | iPWC150 | Phenotype |
| AREG | 0 | 0 | 1 | 1 | 0 | 0 | 0 | 0 | 0 | 0 | 0 | 0 | 1 | 1 | 1 | 0 | 3 | 1 | 4 | 5 | Ligand of the EGF receptor/EGFR. Autocrine growth factor as well as a mitogen for a broad range of target cells | iPWC150 | Phenotype |
| CAMK1D | 0 | 0 | 0 | 1 | 0 | 0 | 0 | 0 | 0 | 0 | 0 | 1 | 1 | 1 | 1 | 0 | 4 | 11 | 14 | 25 | Regulates calcium-mediated granulocyte function and basal dendritic growth of hippocampal neurons | iPWC150 | Phenotype |
| CARD11 | 0 | 0 | 0 | 0 | 0 | 0 | 0 | 1 | 0 | 0 | 0 | 0 | 1 | 1 | 1 | 0 | 3 | 6 | 9 | 15 | Involved in the costimulatory signal essential for T-cell receptor (TCR)-mediated T-cell activation | iPWC150 | Phenotype |
| CAT | 0 | 0 | 0 | 1 | 0 | 0 | 0 | 0 | 0 | 0 | 0 | 1 | 0 | 1 | 0 | 1 | 3 | 5 | 1 | 6 | Key antioxidant enzyme, protects cells from the toxic effects of hydrogen peroxide. | iPWC150 | Phenotype |
| CD47 | 1 | 0 | 0 | 0 | 0 | 0 | 0 | 0 | 0 | 0 | 0 | 1 | 1 | 1 | 1 | 1 | 5 | 4 | 1 | 5 | Role in cell adhesion and as a “marker of self” on red blood cells to prevent their elimination by macrophages | iPWC150 | Phenotype |
| EDAR | 0 | 0 | 0 | 1 | 0 | 0 | 0 | 0 | 0 | 0 | 1 | 1 | 1 | 0 | 0 | 0 | 3 | 8 | 2 | 10 | Member of the tumor necrosis factor receptor family, mediates the activation of NF-κ-B and JNK | iPWC150 | Phenotype |
| ENTPD1-AS1 | 0 | 0 | 0 | 0 | 0 | 0 | 0 | 0 | 0 | 1 | 0 | 0 | 0 | 0 | 0 | 0 | 0 | 3 | 4 | 7 | lncRNA class, antisense to ENTPD1 | iPWC150 | eQTL |
| HSD17B11 | 0 | 0 | 0 | 1 | 0 | 0 | 0 | 0 | 0 | 0 | 0 | 0 | 1 | 1 | 1 | 0 | 3 | 4 | 6 | 10 | May participate in androgen metabolism during steroidogenesis | iPWC150 | Phenotype |
| IL1R1 | 0 | 1 | 0 | 0 | 0 | 0 | 0 | 0 | 0 | 0 | 1 | 1 | 1 | 1 | 1 | 0 | 5 | 2 | 4 | 6 | Receptor for IL1A, IL1B and IL1RN mediating activation of NF-κ-B, MAPK and other pathways | iPWC150 | Phenotype |
| NEGR1 | 0 | 1 | 0 | 0 | 0 | 0 | 0 | 0 | 0 | 0 | 0 | 1 | 1 | 1 | 0 | 0 | 3 | 1 | 7 | 8 | May be involved in cell adhesion and regenerative axon sprouting in the mammalian brain | iPWC150 | Phenotype |
| P2RY14 | 0 | 0 | 0 | 1 | 0 | 0 | 0 | 0 | 0 | 0 | 0 | 1 | 1 | 1 | 1 | 1 | 5 | 9 | 4 | 13 | Receptor for UDP-glucose, may play a role in immune processes | iPWC150 | Phenotype |
| PLCG2 | 0 | 0 | 1 | 1 | 1 | 0 | 0 | 1 | 0 | 0 | 0 | 1 | 1 | 1 | 1 | 0 | 4 | 12 | 6 | 18 | Involved in inositol phosphate signaling using calcium as a cofactor | iPWC150 | Phenotype |
| RP13-467H17.1 | 0 | 0 | 0 | 0 | 0 | 0 | 0 | 0 | 1 | 1 | 0 | 0 | 0 | 0 | 0 | 0 | 0 | 0 | 1 | 1 | iPWC150 | eQTL | |
| TGFBR3 | 0 | 1 | 0 | 0 | 0 | 0 | 0 | 0 | 0 | 0 | 0 | 1 | 1 | 0 | 0 | 1 | 3 | 1 | 8 | 9 | Co-receptor with other TGF-β receptor superfamily members; soluble form may inhibit TFGB signaling | iPWC150 | Phenotype |
| AFAP1 | 0 | 0 | 1 | 0 | 0 | 0 | 0 | 0 | 0 | 1 | 0 | 0 | 0 | 0 | 0 | 0 | 0 | 6 | 3 | 9 | Modulator of actin filament integrity, links Src family members and protein kinase C to actin cytoskeleton | dPWC150 | eQTL |
| CCN4 (WISP1) | 0 | 0 | 0 | 0 | 0 | 0 | 0 | 0 | 0 | 1 | 0 | 0 | 0 | 0 | 0 | 0 | 0 | 7 | 2 | 9 | Downstream regulator in Wnt/Frizzled signaling pathway, associated with cell survival, binds to ECM proteoglycans such as decorin and biglycan | dPWC150 | eQTL |
| CP | 0 | 1 | 0 | 0 | 0 | 0 | 0 | 0 | 0 | 0 | 1 | 0 | 1 | 1 | 0 | 0 | 3 | 2 | 5 | 7 | Involved in iron transport across the cell membrane. | dPWC150 | Phenotype |
| CYCS | 1 | 0 | 0 | 0 | 0 | 0 | 0 | 0 | 0 | 0 | 0 | 1 | 1 | 0 | 1 | 0 | 3 | 1 | 6 | 7 | Central component of the electron transport chain in mitochondria | dPWC150 | Phenotype |
| DCLRE1C | 0 | 0 | 1 | 1 | 0 | 0 | 0 | 0 | 0 | 0 | 0 | 1 | 1 | 0 | 1 | 0 | 3 | 5 | 2 | 7 | Required for V(D)J recombination | dPWC150 | Phenotype |
| HAUS4 | 0 | 0 | 0 | 0 | 0 | 1 | 1 | 0 | 1 | 1 | 0 | 0 | 0 | 0 | 0 | 0 | 0 | 3 | 5 | 8 | Part of augmin complex, maintenance of centrosome integrity during cell division | dPWC150 | eQTL |
| MB | 0 | 1 | 1 | 1 | 0 | 0 | 0 | 0 | 0 | 0 | 0 | 1 | 1 | 1 | 0 | 1 | 4 | 2 | 8 | 10 | Serves as a reserve supply of oxygen and facilitates the movement of oxygen within muscles | dPWC150 | Phenotype |
| MEF2C | 1 | 0 | 1 | 0 | 0 | 0 | 0 | 0 | 0 | 0 | 0 | 1 | 1 | 1 | 0 | 1 | 4 | 5 | 1 | 6 | Transcription activator involved in myogenesis | dPWC150 | Phenotype |
| N4BP2 | 0 | 0 | 0 | 0 | 0 | 0 | 1 | 0 | 0 | 1 | 0 | 0 | 0 | 0 | 0 | 0 | 0 | 1 | 4 | 5 | Role in DNA repair/recombination, has 5′-polynucleotide kinase and nicking endonuclease activity | dPWC150 | eQTL |
| TCF4 | 1 | 0 | 0 | 0 | 0 | 0 | 0 | 0 | 0 | 0 | 1 | 1 | 1 | 1 | 1 | 0 | 5 | 3 | 6 | 9 | Transcription factor involved in neuronal differentiation | dPWC150 | Phenotype |
| TPSD1 | 0 | 0 | 0 | 0 | 0 | 1 | 1 | 0 | 1 | 1 | 0 | 0 | 0 | 0 | 0 | 0 | 0 | 4 | 3 | 7 | Major trypsin-like serine protease | dPWC150 | eQTL |
The different criteria used for gene selection are indicated in columns. Genes passing the selection criterion for each column are indicated as 1; genes not passing the criteria are indicated by 0. Column 1, gene name; column 2, selection based on muscle gene expression profiling (transcriptomics); column 3, selection based on plasma proteomic profiling; column 4, selection based on genome-wide association study (GWAS)-derived gene-level association with intrinsic and Delta physical working capacity at a heart rate of 150 beats/min (iPWC150 and dPWC150, respectively); column 5, selection based on gene membership in common enriched pathways from GWAS data; column 6, selection based on significant expression quantitative trait loci (eQTL) in whole blood in Eugene analysis; column 7, selection based on significant eQTL in subcutaneous or visceral adipose tissue (SAT/VAT) in Eugene analysis; column 8, selection based on significant eQTL in skeletal muscle in Eugene analysis; column 9, selection based on significant eQTL in whole blood in summary data-based Mendelian randomization (SMR) analysis; column 10, selection based on significant eQTL in SAT/VAT in SMR analysis; column 11, selection based on significant eQTL in skeletal muscle in SMR analysis; column 12, count of knockout mouse adipose phenotypes; column 13, count of knockout mouse cardiovascular phenotypes; column 14, count of knockout mouse hematopoietic phenotypes; column 15, count of knockout mouse homeostatic/metabolism phenotypes; column 16, count of knockout mouse muscle phenotypes; column 18, total count of knockout mouse phenotypes; column 19, count of significant SNP-trait associations for cardiovascular traits; column 20, count of significant SNP-trait associations for muscle traits; column 21, total count of significant SNP-trait associations; column 22, brief summary of gene function; column 23, relevant GWAS; column 24, source of prioritization (phenotype focused or eQTL focused).
The results from the GWAS, genomic, proteomic, and phenotype analyses for iPWC150 and dPWC150 associations are summarized in the Circos plots (58) shown in Fig. 10, A and B, respectively. Each Circos plot shows the genomic locations in the outer ring and results from different analyses in the inner ring tracks. In each track, the negative logarithm of the gene-level P values for each analysis is plotted except for the phenotype analysis tracks, where the number of phenotypes observed per gene is shown. Prioritized genes are indicated and colored based on whether they were obtained from the phenotype-focused analysis (red) or eQTL-focused analysis (blue).
Figure 10.
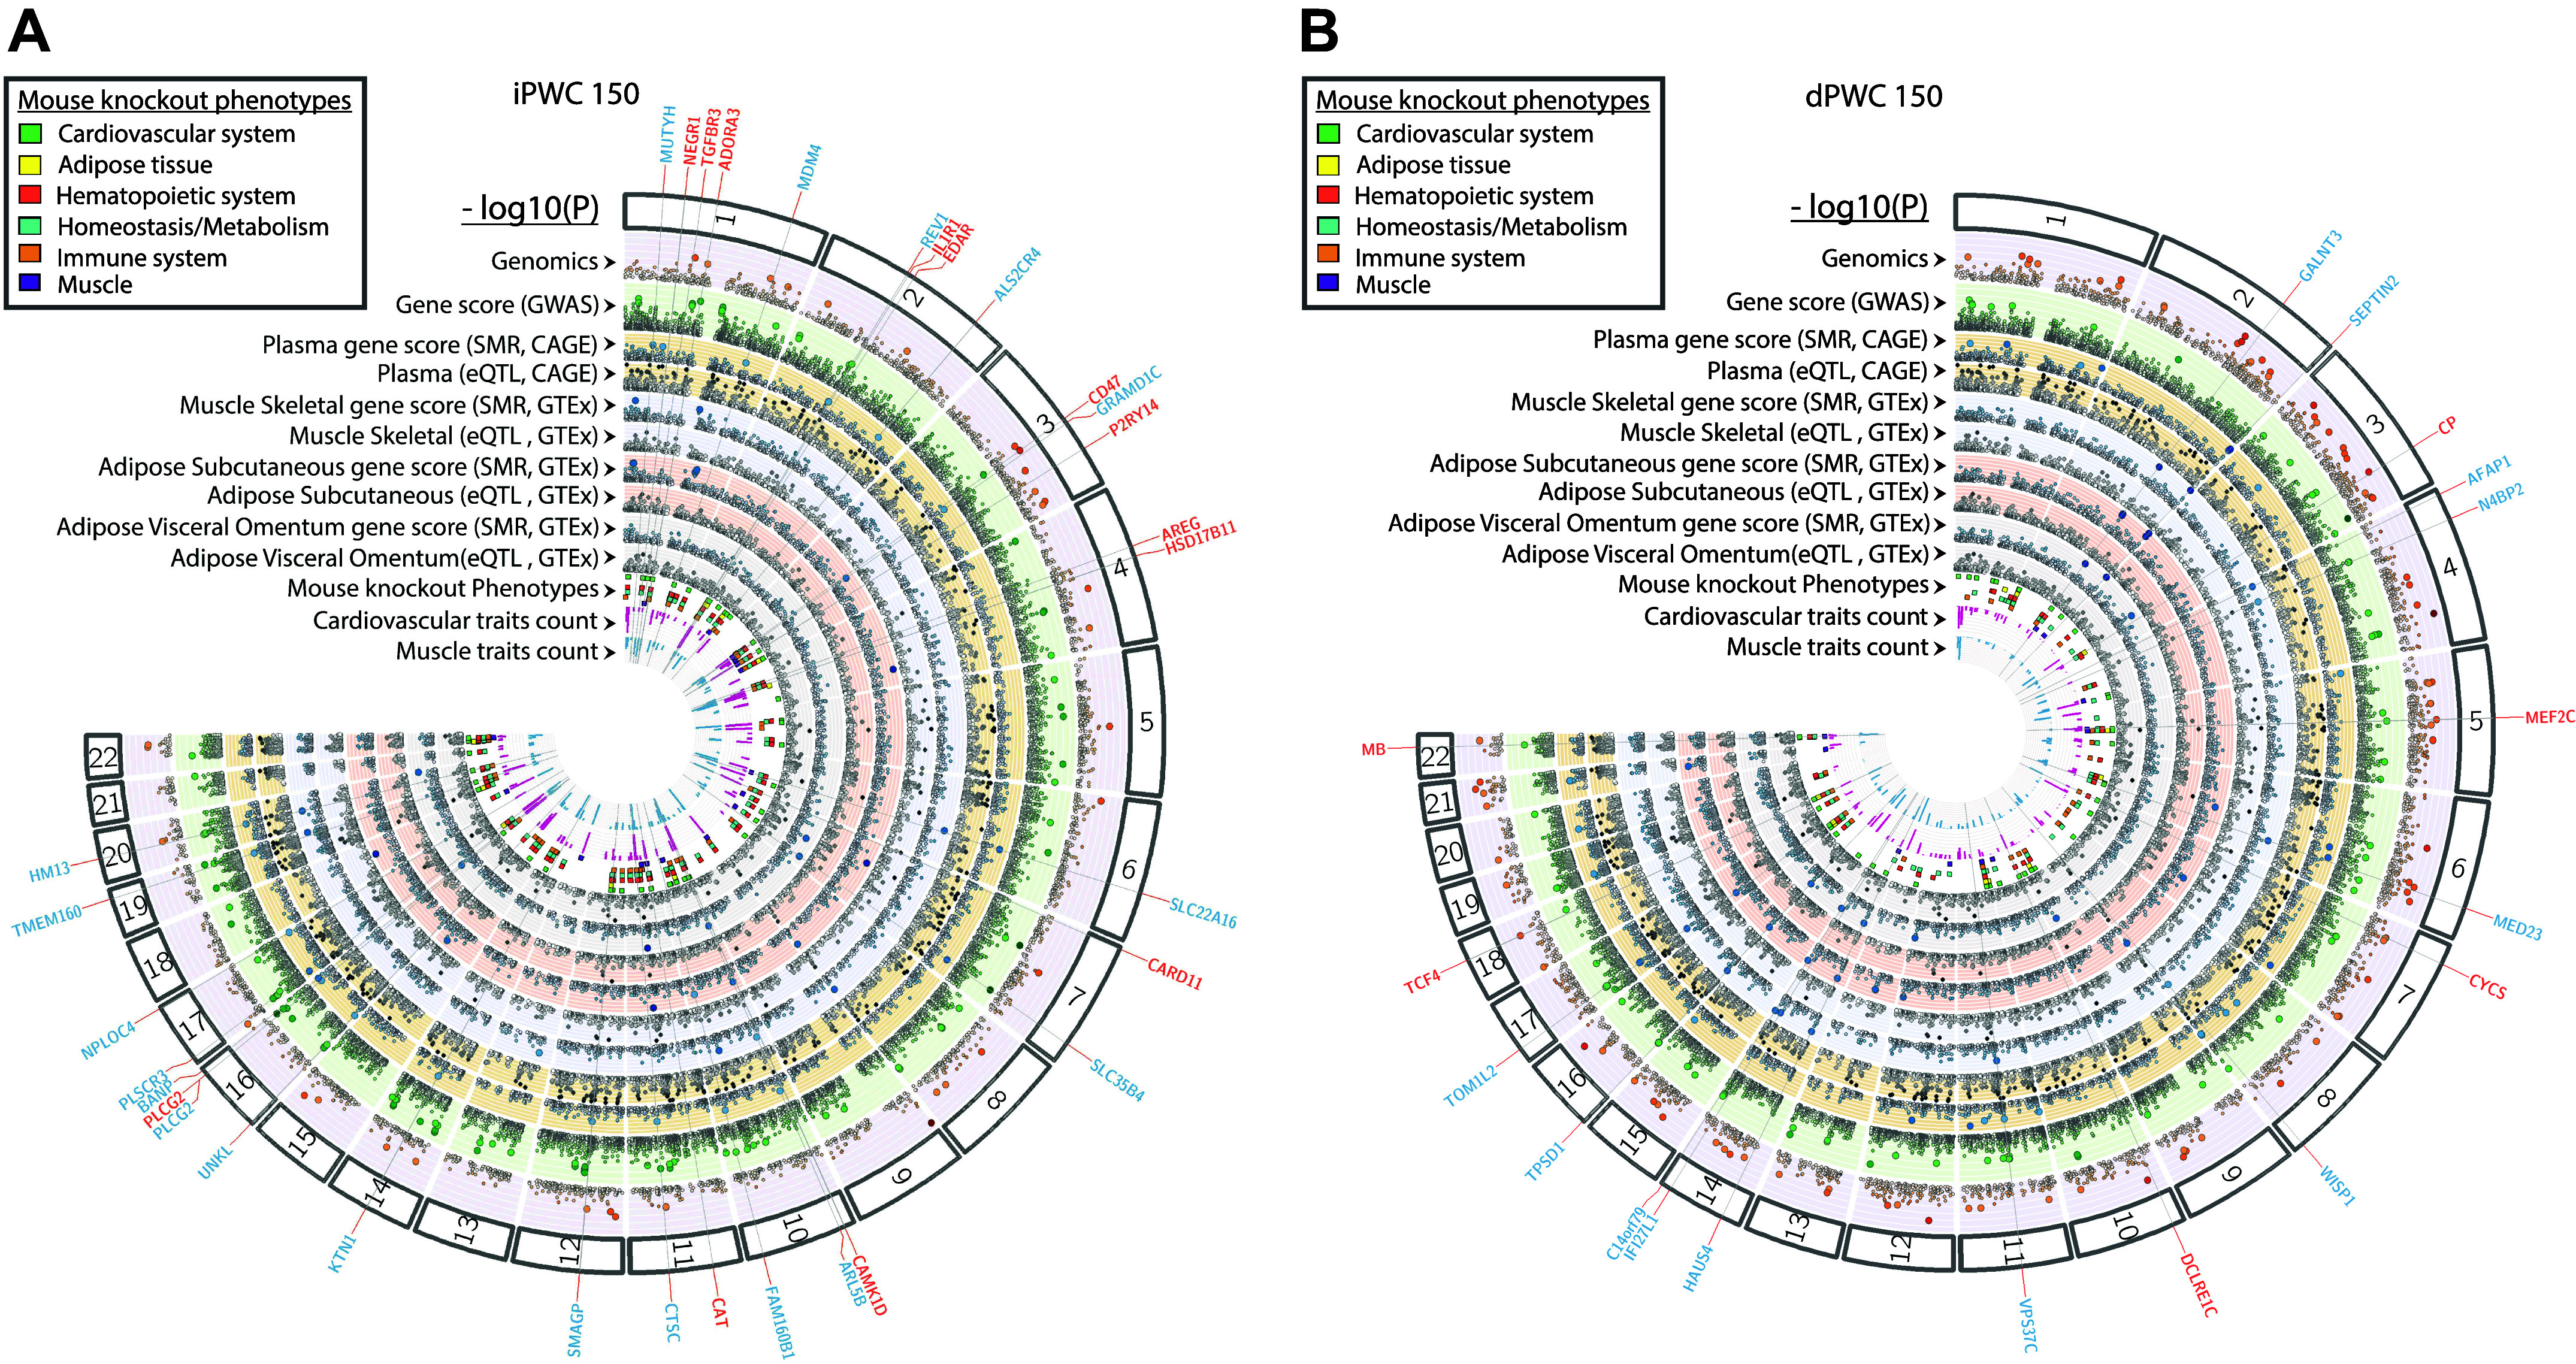
Circos plot summarizing results from genome-wide association study (GWAS), transcriptomic, proteomic, and phenotype analysis in intrinsic and delta physical working capacity at a heart rate of 150 beats/min (iPWC150 and dPWC150, respectively). A: iPWC150 analysis results, with all plot points referring to the negative logarithm of P values, unless otherwise indicated. From outer to inner rings: chromosome ideogram, muscle gene expression profiling in a subset of HERITAGE subjects (pale purple ring), Pascal-derived gene-level association with iPWC150 (pale green ring), plasma expression quantitative trait loci (eQTL) analysis [top light tan ring: summary data-based Mendelian randomization (SMR) P value; bottom light tan ring: eQTL study P value], skeletal muscle eQTL analysis (top pale blue ring: SMR P value; bottom pale blue ring: eQTL study P value), subcutaneous adipose tissue eQTL analysis (top light red ring: SMR P value; bottom light red ring: eQTL study P value), visceral adipose tissue eQTL analysis (top pale gray ring: SMR P value; bottom pale gray ring: eQTL study P value), number of root phenotypes impacted in knockout mouse models (multicolored square tiles), number of SNP-trait associations for cardiovascular traits (pink bars), and number of SNP-trait associations for muscle traits (blue bars). Prioritized candidate genes identified from phenotype-focused analysis are shown in red, and genes identified from eQTL-focused analysis are indicated in blue. B: analysis results for dPWC150-associated genes. Data are organized in the same way as for iPWC150.
DISCUSSION
Measures of submaximal cardiorespiratory fitness, including PWC150, hold promise as alternative markers of health-related fitness due to their relationships with activities of daily living, robust associations with diseases such as metabolic syndrome (4), and relative ease of measurement. Intrinsic PWC150 is characterized by significant familial resemblance among biological relatives, indicating both genetic and environmental influences on this phenotype (10, 59, 60). However, little is known about the specific genetic and molecular determinants of human variability in intrinsic submaximal working capacity and its response to regular exercise. Here, we focused on three hypotheses, which were tested using a variety of approaches. Using genetic association data as the starting point, the present study used an integrative bioinformatics framework to identify molecular targets (genes, proteins, and metabolites) that were associated with variability in baseline and training response measures of submaximal exercise capacity (iPWC150 and dPWC150, respectively). These experiments generated a list of candidate genes that were examined for functional effects in previously reported knockout mouse models and associations with cardiovascular and muscle-specific traits in the HERITAGE sample of European descent.
Intrinsic Submaximal Working Capacity Versus V̇o2max
iPWC150 is moderately correlated with intrinsic V̇o2max, with a common variance of 32%. The panel of genes identified herein for iPWC150 was compared with the set of genes reported previously by Ghosh et al. (25) for intrinsic V̇o2max to substantiate our hypothesis that these panels of genes are markedly different. The rationale is that heart volume, myocardial filling, SV, and cardiac output together with total hemoglobin content are the major determinants of V̇o2max in the sedentary state (18) but contribute in a less dominant fashion to iPWC150. From the bioinformatics pipeline, the following genes emerged as the most likely to contribute to individual differences in PWC150 in the sedentary state: ADIPOQ, ADORA3, AREG, CACNB3, CAMK1D, CARD11, CAT, CD47, CLEC2B, DLG2, DLL4, DMRT2, EDAR, ENTPD1-AS1, EPHA7, HSD17B11, IL1R1, MB, MSTN, NEGR1, PDE4D, PLCG2, P2RY14, RNF165, RP13-467H17.1, SHISA6, SIRT1, SMOC1, TGFBR3, and UNC5C. This set of genes stands in contrast to the gene loci retained as prime candidates for human variability in V̇o2max among sedentary adults based on findings from GWAS analysis and skeletal muscle transcriptomics: ADRB1, ARL61P5, ATE1, CA9, CASQ2, DMRT2, GBA2, NOTO, PICALM, PRADC1, RAB11FIP5, SGCG, and SSB (25). Thus, as hypothesized, the panels of genes underlying variability in V̇o2max and submaximal exercise capacity in the sedentary state are markedly different.
Intrinsic Submaximal Working Capacity (iPWC150)
The muscle gene expression analysis identified DMRT2, KCNJ3, and CD47 genes as of interest. All three genes displayed an increase in gene expression with increasing iPWC150 levels. DMRT2 is a transcriptional activator that directly regulates early activation of the myogenic determination gene MYF5. Genetic variants in DMRT2 were associated with several muscle and cardiovascular traits in HERITAGE as well as muscle phenotypes in MGI. The protein encoded by the KCNJ3 gene facilitates inward flow of potassium to a cell and plays an important role in regulating heartbeat. Mutations in KCNJ3 are causally associated with the development of bradyarrhythmias and atrial fibrillation (61). The CD47 gene was also significant in eQTL analysis (Eugene) and showed consistency in direction (β) across the whole blood eQTL database for the strongest eQTL SNPs and muscle gene expression data in HERITAGE. CD47 is a receptor for thrombospondin-1 and limits nitric oxide-cGMP and cAMP signaling, both of which can promote mitochondrial biogenesis. An experimental study in mice has shown that loss of function of CD47 is associated with increases in endurance performance, lower reactive oxygen species production, and more efficient metabolism (62). In addition to these genes, several other candidate genes for iPWC150 were also identified. The RP11-499P20.2 gene was identified in GWAS analysis, significant in all four eQTL tissues in SMR (GTEx whole blood, SAT, VAT, and skeletal muscle), and significant in eQTL from Eugene in adipose and muscle. RP11-499P20.2 is antisense to the CACNB2 gene, which encodes a subunit of a voltage-dependent calcium channel. CACNB2 is associated with Lambert-Eaton myasthenic syndrome (63), an autoimmune disease of neuromuscular transmission in which autoantibodies against the voltage-gated calcium channel at the presynaptic nerve terminal play a major role in decreasing quantal release of acetylcholine, leading to characteristic muscle weakness and autonomic symptoms.
From proteomics analysis, we observed a downregulation of GDF8/11 (myostatin) with increasing baseline PWC150, consistent with the role of GDF8 signaling as an inhibitor of muscle mass (64), which, in turn, is positively associated with cardiorespiratory fitness (65, 66). Also consistent was the observed positive association between plasma IGFBP2 protein and iPWC150, as IGFBP-2 is typically associated with skeletal muscle growth (67). At the pathway level, strong downregulation was noted for fatty acid- and heme metabolism-related pathways with increasing iPWC150 levels. The inverse relationship between heme metabolism and iPWC150 status may appear counterintuitive, as greater heme biosynthesis should lead to greater oxygen-carrying capacity and therefore greater iPWC150 values. However, the level of plasma heme metabolism proteins is most likely a reflection of erythropoietic cell lysis (e.g., red blood cell turnover). Our results are compatible with a reduced turnover of cells of the erythropoietic lineage associated with increased erythropoiesis. This scenario is consistent with an increased submaximal exercise capacity.
The plasma protein abundance profile for iPWC150 and dPWC150 is markedly different from the plasma proteome characteristics that we reported recently on the same cohort for baseline V̇o2max and its response to the HERITAGE exercise program (68). In the latter study, there were 147 circulating proteins associated with baseline V̇o2max, with 85 of them positively associated, including proteins related to angiogenesis, coagulation, hematopoiesis, and lipid metabolism, whereas leptin, C reactive protein, and insulin were among the 62 proteins negatively associated with baseline V̇o2max. On the other hand, 102 plasma proteins assessed at baseline were associated with the training response of V̇o2max (68). Only five protein abundances were associated with both V̇o2max traits (T132B, ATF6A, CO9A1, insulin, and PIANP), a finding consistent with the lack of correlation between baseline V̇o2max and its training response (69).
Analysis of iPWC150-associated plasma metabolites showed that metabolites involved in ketone body metabolism (acetoacetate, 2-hydroxybutyrate, and 3-hydroxybutyrate) were negatively associated with iPWC150 (Fig. 7A). As extrahepatic tissues such as muscle are known to oxidize ketone bodies, often in preference to glucose and fatty acid (70), the inverse association to iPWC150 might indicate a more efficient uptake from plasma in subjects with higher PWC150 levels. In addition, the lower ketone body metabolite levels could be a consequence of increased blood flow to the working muscles during exercise at the cost of reduced blood flow to the liver, the primary site for ketone body synthesis (71).
Gene prioritization experiments based on knockout mouse and human muscle trait associations identified 15 genes associated with iPWC150, 13 from phenotype-focused selection and 2 (RP13-467H17.1 and ENTPD1-AS1) from eQTL-focused selection. The physiology underlying individual submaximal exercise capacity is inherently complex, and the prioritized gene list reflects this complexity as evidenced by the presence of genes involved in calcium signaling (CAMK1D and PLCG2), cell adhesion (NEGR1 and CD47), and immune functions (CARD11, P2RY14, and IL1R1).
Intrinsic submaximal working capacity is determined in part by an individual’s cardiovascular function and oxygen transport ability. Importantly, significant familial aggregation and heritability levels have been reported for intrinsic levels of SV and cardiac output during submaximal exercise in the same population (22). We tested whether there were associations between the prioritized genes and cardiovascular function and oxygen transport in knockout mouse models. Leveraging the MGI database, we found that knockouts of 11 of the 15 prioritized genes resulted in alterations to hematopoietic phenotypes, especially knockouts of the CARD11 gene. Hematopoiesis plays a prominent role in healthy cardiovascular function and oxygen transport (72). CARD11 was also significantly associated with iPWC150 in SMR analysis, suggesting genetically determined levels of CARD11 muscle expression are causally associated with iPWC150. These results suggest that this set of genes influences iPWC150 in part by oxygen transport capacity-mediated hematopoiesis.
It has been suggested that intrinsic submaximal working capacity is also influenced by peripheral factors (73). We have shown the potential role of genes involved in calcium signaling in determining iPWC150, namely, CAMK1D and PLCG2. Calcium signaling is critical for normal skeletal muscle contraction, and the contractile properties of a muscle are largely determined by the molecular diversity of the calcium signaling system of the muscle (74, 75). PLCG2 is of particular interest as it was significantly associated with iPWC150 in SMR whole blood analysis and with relevant skeletal muscle phenotypes in both HERITAGE and MGI, as shown herein.
Training Response of PWC150
We have previously shown that intrinsic V̇o2max and exercise-induced changes in V̇o2max are poorly correlated (76) and are likely to be governed by distinct biological processes (25, 77). Exercise training improves submaximal working capacity via multiple system changes, including alterations in skeletal muscle physiology and metabolism and oxygen transport capacity (78). This is supported by our findings from gene expression experiments where the skeletal muscle cell differentiation pathway was enriched in genes with baseline expression negatively associated with dPWC150, suggestive of a less differentiating and more proliferative phenotype in individuals with increased trainability. Along the same lines, dPWC150 was positively associated with baseline expression of genes in the planar cell polarity pathway, which has been previously implicated in satellite stem cell expansion and enhanced muscle regeneration (79). Notably, the Wnt planar cell polarity pathway has been implicated in regulating the orientation of myocyte growth in the developing myotome (80), and Wnt/β-catenin signaling in satellite cells within adult muscle appears to control myogenic lineage progression by limiting Notch signaling and thus promoting differentiation (81).
Proteomics analysis demonstrated that pathways related to mTOR signaling, oxidative phosphorylation, and actinomyosin structure formation were upregulated among the dPWC150-associated pathways. The overall upregulation of these pathways is consistent with expectations as increases in muscle contractile capacity and energy generation are potentially conducive to better responsiveness of submaximal exercise capacity to training.
On the other hand, plasma metabolomics analysis revealed the baseline amino acid derivative carnitine and several medium- and long-chain fatty acyl-carnitines (C6-, C7-, and C16-acylcarnitines) to be positively correlated with dPWC150 levels. Carnitine is a key component of intermediary metabolism with the primary function of long-chain fatty acid transport from the cytosol to the mitochondrial matrix as substrates for fatty acid β-oxidation and energy production (82). As skeletal muscle is a major target of plasma carnitine transport (82, 83), we speculate that increased baseline levels of circulating carnitine may contribute to increased carnitine transport to muscle allowing for increased muscular capacity with training and increased dPWC150. The functional significance of plasma acylcarnitines is unclear, although they have been postulated to reflect traffic between cells or organs or as a sink for cellular and tissue acylcarnitine sequestration (84, 85). In addition, acylcarnitine formation prevents CoA trapping, allowing continuation of CoA-dependent metabolic processes in key tissues (86).
Gene prioritization experiments based on knockout mouse and human muscle trait association analyses identified 11 genes associated with dPWC150, 6 from phenotype-focused selection and 5 from eQTL-focused selection. Several of these genes are involved in skeletal muscle physiology including oxygen transport, oxidative phosphorylation, and myogenesis. Furthermore, of these 11 genes, 5 were significant in SMR analysis of muscle tissue (AFAP1, CCN4, HAUS4, N4BP2, and TPSD1), potentially indicating that these genes contribute to training-induced changes in PWC150 through genetically determined alterations in their skeletal muscle expression. The MB gene was identified in both genomic and proteomic analyses, and eight MB SNPs were significantly associated with skeletal muscle phenotypes in HERITAGE. MB is expressed in both cardiac and skeletal muscle, is responsible for the transport and storage of oxygen within the muscle cell, and contributes to energy availability and regulation of respiration during muscle contraction and exercise (87). The muscle expression of CYCS, a gene involved in oxygen transport and oxidative phosphorylation, was positively correlated with dPWC150, and six CYCS SNPs were significantly associated with skeletal muscle phenotypes. Skeletal muscle CYCS expression increased in response to 6 wk of endurance training as well as in response to an acute bout of exercise, supporting a potential role of CYCS in trainability (88). Similarly, MEF2C was identified as a potential regulator of dPWC150 in both GWAS and genomic analyses, with baseline MEF2C expression in muscle positively correlated with dPWC150. MEF2C is part of the MEF2 family of transcription factors, which play an important role in cardiac and skeletal muscle differentiation (88). Skeletal muscle-specific deletion of MEF2C results in a reduction of slow muscle fibers and inhibits activity-induced skeletal muscle fiber transformation (89). Furthermore, expression of a hyperactive form of MEF2C in skeletal muscle results in an increase in slow muscle fiber abundance and an increase in endurance exercise capacity compared with wild-type mice (89).
Finally, the possible role of AFAP1 in the regulation of dPWC150 is also of interest. SNP rs13127935 is associated with reduced AFAP1 gene expression in GTEx eQTL studies and is correlated with dPWC150 in GWAS. AFAP1 encodes a motor unit-associated protein, which organizes a network linking other proteins (90). This network alters the structure and function of actin filaments, thus contributing to various physiological processes including skeletal muscle contraction, cytophagy, cell motion, invasion, and metastasis. In muscle cells, actin filaments are aligned, and myosin proteins generate forces on the filaments to support muscle contraction. Downmodulation of AFAP-110 resulted in decreased cell-matrix adhesion and cell migration, defective focal adhesions, and reduced integrin-β1 expression (91), which may all be relevant for skeletal muscle function changes with training. Notably, there is an antisense transcript (AFAP1-AS1) transcribed from the antisense strand of AFAP1 gene, which has been shown to function as a promoter of tumor cell growth and invasion in several cancers (92, 93). However, no significant eQTLs were mapped to AFAP1-AS1 in GTEx, suggesting that the observed expression effects of eQTL rs13127935 in our study are likely targeted to the AFAP1 gene.
Strengths and Limitations
The HERITAGE Family Study represents a unique dataset that allowed us to integrate genomic, transcriptomic, proteomic, metabolomic, and phenotypic data to prioritize genes and pathways associated with iPWC150 and its trainability. Inference bias may impact our interpretation of results from the MGI database analysis, as the lack of a phenotype in the presence of a knockout does not necessarily provide evidence for a gene’s noninvolvement. Even though the HERITAGE sample size is large for exercise training studies, it is modest for the large-scale omics investigations undertaken here. We know of no comparable exercise training resources that would have made it possible to pursue replications of our findings at this time. It should also be recognized that the study was not conceived to investigate specifically the physiological determinants and molecular transducers of submaximal cardiorespiratory fitness phenotypes even though the study incorporated a rich panel of submaximal exercise physiology indicators.
Conclusions
Submaximal working capacity is a valuable biomarker of health, particularly in a public health setting, as well as a potential target for intervention. As with maximal measures of cardiorespiratory fitness, iPWC150 and its trainability are characterized by significant interindividual variation. Data and in silico inferences from DNA variants, muscle gene expression profiling, plasma proteomics, and metabolomics combined with association experiments between GWAS-derived SNPs at prioritized genes and panels of cardiovascular and skeletal muscle traits plus the phenotype profile observed from knockouts of many of the prioritized genes were used to identify potential genes and pathways related to variability in submaximal exercise capacity and its response to exercise training. We conclude that the most prominent genes and pathways contributing to human variability in iPWC150 and dPWC150 are markedly different from each other. We also found supportive evidence for the hypothesis that these genes and pathways associate primarily with skeletal muscle morphology and metabolism and oxygen transport capacity. Our holistic bioinformatic analyses prioritized two sets of genes and associated pathways of physiological importance in the determination of iPWC150 and the response of PWC150 to an endurance exercise program. Further investigations of these genes and pathways may improve our understanding of the health benefits of exercise, identify potential targets for exercise mimetics, and eventually contribute to precision exercise medicine approaches.
DATA AVAILABILITY
Data will be made available upon reasonable request.
SUPPLEMENTAL DATA
Supplemental Fig. S1 https://doi.org/10.6084/m9.figshare.23706057.v1.
Supplemental Fig. S2 https://doi.org/10.6084/m9.figshare.23706060.v1.
Supplemental Fig. S3 https://doi.org/10.6084/m9.figshare.23706063.v1.
Supplemental Tables S1–S13: https://doi.org/10.6084/m9.figshare.23706054.v1.
GRANTS
The HERITAGE Family Study was initially funded by the National Institutes of Health (NIH) through the following grants: HL45670 [to C.B., Principal Investigator (PI)] from 1992 to 2010, HL47317 (to D. C. Rao, PI) from 1992 to 2010, HL47321 (to J. H. Wilmore, PI, deceased) from 1992 to 2003, HL47323 (to A. S. Leon, PI, deceased) from 1992 to 2003, and HL47327 (to J. S. Skinner, PI) from 1992 to 2003. C.B. was supported by the John W. Barton Sr. Chair in Genetics and Nutrition and by NIH Grant P30GM118430 in the course of this study. C.B.C. is supported by NIH Grant U24DK112340. R.E.G. is supported by NIH Grants U54GM115428, R01DK081572, R01NR019628, and U24DK112340. S.G. is supported by NIH Grants U54GM104940 and P20GM103528 and by the National Medical Research Council, Ministry of Health Singapore (Grant WBS R913200076263). M.Y.M. is supported by NIH Grant T32HL007208. P.R. is supported by NIH Grants T32HL125232 and 5T32HL125232. J.M.R. is supported by NIH Grant K23HL150327-02. M.A.S. is supported by NIH Grants R01HL146462, R01NR019628, R01DK128057, and SC INBRE P20GM103499. J.L.B. was supported by American Heart Association Predoctoral Fellowship Award 833917 and NIH Grant SC INBRE P20GM103499.
DISCLOSURES
No conflicts of interest, financial or otherwise, are declared by the authors.
AUTHOR CONTRIBUTIONS
M.A.S., S.G., and C.B. conceived and designed research; C.B.C., R.E.G., M.A.S., S.G., and C.B. performed experiments; M.H., J.L.B., J.J.R., C.S.S., D.T.U.H.L., P.R., M.Y.M., D.H.K., J.M.R., M.A.S., and S.G. analyzed data; R.E.G., J.L.B., J.J.R., J.M.R., M.A.S., S.G., and C.B. interpreted results of experiments; M.A.S. and S.G. prepared figures; M.H., R.E.G., J.L.B., J.J.R., C.S.S., P.R., M.Y.M., D.H.K., J.M.R., M.A.S., S.G., and C.B. drafted manuscript; M.H., C.B.C., R.E.G., J.M.R., M.A.S., S.G., and C.B. edited and revised manuscript; all authors approved final version of manuscript.
ACKNOWLEDGMENTS
Thanks are expressed to the HERITAGE families who participated in the study. We also want to express our gratitude to Dr. D. C. Rao, Dr. James S. Skinner, and the late Dr. Arthur S. Leon and Dr. Jack H. Wilmore. We thank other colleagues, research collaborators, and technical personnel who were involved in the planning and execution of the study. We thank Melanie Peterson for the support in the preparation and editing of the manuscript.
REFERENCES
- 1. Ross R, Blair SN, Arena R, Church TS, Despres JP, Franklin BA, Haskell WL, Kaminsky LA, Levine BD, Lavie CJ, Myers J, Niebauer J, Sallis R, Sawada SS, Sui X, Wisloff U; American Heart Association Physical Activity Committee of the Council on Lifestyle and Cardiometabolic Health; Council on Clinical Cardiology; Council on Epidemiology and Prevention, Council on Cardiovascular and Stroke Nursing; Council on Functional Genomics and Translational Biology; Stroke Council. Importance of assessing cardiorespiratory fitness in clinical practice: a case for fitness as a clinical vital sign: a scientific statement from the American Heart Association. Circulation 134: e653–e699, 2016. doi: 10.1161/CIR.0000000000000461. [DOI] [PubMed] [Google Scholar]
- 2. Bouchard C, Blair SN, Katzmarzyk PT. Less sitting, more physical activity, or higher fitness? Mayo Clin Proc 90: 1533–1540, 2015. doi: 10.1016/j.mayocp.2015.08.005. [DOI] [PubMed] [Google Scholar]
- 3. Kodama S, Saito K, Tanaka S, Maki M, Yachi Y, Asumi M, Sugawara A, Totsuka K, Shimano H, Ohashi Y, Yamada N, Sone H. Cardiorespiratory fitness as a quantitative predictor of all-cause mortality and cardiovascular events in healthy men and women: a meta-analysis. JAMA 301: 2024–2035, 2009. doi: 10.1001/jama.2009.681. [DOI] [PubMed] [Google Scholar]
- 4. Boule NG, Bouchard C, Tremblay A. Physical fitness and the metabolic syndrome in adults from the Quebec Family Study. Can J Appl Physiol 30: 140–156, 2005. doi: 10.1139/h05-111. [DOI] [PubMed] [Google Scholar]
- 5. Rheaume C, Arsenault BJ, Belanger S, Perusse L, Tremblay A, Bouchard C, Poirier P, Despres J-P. Low cardiorespiratory fitness levels and elevated blood pressure: what is the contribution of visceral adiposity? Hypertension 54: 91–97, 2009. doi: 10.1161/HYPERTENSIONAHA.109.131656. [DOI] [PubMed] [Google Scholar]
- 6. Noonan V, Dean E. Submaximal exercise testing: clinical application and interpretation. Phys Ther 80: 782–807, 2000. [PubMed] [Google Scholar]
- 7. McQuade KJ, Turner JA, Buchner DM. Physical fitness and chronic low back pain. An analysis of the relationships among fitness, functional limitations, and depression. Clin Orthop Relat Res 233: 198–204, 1988. [PubMed] [Google Scholar]
- 8. Bouchard C, Boulay M, Thibault MC, Carrier R, Dulac S. Training of submaximal working capacity: frequency, intensity, duration, and their interactions. J Sports Med Phys Fitness 20: 29–40, 1980. [PubMed] [Google Scholar]
- 9. Rowland TW, Rambusch JM, Staab JS, Unnithan VB, Siconolfi SF. Accuracy of physical working capacity (PWC170) in estimating aerobic fitness in children. J Sports Med Phys Fitness 33: 184–188, 1993. [PubMed] [Google Scholar]
- 10. Bouchard C, Lortie G, Simoneau JA, Leblanc C, Theriault G, Tremblay A. Submaximal power output in adopted and biological siblings. Ann Hum Biol 11: 303–309, 1984. doi: 10.1080/03014468400007201. [DOI] [PubMed] [Google Scholar]
- 11. Campbell PT, Katzmarzyk PT, Malina RM, Rao DC, Perusse L, Bouchard C. Prediction of physical activity and physical work capacity (PWC150) in young adulthood from childhood and adolescence with consideration of parental measures. Am J Hum Biol 13: 190–196, 2001. doi:. [DOI] [PubMed] [Google Scholar]
- 12. Cumming GR. A personal activity prescription. Can Med Assoc J 96: 1429–1430, 1967. [PMC free article] [PubMed] [Google Scholar]
- 13. Clarke J, de Lannoy L, Ross R. Comparison of measures of maximal and submaximal fitness in response to exercise. Med Sci Sports Exerc 49: 711–716, 2017. doi: 10.1249/MSS.0000000000001164. [DOI] [PubMed] [Google Scholar]
- 14. Lortie G, Simoneau JA, Hamel P, Boulay MR, Landry F, Bouchard C. Responses of maximal aerobic power and capacity to aerobic training. Int J Sports Med 5: 232–236, 1984. doi: 10.1055/s-2008-1025911. [DOI] [PubMed] [Google Scholar]
- 15. Vollaard NB, Constantin-Teodosiu D, Fredriksson K, Rooyackers O, Jansson E, Greenhaff PL, Timmons JA, Sundberg CJ. Systematic analysis of adaptations in aerobic capacity and submaximal energy metabolism provides a unique insight into determinants of human aerobic performance. J Appl Physiol (1985) 106: 1479–1486, 2009. doi: 10.1152/japplphysiol.91453.2008. [DOI] [PubMed] [Google Scholar]
- 16. Bassett DR Jr, Howley ET. Limiting factors for maximum oxygen uptake and determinants of endurance performance. Med Sci Sports Exerc 32: 70–84, 2000. doi: 10.1097/00005768-200001000-00012. [DOI] [PubMed] [Google Scholar]
- 17. Calbet JA, Lundby C, Koskolou M, Boushel R. Importance of hemoglobin concentration to exercise: acute manipulations. Respir Physiol Neurobiol 151: 132–140, 2006. doi: 10.1016/j.resp.2006.01.014. [DOI] [PubMed] [Google Scholar]
- 18. Lundby C, Montero D, Joyner M. Biology of VO2 max: looking under the physiology lamp. Acta Physiol (Oxf) 220: 218–228, 2017. doi: 10.1111/apha.12827. [DOI] [PubMed] [Google Scholar]
- 19. Montero D, Diaz-Canestro C, Lundby C. Endurance training and VO2max: role of maximal cardiac output and oxygen extraction. Med Sci Sports Exerc 47: 2024–2033, 2015. doi: 10.1249/MSS.0000000000000640. [DOI] [PubMed] [Google Scholar]
- 20. Gaskill SE, Rice T, Bouchard C, Gagnon J, Rao DC, Skinner JS, Wilmore JH, Leon AS. Familial resemblance in ventilatory threshold: the HERITAGE Family Study. Med Sci Sports Exerc 33: 1832–1840, 2001. doi: 10.1097/00005768-200111000-00006. [DOI] [PubMed] [Google Scholar]
- 21. Perusse L, Gagnon J, Province MA, Rao DC, Wilmore JH, Leon AS, Bouchard C, Skinner JS. Familial aggregation of submaximal aerobic performance in the HERITAGE Family study. Med Sci Sports Exerc 33: 597–604, 2001. doi: 10.1097/00005768-200104000-00014. [DOI] [PubMed] [Google Scholar]
- 22. An P, Rice T, Gagnon J, Leon AS, Skinner JS, Bouchard C, Rao DC, Wilmore JH. Familial aggregation of stroke volume and cardiac output during submaximal exercise: the HERITAGE Family Study. Int J Sports Med 21: 566–572, 2000. doi: 10.1055/s-2000-12983. [DOI] [PubMed] [Google Scholar]
- 23. An P, Perusse L, Rankinen T, Borecki IB, Gagnon J, Leon AS, Skinner JS, Wilmore JH, Bouchard C, Rao DC. Familial aggregation of exercise heart rate and blood pressure in response to 20 weeks of endurance training: the HERITAGE family study. Int J Sports Med 24: 57–62, 2003. doi: 10.1055/s-2003-37200. [DOI] [PubMed] [Google Scholar]
- 24. Rice TK, Sarzynski MA, Sung YJ, Argyropoulos G, Stutz AM, Teran-Garcia M, Rao DC, Bouchard C, Rankinen T. Fine mapping of a QTL on chromosome 13 for submaximal exercise capacity training response: the HERITAGE Family Study. Eur J Appl Physiol 112: 2969–2978, 2012. doi: 10.1007/s00421-011-2274-8. [DOI] [PMC free article] [PubMed] [Google Scholar]
- 25. Ghosh S, Hota M, Chai X, Kiranya J, Ghosh P, He Z, Ruiz-Ramie JJ, Sarzynski MA, Bouchard C. Exploring the underlying biology of intrinsic cardiorespiratory fitness through integrative analysis of genomic variants and muscle gene expression profiling. J Appl Physiol (1985) 126: 1292–1314, 2019. doi: 10.1152/japplphysiol.00035.2018. [DOI] [PMC free article] [PubMed] [Google Scholar]
- 26. Bouchard C, Leon AS, Rao DC, Skinner JS, Wilmore JH, Gagnon J. The HERITAGE family study. Aims, design, and measurement protocol. Med Sci Sports Exerc 27: 721–729, 1995. [PubMed] [Google Scholar]
- 27. Sarzynski MA, Rice TK, Despres JP, Perusse L, Tremblay A, Stanforth PR, Tchernof A, Barber JL, Falciani F, Clish C, Robbins JM, Ghosh S, Gerszten RE, Leon AS, Skinner JS, Rao DC, Bouchard C. The HERITAGE Family Study: a review of the effects of exercise training on cardiometabolic health, with insights into molecular transducers. Med Sci Sports Exerc 54: S1–S43, 2022. doi: 10.1249/MSS.0000000000002859. [DOI] [PMC free article] [PubMed] [Google Scholar]
- 28. Slade SC, Dionne CE, Underwood M, Buchbinder R, Beck B, Bennell K, et al. Consensus on exercise reporting template (CERT): modified Delphi study. Phys Ther 96: 1514–1524, 2016. doi: 10.2522/ptj.20150668. [DOI] [PubMed] [Google Scholar]
- 29. Skinner JS, Wilmore KM, Krasnoff JB, Jaskolski A, Jaskolska A, Gagnon J, Province MA, Leon AS, Rao DC, Wilmore JH, Bouchard C. Adaptation to a standardized training program and changes in fitness in a large, heterogeneous population: the HERITAGE Family Study. Med Sci Sports Exerc 32: 157–161, 2000. doi: 10.1097/00005768-200001000-00023. [DOI] [PubMed] [Google Scholar]
- 30. Wilmore JH, Stanforth PR, Turley KR, Gagnon J, Daw EW, Leon AS, Rao DC, Skinner JS, Bouchard C. Reproducibility of cardiovascular, respiratory, and metabolic responses to submaximal exercise: the HERITAGE Family Study. Med Sci Sports Exerc 30: 259–265, 1998. doi: 10.1097/00005768-199802000-00014. [DOI] [PubMed] [Google Scholar]
- 31. Wilmore JH, Stanforth PR, Gagnon J, Rice T, Mandel S, Leon AS, Rao DC, Skinner JS, Bouchard C. Heart rate and blood pressure changes with endurance training: the HERITAGE Family Study. Med Sci Sports Exerc 33: 107–116, 2001. doi: 10.1097/00005768-200101000-00017. [DOI] [PubMed] [Google Scholar]
- 32. Wilmore JH, Farrell PA, Norton AC, Cote RW 3rd, Coyle EF, Ewy GA, Temkin LP, Billing JE. An automated, indirect assessment of cardiac output during rest and exercise. J Appl Physiol Respir Environ Exerc Physiol 52: 1493–1497, 1982. doi: 10.1152/jappl.1982.52.6.1493. [DOI] [PubMed] [Google Scholar]
- 33. Gaskill SE, Walker AJ, Serfass RA, Bouchard C, Gagnon J, Rao DC, Skinner JS, Wilmore JH, Leon AS. Changes in ventilatory threshold with exercise training in a sedentary population: the HERITAGE Family Study. Int J Sports Med 22: 586–592, 2001. doi: 10.1055/s-2001-18522. [DOI] [PubMed] [Google Scholar]
- 34. Wilmore JH, Despres JP, Stanforth PR, Mandel S, Rice T, Gagnon J, Leon AS, Rao D, Skinner JS, Bouchard C. Alterations in body weight and composition consequent to 20 wk of endurance training: the HERITAGE Family Study. Am J Clin Nutr 70: 346–352, 1999. doi: 10.1093/ajcn/70.3.346. [DOI] [PubMed] [Google Scholar]
- 35. Lohman TG. Applicability of body composition techniques and constants for children and youths. Exerc Sport Sci Rev 14: 325–357, 1986. [PubMed] [Google Scholar]
- 36. Ortiz O, Russell M, Daley TL, Baumgartner RN, Waki M, Lichtman S, Wang J, Pierson RN Jr, Heymsfield SB. Differences in skeletal muscle and bone mineral mass between black and white females and their relevance to estimates of body composition. Am J Clin Nutr 55: 8–13, 1992. doi: 10.1093/ajcn/55.1.8. [DOI] [PubMed] [Google Scholar]
- 37. Schutte JE, Townsend EJ, Hugg J, Shoup RF, Malina RM, Blomqvist CG. Density of lean body mass is greater in blacks than in whites. J Appl Physiol Respir Environ Exerc Physiol 56: 1647–1649, 1984. doi: 10.1152/jappl.1984.56.6.1647. [DOI] [PubMed] [Google Scholar]
- 38. Siri WE. Body composition from fluid spaces and density: analysis of methods. In: Techniques for Measuring Body Composition, edited by Brozek J, Henschel A.. Washington, DC: National Academy of Sciences, National Research Council, 1961, p. 223–244. [Google Scholar]
- 39. Rico-Sanz J, Rankinen T, Joanisse DR, Leon AS, Skinner JS, Wilmore JH, Rao DC, Bouchard C, Study HF; HERITAGE Family Study. Familial resemblance for muscle phenotypes in the HERITAGE Family Study. Med Sci Sports Exerc 35: 1360–1366, 2003. [Erratum in Med Sci Sports Exerc 37: 2017, 2005]. doi: 10.1249/01.MSS.0000079031.22755.63. [DOI] [PubMed] [Google Scholar]
- 40. Li Y, Willer CJ, Ding J, Scheet P, Abecasis GR. MaCH: using sequence and genotype data to estimate haplotypes and unobserved genotypes. Genet Epidemiol 34: 816–834, 2010. doi: 10.1002/gepi.20533. [DOI] [PMC free article] [PubMed] [Google Scholar]
- 41. Lamparter D, Marbach D, Rueedi R, Kutalik Z, Bergmann S. Fast and rigorous computation of gene and pathway scores from SNP-based summary statistics. PLoS Comput Biol 12: e1004714, 2016. doi: 10.1371/journal.pcbi.1004714. [DOI] [PMC free article] [PubMed] [Google Scholar]
- 42. Yoon S, Nguyen HCT, Yoo YJ, Kim J, Baik B, Kim S, Kim J, Kim S, Nam D. Efficient pathway enrichment and network analysis of GWAS summary data using GSA-SNP2. Nucleic Acids Res 46: e60, 2018. doi: 10.1093/nar/gky175. [DOI] [PMC free article] [PubMed] [Google Scholar]
- 43. Subramanian A, Tamayo P, Mootha VK, Mukherjee S, Ebert BL, Gillette MA, Paulovich A, Pomeroy SL, Golub TR, Lander ES, Mesirov JP. Gene set enrichment analysis: a knowledge-based approach for interpreting genome-wide expression profiles. Proc Natl Acad Sci USA 102: 15545–15550, 2005. doi: 10.1073/pnas.0506580102. [DOI] [PMC free article] [PubMed] [Google Scholar]
- 44. Nam D. Effect of the absolute statistic on gene-sampling gene-set analysis methods. Stat Methods Med Res 26: 1248–1260, 2017. doi: 10.1177/0962280215574014. [DOI] [PubMed] [Google Scholar]
- 45. Zhu Z, Zhang F, Hu H, Bakshi A, Robinson MR, Powell JE, Montgomery GW, Goddard ME, Wray NR, Visscher PM, Yang J. Integration of summary data from GWAS and eQTL studies predicts complex trait gene targets. Nat Genet 48: 481–487, 2016. doi: 10.1038/ng.3538. [DOI] [PubMed] [Google Scholar]
- 46. Westra HJ, Peters MJ, Esko T, Yaghootkar H, Schurmann C, Kettunen J, et al. Systematic identification of trans eQTLs as putative drivers of known disease associations. Nat Genet 45: 1238–1243, 2013. doi: 10.1038/ng.2756. [DOI] [PMC free article] [PubMed] [Google Scholar]
- 47. Lloyd-Jones LR, Holloway A, McRae A, Yang J, Small K, Zhao J, Zeng B, Bakshi A, Metspalu A, Dermitzakis M, Gibson G, Spector T, Montgomery G, Esko T, Visscher PM, Powell JE. The genetic architecture of gene expression in peripheral blood. Am J Hum Genet 100: 371, 2017. doi: 10.1016/j.ajhg.2017.01.026. [DOI] [PMC free article] [PubMed] [Google Scholar]
- 48.GTEx Consortium. Human genomics. The genotype-tissue expression (GTEx) pilot analysis: multitissue gene regulation in humans. Science 348: 648–660, 2015. doi: 10.1126/science.1262110. [DOI] [PMC free article] [PubMed] [Google Scholar]
- 49. Irizarry RA, Hobbs B, Collin F, Beazer-Barclay YD, Antonellis KJ, Scherf U, Speed TP. Exploration, normalization, and summaries of high density oligonucleotide array probe level data. Biostatistics 4: 249–264, 2003. doi: 10.1093/biostatistics/4.2.249. [DOI] [PubMed] [Google Scholar]
- 50. Edgar R, Domrachev M, Lash AE. Gene Expression Omnibus: NCBI gene expression and hybridization array data repository. Nucleic Acids Res 30: 207–210, 2002. doi: 10.1093/nar/30.1.207. [DOI] [PMC free article] [PubMed] [Google Scholar]
- 51. Subramanian A, Kuehn H, Gould J, Tamayo P, Mesirov JP. GSEA-P: a desktop application for Gene Set Enrichment Analysis. Bioinformatics 23: 3251–3253, 2007. doi: 10.1093/bioinformatics/btm369. [DOI] [PubMed] [Google Scholar]
- 52. Jacob J, Ngo D, Finkel N, Pitts R, Gleim S, Benson MD, Keyes MJ, Farrell LA, Morgan T, Jennings LL, Gerszten RE. Application of large-scale aptamer-based proteomic profiling to planned myocardial infarctions. Circulation 137: 1270–1277, 2018. doi: 10.1161/CIRCULATIONAHA.117.029443. [DOI] [PMC free article] [PubMed] [Google Scholar]
- 53. Kim CH, Tworoger SS, Stampfer MJ, Dillon ST, Gu X, Sawyer SJ, Chan AT, Libermann TA, Eliassen AH. Stability and reproducibility of proteomic profiles measured with an aptamer-based platform. Sci Rep 8: 8382, 2018. doi: 10.1038/s41598-018-26640-w. [DOI] [PMC free article] [PubMed] [Google Scholar]
- 54. Upton G, Cook I. A Dictionary of Statistics. UK: Oxford University Press, 2008. [Google Scholar]
- 55. Machiela MJ, Chanock SJ. LDlink: a web-based application for exploring population-specific haplotype structure and linking correlated alleles of possible functional variants. Bioinformatics 31: 3555–3557, 2015. doi: 10.1093/bioinformatics/btv402. [DOI] [PMC free article] [PubMed] [Google Scholar]
- 56. Abecasis GR, Cherny SS, Cookson WO, Cardon LR. Merlin–rapid analysis of dense genetic maps using sparse gene flow trees. Nat Genet 30: 97–101, 2002. doi: 10.1038/ng786. [DOI] [PubMed] [Google Scholar]
- 57. Ferreira MA, Jansen R, Willemsen G, Penninx B, Bain LM, Vicente CT, Revez JA, Matheson MC, Hui J, Tung JY, Baltic S, Le Souef P, Montgomery GW, Martin NG, Robertson CF, James A, Thompson PJ, Boomsma DI, Hopper JL, Hinds DA, Werder RB, Phipps S; Australian Asthma Genetics Consortium Collaborators. Gene-based analysis of regulatory variants identifies 4 putative novel asthma risk genes related to nucleotide synthesis and signaling. J Allergy Clin Immunol 139: 1148–1157, 2017. doi: 10.1016/j.jaci.2016.07.017. [DOI] [PMC free article] [PubMed] [Google Scholar]
- 58. Krzywinski M, Schein J, Birol I, Connors J, Gascoyne R, Horsman D, Jones SJ, Marra MA. Circos: an information aesthetic for comparative genomics. Genome Res 19: 1639–1645, 2009. doi: 10.1101/gr.092759.109. [DOI] [PMC free article] [PubMed] [Google Scholar]
- 59. Perusse L, Leblanc C, Bouchard C. Inter-generation transmission of physical fitness in the Canadian population. Can J Sport Sci 13: 8–14, 1988. [PubMed] [Google Scholar]
- 60. Perusse L, Lortie G, Leblanc C, Tremblay A, Theriault G, Bouchard C. Genetic and environmental sources of variation in physical fitness. Ann Hum Biol 14: 425–434, 1987. doi: 10.1080/03014468700009241. [DOI] [PubMed] [Google Scholar]
- 61. Yamada N, Asano Y, Fujita M, Yamazaki S, Inanobe A, Matsuura N, et al. Mutant KCNJ3 and KCNJ5 potassium channels as novel molecular targets in bradyarrhythmias and atrial fibrillation. Circulation 139: 2157–2169, 2019. doi: 10.1161/CIRCULATIONAHA.118.036761. [DOI] [PubMed] [Google Scholar]
- 62. Frazier EP, Isenberg JS, Shiva S, Zhao L, Schlesinger P, Dimitry J, Abu-Asab MS, Tsokos M, Roberts DD, Frazier WA. Age-dependent regulation of skeletal muscle mitochondria by the thrombospondin-1 receptor CD47. Matrix Biol 30: 154–161, 2011. doi: 10.1016/j.matbio.2010.12.004. [DOI] [PMC free article] [PubMed] [Google Scholar]
- 63. Taviaux S, Williams ME, Harpold MM, Nargeot J, Lory P. Assignment of human genes for beta 2 and beta 4 subunits of voltage-dependent Ca2+ channels to chromosomes 10p12 and 2q22-q23. Hum Genet 100: 151–154, 1997. doi: 10.1007/pl00008704. [DOI] [PubMed] [Google Scholar]
- 64. Walker RG, McCoy JC, Czepnik M, Mills MJ, Hagg A, Walton KL, Cotton TR, Hyvonen M, Lee RT, Gregorevic P, Harrison CA, Thompson TB. Molecular characterization of latent GDF8 reveals mechanisms of activation. Proc Natl Acad Sci USA 115: E866–E875, 2018. doi: 10.1073/pnas.1714622115. [DOI] [PMC free article] [PubMed] [Google Scholar]
- 65. Boo S-H, Joo MC, Lee JM, Kim SC, Yu YM, Kim M-S. Association between skeletal muscle mass and cardiorespiratory fitness in community-dwelling elderly men. Aging Clin Exp Res 31: 49–57, 2019. doi: 10.1007/s40520-018-0987-9. [DOI] [PubMed] [Google Scholar]
- 66. Wittekind SG, Powell AW, Opotowsky AR, Mays WW, Knecht SK, Rivin G, Chin C. Skeletal muscle mass is linked to cardiorespiratory fitness in youth. Med Sci Sports Exerc 52: 2574–2580, 2020. doi: 10.1249/MSS.0000000000002424. [DOI] [PubMed] [Google Scholar]
- 67. Henningsen J, Rigbolt KT, Blagoev B, Pedersen BK, Kratchmarova I. Dynamics of the skeletal muscle secretome during myoblast differentiation. Mol Cell Proteomics 9: 2482–2496, 2010. doi: 10.1074/mcp.M110.002113. [DOI] [PMC free article] [PubMed] [Google Scholar]
- 68. Robbins JM, Peterson B, Schranner D, Tahir UA, Rienmuller T, Deng S, Keyes MJ, Katz DH, Beltran PMJ, Barber JL, Baumgartner C, Carr SA, Ghosh S, Shen C, Jennings LL, Ross R, Sarzynski MA, Bouchard C, Gerszten RE. Human plasma proteomic profiles indicative of cardiorespiratory fitness. Nat Metab 3: 786–797, 2021. [Erratum in Nat Metab 3: 1275, 2021]. doi: 10.1038/s42255-021-00400-z. [DOI] [PMC free article] [PubMed] [Google Scholar]
- 69. An P, Rice T, Borecki IB, Perusse L, Gagnon J, Leon AS, Skinner JS, Wilmore JH, Bouchard C, Rao DC. Major gene effect on subcutaneous fat distribution in a sedentary population and its response to exercise training: The HERITAGE Family Study. Am J Hum Biol 12: 600–609, 2000. doi:. [DOI] [PubMed] [Google Scholar]
- 70. Ruderman NB, Goodman MN. Regulation of ketone body metabolism in skeletal muscle. Am J Physiol 224: 1391–1397, 1973. doi: 10.1152/ajplegacy.1973.224.6.1391. [DOI] [PubMed] [Google Scholar]
- 71. Bhagavan NV, Ha C-E. Lipids I: fatty acids and eicosanoids. In: Essentials of Medical Biochemistry. Cambridge, MA: Academic Press, Elsevier, 2011, p. 269–297. [Google Scholar]
- 72. Chasis JA, Mohandas N. Erythroblastic islands: niches for erythropoiesis. Blood 112: 470–478, 2008. doi: 10.1182/blood-2008-03-077883. [DOI] [PMC free article] [PubMed] [Google Scholar]
- 73. Bouchard C, Rankinen T, Timmons JA. Genomics and genetics in the biology of adaptation to exercise. Compr Physiol 1: 1603–1648, 2011. doi: 10.1002/cphy.c100059. [DOI] [PMC free article] [PubMed] [Google Scholar]
- 74. Berchtold MW, Brinkmeier H, Muntener M. Calcium ion in skeletal muscle: its crucial role for muscle function, plasticity, and disease. Physiol Rev 80: 1215–1265, 2000. doi: 10.1152/physrev.2000.80.3.1215. [DOI] [PubMed] [Google Scholar]
- 75. Kuo IY, Ehrlich BE. Signaling in muscle contraction. Cold Spring Harb Perspect Biol 7: a006023, 2015. doi: 10.1101/cshperspect.a006023. [DOI] [PMC free article] [PubMed] [Google Scholar]
- 76. Skinner JS, Jaskolski A, Jaskolska A, Krasnoff J, Gagnon J, Leon AS, Rao DC, Wilmore JH, Bouchard C, Study HF; HERITAGE Family Study. Age, sex, race, initial fitness, and response to training: the HERITAGE Family Study. J Appl Physiol (1985) 90: 1770–1776, 2001. doi: 10.1152/jappl.2001.90.5.1770. [DOI] [PubMed] [Google Scholar]
- 77. Ghosh S, Vivar J, Sarzynski M, Sung Y, Timmons J, Bouchard C, Rankinen T. Integrative pathway analysis of a genome-wide association study of V̇O2max response to exercise training. J Appl Physiol (1985) 115: 1343–1359, 2013. doi: 10.1152/japplphysiol.01487.2012. [DOI] [PMC free article] [PubMed] [Google Scholar]
- 78. Holloszy JO, Coyle EF. Adaptations of skeletal muscle to endurance exercise and their metabolic consequences. J Appl Physiol Respir Environ Exerc Physiol 56: 831–838, 1984. doi: 10.1152/jappl.1984.56.4.831. [DOI] [PubMed] [Google Scholar]
- 79. Le Grand F, Jones AE, Seale V, Scime A, Rudnicki MA. Wnt7a activates the planar cell polarity pathway to drive the symmetric expansion of satellite stem cells. Cell Stem Cell 4: 535–547, 2009. doi: 10.1016/j.stem.2009.03.013. [DOI] [PMC free article] [PubMed] [Google Scholar]
- 80. Gros J, Serralbo O, Marcelle C. WNT11 acts as a directional cue to organize the elongation of early muscle fibres. Nature 457: 589–593, 2009. doi: 10.1038/nature07564. [DOI] [PubMed] [Google Scholar]
- 81. Brack AS, Conboy IM, Conboy MJ, Shen J, Rando TA. A temporal switch from notch to Wnt signaling in muscle stem cells is necessary for normal adult myogenesis. Cell Stem Cell 2: 50–59, 2008. doi: 10.1016/j.stem.2007.10.006. [DOI] [PubMed] [Google Scholar]
- 82. Gnoni A, Longo S, Gnoni GV, Giudetti AM. Carnitine in human muscle bioenergetics: can carnitine supplementation improve physical exercise? Molecules 25: 182, 2020. doi: 10.3390/molecules25010182. [DOI] [PMC free article] [PubMed] [Google Scholar]
- 83. Georges B, Le Borgne F, Galland S, Isoir M, Ecosse D, Grand-Jean F, Demarquoy J. Carnitine transport into muscular cells. Inhibition of transport and cell growth by mildronate. Biochem Pharmacol 59: 1357–1363, 2000. doi: 10.1016/s0006-2952(00)00265-3. [DOI] [PubMed] [Google Scholar]
- 84. Schooneman MG, Vaz FM, Houten SM, Soeters MR. Acylcarnitines: reflecting or inflicting insulin resistance? Diabetes 62: 1–8, 2013. doi: 10.2337/db12-0466. [DOI] [PMC free article] [PubMed] [Google Scholar]
- 85. Reuter SE, Evans AM. Carnitine and acylcarnitines: pharmacokinetic, pharmacological and clinical aspects. Clin Pharmacokinet 51: 553–572, 2012. doi: 10.1007/BF03261931. [DOI] [PubMed] [Google Scholar]
- 86. Ramsay RR, Gandour RD, van der Leij FR. Molecular enzymology of carnitine transfer and transport. Biochim Biophys Acta 1546: 21–43, 2001. doi: 10.1016/s0167-4838(01)00147-9. [DOI] [PubMed] [Google Scholar]
- 87. Masuda K, Yamada T, Ishizawa R, Takakura H. Role of myoglobin in regulating respiration during muscle contraction. J Phys Fit Sports Med 2: 9–16, 2013. doi: 10.7600/jpfsm.2.9. [DOI] [Google Scholar]
- 88. Materna SC, Sinha T, Barnes RM, Lammerts van Bueren K, Black BL. Cardiovascular development and survival require Mef2c function in the myocardial but not the endothelial lineage. Dev Biol 445: 170–177, 2019. doi: 10.1016/j.ydbio.2018.12.002. [DOI] [PMC free article] [PubMed] [Google Scholar]
- 89. Potthoff MJ, Wu H, Arnold MA, Shelton JM, Backs J, McAnally J, Richardson JA, Bassel-Duby R, Olson EN. Histone deacetylase degradation and MEF2 activation promote the formation of slow-twitch myofibers. J Clin Invest 117: 2459–2467, 2007. doi: 10.1172/JCI31960. [DOI] [PMC free article] [PubMed] [Google Scholar]
- 90. Esfandi F, Taheri M, Namvar A, Oskooei VK, Ghafouri-Fard S. AFAP1 and its naturally occurring antisense RNA are downregulated in gastric cancer samples. Biomed Rep 10: 296–302, 2019. doi: 10.3892/br.2019.1207. [DOI] [PMC free article] [PubMed] [Google Scholar]
- 91. Zhang J, Park SI, Artime MC, Summy JM, Shah AN, Bomser JA, Dorfleutner A, Flynn DC, Gallick GE. AFAP-110 is overexpressed in prostate cancer and contributes to tumorigenic growth by regulating focal contacts. J Clin Invest 117: 2962–2973, 2007. doi: 10.1172/JCI30710. [DOI] [PMC free article] [PubMed] [Google Scholar]
- 92. Zhang X, Zhou Y, Mao F, Lin Y, Shen S, Sun Q. lncRNA AFAP1-AS1 promotes triple negative breast cancer cell proliferation and invasion via targeting miR-145 to regulate MTH1 expression. Sci Rep 10: 7662, 2020. doi: 10.1038/s41598-020-64713-x. [DOI] [PMC free article] [PubMed] [Google Scholar]
- 93. Chen B, Li Q, Zhou Y, Wang X, Zhang Q, Wang Y, Zhuang H, Jiang X, Xiong W. The long coding RNA AFAP1-AS1 promotes tumor cell growth and invasion in pancreatic cancer through upregulating the IGF1R oncogene via sequestration of miR-133a. Cell Cycle 17: 1949–1966, 2018. doi: 10.1080/15384101.2018.1496741. [DOI] [PMC free article] [PubMed] [Google Scholar]
Associated Data
This section collects any data citations, data availability statements, or supplementary materials included in this article.
Supplementary Materials
Supplemental Fig. S1 https://doi.org/10.6084/m9.figshare.23706057.v1.
Supplemental Fig. S2 https://doi.org/10.6084/m9.figshare.23706060.v1.
Supplemental Fig. S3 https://doi.org/10.6084/m9.figshare.23706063.v1.
Supplemental Tables S1–S13: https://doi.org/10.6084/m9.figshare.23706054.v1.
Data Availability Statement
Data will be made available upon reasonable request.