

Abstract
Ultrasonography is widely used to screen thyroid tumors because it is safe, easy to use, and low-cost. However, it is simultaneously affected by speckle noise and other artifacts, so early detection of thyroid abnormalities becomes difficult for the radiologist. Therefore, various researchers continuously address the limitations of sonography and improve the diagnosis potential of US images for thyroid tissue from the last three decays. Accordingly, the present study extensively reviewed various CAD systems used to classify thyroid tumor US (TTUS) images related to datasets, despeckling algorithms, segmentation algorithms, feature extraction and selection, assessment parameters, and classification algorithms. After the exhaustive review, the achievements and challenges have been reported, and build a road map for the new researchers.
Keywords: Thyroid nodule, Despeckling, Segmentation, CAD system
Introduction
Thyroid nodules have been among the most common nodular diseases identified in adults during the past three decades [1–3]. It has become a serious issue affecting people of all ages, so finding a solution is essential [4]. It is a common thyroid issue that is primarily benign but a lump in the thyroid nodule caused by abnormal cell growth [5–8]. Ultrasound (US) imaging modality often identifies thyroid abnormalities, and it is considered the first screening test over other medical imaging [9]. The texture patterns of the thyroid tumors in the US images overlap, and clear discrimination is challenging even for an expert due to speckle noise [10, 11]. As a result, researchers have attempted to design various CAD (Computer Aided Diagnosis) system based on machine learning in their diagnosis by clear discrimination between benign and malignant tissue.
In the present study, various CAD systems designed by researchers using machine learning (ML) are carefully reviewed for TTUS (Thyroid Tumor US) images. In the present, various design approaches available in the literature for CAD systems include datasets, despeckling filters, segmentation algorithms, feature extraction and selection, assessment parameters, and classification algorithms [21, 24–104]. The present study carefully selected and reviewed eighty-eight (88) research articles. The review summarizes the recent progress in designing the ML-based CAD system for TTUS images and research directions that could be explored.
The criteria used to determine whether a research paper should be included or not in the review are as follows: (a) research article should only be done on B-mode TTUS images (the combination of modality or multiple images has been excluded like (mammogram + ultrasound), (CT + ultrasound), (MRI + ultrasound), (b) research articles should be in the English language, and (c) research articles should be from the 1984–2022. (d) The articles must be focused on the classification of thyroid lesions using ML. The criteria used to determine whether a research article should be excluded or included in the exhaustive survey are shown in Fig. 1.
Fig. 1.

Criteria used to determine whether a research article should be excluded or included in the exhaustive survey.
Accordingly, denoising (pre-processing), segmentation, and classification algorithms based on machine learning are covered in this work. These steps represent the major fundamental architectures to design ML-based CAD system for TTUS images. As a result, understanding these network topologies is important to preparing for future state-of-the-art methodologies to develop CAD systems for the characterization of thyroid tumors.
Selection of benchmark TTUS image datasets
Benchmark TTUS image datasets used by the different researchers in their studies are summarized in Fig. 2.
Fig. 2.

Benchmark TTUS image datasets used by the different researchers in their studies
From Fig. 2, it can be observed that the TTUS image datasets used for thyroid nodule classification based on ML are divided into two types: (a) publically available and (b) private datasets collected by investigators from the hospital or university data. Over the last ten years, two benchmark databases have been made publically available for researchers for use in the design of CAD system-based ML: (a) Digital Database of Thyroid Ultrasound Images (DDTI), available at http://cimalab.intec.co [12] and (b) ultrasoundcases. Info [13]. TTUS images are available online, and an experienced radiologist marks tumor contours. Sample images of thyroid lesions based on TI-RADS (Thyroid Imaging-Reporting and Data System) with tumor characteristics are described in Fig. 3.
Fig. 3.

Sample images of thyroid lesions based on TIRADS with tumor characteristics
The researchers have adopted a standard methodology to develop a CAD system using ML described below:
The standard methodology adopted by the different researchers to design CAD system for TTUS images based on ML
The standard methodology adopted by the different researchers to design a CAD system using TTUS images based on ML is shown in Fig. 4.
Fig. 4.
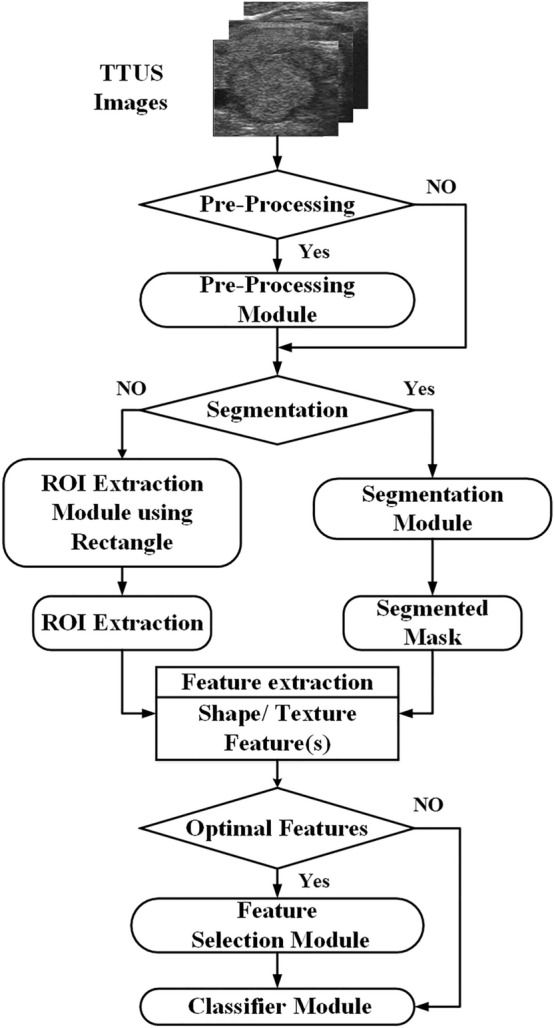
The standard methodology adopted by the different researchers to develop CAD systems using TTUS images
The exhaustive literature review of ML-based CAD system development using TTUS images is explained in Fig. 5.
Fig. 5.

The exhaustive literature review of ML-based CAD system development using TTUS images
The exhaustive literature review of ML-based CAD system development using TTUS images is as follows:
A comprehensive review of the study's findings on the different ML-based CAD systems using the computer-assist segmentation algorithm
A comprehensive review of the study's findings on the different ML-based CAD systems using the computer-assist segmentation algorithm is tabulated in Table 1.
Table 1.
A comprehensive review of the study's findings on the different ML-based CAD systems using the computer-assist segmentation algorithm
| Investigator | Year | No. of images | Pre-processing algorithm | Segmentation algorithm | Feature(s) | Feature selection algorithm | Classifier |
|---|---|---|---|---|---|---|---|
| (a) A Machine learning-based brief exhaustive literature review for thyroid tissue classification using original TTUS images without segmentation | |||||||
| M. Khairalseed et al. [105] | 2022 | 32 | – | – | TF | TA | |
| R. Srivastava et al. [106] | 2022 | 295 and 654 | – | – | TF | ANN-SVM | |
| M. Khairalseed et al. [107] | 2022 | 32 | – | – | TF | TA | |
| X. Keutgen et al. [108] | 2022 | 302 | – | – | RF | Bayesian | |
| (b) A Machine learning-based brief exhaustive literature review for thyroid tissue classification using original TTUS images with segmentation | |||||||
| G. Mailloux et al. [25] | 1986 | 10 | – | CM | TF | – | TA |
| M. Savelonas et al. [27] | 2008 | 173 | VBAC | MSF | – | KNN | |
| M. Savelonas et al. [28] | 2009 | 171 | – | VBAC | MSF | – | KNN, SVM |
| Jieming Ma et al. [29] | 2010 | 98 | – | KMC | MSF | PCA | SVM_BP & MGF |
| A. Prochazka et al. [26] | 2019 | 40 | – | OM | TF | – | RF, SVM |
| (c) A Machine learning-based brief exhaustive literature review for thyroid tissue classification using pre-processed TTUS images with segmentation | |||||||
| G. Mailloux et al. [66] | 1984 | H-10 | MM Filter | CM | TF | TA | |
| J Seabra et al. [88] | 2009 | 90 | CE | ACM, LS, GC | TF & MSF | PCA | MAP |
| S. Tsantis et al. [89] | 2009 |
LR-54 HR-31 |
Wavelet | Multi-Scale Model | TF & MSF | LOO-Leave one Out | SVM |
| C. Chang et al. [74] | 2010 | 61 | MF & HE | DT | TF | – | SVM |
| Chuan-Yu Chang et al. [68] | 2010 |
N-45 G-45 |
CE | AS | TF | – | SVM |
| D. Selvathi et al. [67] | 2011 |
AB-30 N-20 |
AWMF | SVM & ELM used | TF | – | SVM |
| Ioannis Legakis et al. [83] | 2011 | 142 | CE | ACM | TF & MSF | – | SVM |
| E. Keramidas et al. [69] | 2012 | 118 | CE | TBD (Active Contour) | TF | – | SVM |
| Nikita Singh et al. [71] | 2012 |
B-5 M-8 |
HE | ACRB | TF | – | SVM |
| Nikita Singh et al. [84] | 2012 |
M-8 B-5 |
CE | ACM | TF & MSF | – | SVM |
| P. Dhaygude et al. [86] | 2013 |
B-8 M-8 |
MF & HE | LS | TF & MSF | – | ANN |
| Gireesha H M et al. [75] | 2014 |
B-30 M-10 |
ADF | Watershed | TF | – | SVM |
| Priti Dhaygude et al. [85] | 2016 | - | MF & HE | LS | TF & MSF | ANN | |
| Y. Chang et al. [78] | 2016 |
B-30 M-29 |
ADF | ACM | TF | – | SVM |
| H. Nugroho et al. [70] | 2016 |
Cyst-25 Solid-11 |
MF | ACWE | TF | – | MLP |
| Qin Yu et al. [30] | 2017 | 610 & 50 | – | ACRB | TF & MSF | – | SVM |
| H. Nugroho et al.[73] | 2017 |
32-an 58-iso 60-hypo 56-mh |
AWMF | ACRB & Morphological | TF | IGRF | MLP |
| J. Saraf et al. [21] | 2017 | B-7, M-2 | CE and | Canny | TF | – | ANN |
| Zulfanahri et al. [81] | 2017 |
B-61 M-104 |
MF | ACWE & Morphological | MSF | – | SVM |
| H. Nugroho et al. [82] | 2017 |
64-SM 80-IM |
AMF & SRBF | ACM | MSF | – | SVM |
| A. Ardakani et al. [87] | 2018 |
42-Hypo 42-Hyper |
HF | ACM | TF & MSF | – | SVM |
| R.Vanithamani et al. [72] | 2018 |
B-22 M-23 |
SRAD | FCM | TF | – | SVM |
| U. Snekhalatha et al. [76] | 2018 |
N-30 AB-30 |
GF | PCA | TF | – | BP |
| Prabal poudel et al. [77] | 2019 | Two Data Set | CWT | AS | TF | – | SVM, ANN & RFC |
| V. V. Vadhiraj et al. [79] | 2021 |
B-33 M-66 |
MF | Thresholding | TF | – | SVM |
| X. A. Kesarkar et al. [80] | 2021 |
B-19 M-46 |
HE | SAC | TF | PCA | ANN |
| Poornima D et al. [109] | 2022 | 120 | Kaun Filter | ARKFCM | TF | Bayes Net | |
| F. Zhang et al. [110] | 2022 | 450 | HWGF | – | TF | AdaBoost | |
Note - an anechoic, iso isoechoic, hypo hypoechoic, mh markedly hypoechoic, B Benign, M Malignant, SM smooth margin, IM Irregular Margin, LR low risk, HR High Risk, N Normal, G Grave, HT Hashimoto, TN Thyroid Nodule, PT Patients, N Normal, HO Hoshimoto, C Cance, NC Not Cancer, Pre-processing Method: MM Filter Mean & Mode filter, SRAD Speckle-Reducing Anisotropic Diffusion, AWMF Adaptive Weighted Median Filter, CE Contrast Enhancement, MF Median Filter, HE Histogram Equalization, ADF Anisotropic Diffusion Filter, GF Gaussian Filter, CWT Continuous Wavelet Transformation, BPDHE Brightness Preserving Dynamic Fuzzy Histogram Equalization, SRBF Adaptive Speckle Reducing Bilateral Filtering, AMF Adaptive Median Filter, HF Hybrid Filters, HR High Resolution, WTMM Wavelet Transform Modulus Maxima, Segmentation Algorithm: CM Clustering Method, OM Otsu Method, VBAC Variable Background Active Contour Model, KMC K-means Clustering, ACRB Active Contour with Region Based, AS Automatic Segmentation, TBD thyroid Boundary Detection, ACWE Active Contours without Edges, FCM Fuzzy, DT Decision-Tree, ACM Active Contour Model, SAC Snake Active Contour, LS level set, GC Graph cut, Classifier- SVM_BP Support Vector Machine with biased Penalties, ELM Extreme Learning-Machine, RF Random_Forest, MLP Multi-Layer-Perceptron, MAP Maximum a Posteriori, LoR Logistic regression, CoP Comparison of parameters, SPSS statistical Package for the Social Sciences, L,N,Q-DA Linear, Normal and Quadratic-Discriminant Analysis, GBT Gradient-Boosted Trees, DT Decision Tree, QDA Discriminant Analysis Feture Extraction selection, TA Texture Analysis, TF Texture Feature, MSF Morphological Shape Feature, mRMR Minimal Redundancy-Maximum Relevance, SFFS Sequential Floating Forward Selection, IGRF Information gain ranking filter, PCA Principal Component Analysis, GA Genatic Algorithm, FR Feature Reduction
From Table 1, it is noted that most of the studies used linear texture feature extraction methods. It is concluded that the combination of texture and morphological features are computed in very few research articles. It is concluded that median filer, adaptive weighted median, and anisotropic diffusion filters have been widely used as despeckling algorithms, while researchers use histogram equalization and contrast enhancement as enhancement methods. It is also noted that the researchers more commonly used active contour segmentation in their studies.
A comprehensive review of the study's findings on the different ML-based CAD systems using the manually marked tumor by the radiologist
A comprehensive review of the study's findings on the different ML-based CAD systems using the manually marked tumor by the radiologist is shown in Table 2.
Table 2.
A comprehensive review of the study's findings on the different ML-based CAD systems using the manually marked tumor by the radiologist.
| Investigator(s) | Year | Number of images | Pre-processing Algorithm (s) |
Features | Feature Selection algorithm(s) | Classifier |
|---|---|---|---|---|---|---|
| (a) A Machine learning-based brief review for thyroid tissue classification using original TTUS images | ||||||
| R. Sara et al. [58] | 2001 | HT-20, N-17 | – | TF | – | Bayes |
| D. Smutek et al. [57] | 2003 | HT-60. N-39 | – | TF | FR | Bayes |
| G. Mazziotti et al. [59] | 2003 | HT-44, N-45 | – | TF | t Test | NN |
| S. Tsantis et al. [35] | 2005 | LR-78, HR-42 | – | TF | – | SVM |
| S. Catherine et al. [53] | 2006 | 80 | – | TF | PCA | – |
| Keramidas et al. [40] | 2007 | 39 | – | TF | – | KNN |
| M. Bastanfard et al. [61] | 2007 | HT-754, N-651 | – | TF | LDA | KNN |
| M. Savelonas et al. [65] | 2007 | N& TN-66 | – | MSF | – | SVM |
| Keramidas et al. [39] | 2008 | 75 | – | TF | – | SVM |
| D. Iakovidis et al. [42] | 2008 | 65 | – | TF | – | SVM |
| D. Iakovidis et al. [43] | 2010 | 250 | – | TF | – | SVM |
| S. Chen et. al. [33] | 2010 | 61 | – | TF | T Test | SVM |
| C. Chang et al. [34] | 2010 | 76 with 6 classes | – | TF |
F-score and T-test |
SVM |
| M. Lyra et al. [54] | 2010 | N-12, Hypo-28 | – | TF | PCA | LoR |
| Jianrui Ding et al. [31] | 2011 | B-69, M-56 | – | TF | – | SVM |
| J. Ding et al. [55] | 2011 | B-69, M-56 | – | TF | mRMR | SVM |
| Si Luo et al. [64] | 2011 | B-82, M-16 | – | MSF | PCA | LDA |
| U. Acharya et al. [41] | 2011 | B-400, M-400 | – | TF | DWT | KNN |
| U. R. Acharya et al. [48] | 2011 | B-10, M-10 | – | TF | DWT | AdaBoost |
| D. Bibicu et al. [44] | 2013 | N-20, TN-20 | – | TF | Z & T test | SPSS |
| S. Kale et al. [50] | 2013 | NC-37, C-48 | – | TF | – | SVM |
| S. Kale et al. [52] | 2013 | C-48, NC-37 | – | TF | – | GBT |
| A. Ardakani et al. [46] | 2014 | B-26, M-34 | – | TF | L&N DA | NN |
| S. Kim et al. [37] | 2015 | B-444, M189 | – | TF | T or Chi Test | CoP |
| S. Nam et al. [56] | 2015 | B-431, M-148 | – | TF | PCA | SAS |
| A. Ardakani et al. [23] | 2015 | B-26, M-44 | – | TF | PCA | 1-NN |
| Z. Omiotek et al. [60] | 2015 | HT-85, N-54 | – | TF | – | MLP- |
| K. Bhatia et al. [32] | 2016 | B-89, M-16 | – | TF | – | LoR |
| Nanda S. et al. [49] | 2017 | B-30, M-30 | – | TF | – | SVM |
| Li Dandan et al. [36] | 2018 | N-60, G-60, HT-60 | – | TF | mRMR | SVM |
| C. Chang et al.[45] | 2018 | 302 & 468 | – | TF | SFFS | SVM |
| A. Ardakani et al. [51] | 2018 | N-137, TN-137 | – | TF | Fisher + POE | L&NDA |
| U. Raghavendra et al. [47] | 2018 | 345 & -344 | – | TF | PSO | SVM |
| Li Bi et al. [38] | 2019 | N-300, B-100, M-100 | – | TF | – | LoR |
| C. Liu et al. [62] | 2019 | B-59, M-72 | – | TF | PCA | ANN |
| A. Prochazka et al. [104] | 2019 | M = 20, B-40 | – | TF | Wilcoxon | RF (acc-95%) |
| N. Aboudi et al. [63] | 2020 | B-372, M-75 | – | TF | RASER | RF |
| (b) A Machine learning-based brief review for thyroid tissue classification using pre-processed TTUS images | ||||||
| S. Tsantis et al. (2004) [103] | 2004 | LR-78, HR-42 | De-noising | TF & MSF | – | SVM |
| S. Tsantis et al. (2006) [101] | 2006 | 40 | WTMM | MSF | DWT | NN |
| S. Katsigiannis et al. (2010) [92] | 2010 | N-100, TN-100 | CE | TF | SFFS | SVM |
| U. R. Acharya et al. (2011) [90] | 2011 | B-10, M-10 | CE & HR | TF | t Test | SVM |
| R. Koprowski et al. (2012) [99] | 2012 | N-236, HO-288 | MF | TF | – | QDA |
| U. Acharya et al. (2012) [95] | 2012 | B-10, M-10 | CE | TF | DWT | KNN |
| U. Acharya et. al. (2012) [100] | 2012 | B-1300, M-1300 | CE | TF | t Test | PNN_GA |
| U. Acharya et al. (2013) [93] | 2013 | B-10 × 40,M-10 × 40 | CWT | TF | t Test | Fuzzy |
| Sheeja Agustin et al. (2013) [96] | 2013 | N-5, AB-20 | AMF | TF | – | NN |
| U. R. Acharya et al. (2013) [97] | 2013 | N-100, AB-100 | CE | TF | t Test | SVM |
| Gesheng Song et al. (2014) [91] | 2014 | B-76, M-79 | MF | TF | – | LoR |
| J. Chen. et al. (2016) [102] | 2016 | – | CE | TF & MSF | – | NN |
| U. Acharya et al. (2016) [94] | 2016 | B-211, M-31 | CE | TF | Chi-Square | DT |
| A. Nugroho et al. (2016) [98] | 2016 | Cyst-41, Solid-31 | MF | TF | – | MLP |
From Table 2, it is observed that two studies classify thyroid nodules into three classes [36, 38], one study classified them into five and six classes [33, 34], while other studies reported binary classification. It is also noted that very few works have been carried out with a combination of texture and morphological features in manual segmentation. It is concluded that the Contrast enhancement, Median filter, wavelet transform modulus maxima (WTMM), and CWT methods are used as the pre-processing algorithm.
Distribution of ML-based studies used by various researchers for CAD system design with TTUS images
The distribution of ML-based studies used by various researchers for CAD system design with TTUS images is shown in Fig. 6.
Fig. 6.
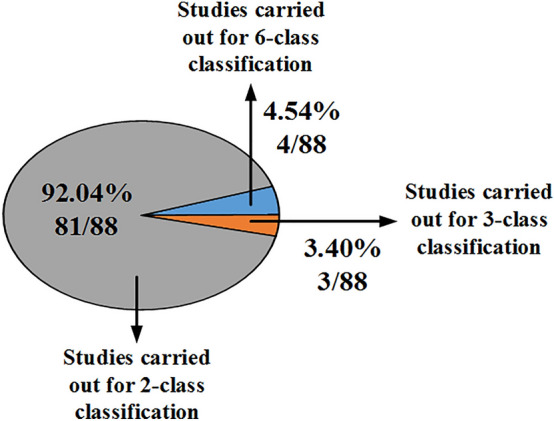
The distribution of ML-based studies used by various researchers for CAD system design with TTUS images
From Fig. 6, it has been observed that most studies done for the characterization of thyroid tumors were done for binary. The distribution of the ML-based studies carried out for TTUS image characterization based on image type, the segmentation methods used, and the extracted features are shown in Fig. 7.
Fig. 7.

The distribution of the ML-based studies carried out for TTUS image characterization based on image type, the segmentation methods used, and the variety of features extracted
From Fig. 7, original TTUS images were used in 57.95% of the studies, whereas pre-processed TTUS images were used in 42.05%. Most research uses manual segmentation to recover the tumor region from raw US images, although computer-assisted segmentation approaches have been used more frequently for pre-processed images.
From the original US images, segmented using manual methods, texture features are most prominently used for feature extraction, while for original images, segmented using computer-assisted techniques. It is found that texture and morphological features studies have not been carried out and have more potential in the future. Computer assists segmented using texture features using pre-processed images have been widely computed. Most studies have computed manually segmented using texture features with pre-processed images for characterization purposes.
Observation and various methods used by the different researchers to design ML-based CAD systems for TTUS image characterization
The literature shows that different pre-processing, segmentation of RoI, feature extraction, selection, and classifiers are used to develop the CAD system to characterize thyroid tumors using machine learning. The brief description is as follows:
Pre-processing module used by the different researchers to design ML-based CAD system for TTUS image characterization
The pre-processing module used by the different researchers to design CAD system based on ML for thyroid tumor characterization can be divided into two categories: (a) Despeckling and (b) enhancement methods. It can be concluded that very few despeckling filters and enhancing methods have been applied to pre-process TTUS images. Pre-processing algorithms used by the different researchers to design ML-based CAD systems for TTUS images characterization are represented in Fig. 8.
Fig. 8.

Pre-processing module used by the different researchers to design CAD system for TTUS image characterization using machine learning. Red-marked shaded pre-processing algorithms have been applied to the TTUS images before ML-based classification
It is observed that SRAD, AWMF, MF, ADF, GF, SRBF, AMF, and hybrid despeckling filters have been widely used as pre-processing algorithms before the characterization of TTUS images. It is also concluded that the enhancement methods have degraded the quality of TTUS images.
Segmentation algorithms used by different researchers to design ML-based CAD systems for TTUS image characterization
The segmentation module used by the different researchers to design CAD system based on ML for thyroid tumor characterization can be divided into two categories: (a) manual marked and (b) computer-assisted segmentation methods. The background has been removed from the TTUS images and generated the region of interest (ROIs) for further analysis. A comprehensive review of the segmentation algorithms used by the different researchers to design ML-based CAD systems for TTUS images characterization is shown in Fig. 9.
Fig. 9.

A comprehensive review of the Segmentation module used by the different researchers to design ML-based CAD system for TTUS image characterization. Blue color shaded methods have already been applied to segment thyroid US images. MRF Markov random field, CRF Cumulative random field
Figure 9 shows that thyroid ultrasound images were previously segmented using manual and computer-assisted methods. Manual methods involve cropping a rectangular ROI from the image or extracting the ROIs based on the radiologist's initial contour. Thresholding, morphological, clustering, classifier, and other methods can be categorized into computer-assisted segmentation algorithms [14].
A summary of each segmentation algorithm(s) with their merit and demerit is shown in Table 3.
Table 3.
A summary of each segmentation algorithm(s) with their merit and demerit
| Algorithm(s) | Merit(s) | Demerit(s) |
|---|---|---|
| Active Contour [15] |
Provide rounded and closed outlines. Procure object boundary precision out to the pixel level. |
It is not capable of segmenting the nearest objects. Need of (a) initial contour, (b) proper parameters, and (c) long runtime When the image size is too large, these methods work slowly and require proper initialization. |
| Watershed [16] |
It provides closed contours & requires low computation time. Fast, Simple & Intuitive Method. Capable of producing a complete visual segmentation into separate regions. |
It produces excessive over-segmentation. Over-segmentation refers to over-cutting. Under-segmentation, also commonly known as leaking. |
| Region Growing [17] |
Correctly separate the regions. Precise edges with good segmentation results with seed points. |
Costly in terms of computation. Noise sensitivity. |
| Thresholding [17] |
Quicker Execution. Converge more quickly, allowing for a significantly lower limit. With a decent background-to-foreground contrast ratio, Automatic Thresholding can perform well. |
A less clear boundary between background and foreground. Threshold values can be determined based on the image histogram's two well-separated peaks. The image must be taken in ideal lighting with low glare. |
| Graph Cut [18] |
High accuracy & good performance. Applied in highly textured images, noisy images, color images. Flexible and Multiple objects can be segmented simultaneously with No initialization required. |
Restricted to binary segmentation. It is restricted to a particular class of energy functional. Metrication artifacts on standard grids. |
| Classification Based [19] |
Several researchers have used classifier-based algorithms such as KNN, SVM, and NN, which are essential and straightforward. It handles noisy images. Quick and accurate. |
Learning time is slow. Time-consuming and complex. Sensitive and computational costs are high. |
Feature extraction and selection modules used by the different researchers to design ML-based CAD systems for TTUS image characterization
The textural and shape characteristics of various thyroid cancers on US images are evaluated using the mathematical descriptor called features taken from the segmented images. The Feature extraction and selection modules used by the different researchers to design ML-based CAD systems for TTUS images characterization are represented in Fig. 10.
Fig. 10.

The Feature extraction and selection modules used by the different researchers to design ML-based CAD systems for TTUS image characterization. Note: The shaded area indicates that these methods have already been applied to the TTUS images
Figure 10 shows that the researchers used textures and morphological features extraction to design an efficient ML-based CAD system for TTUS image characterization. The texture feature can be calculated using linear or nonlinear methods [20, 21]. The linear algorithms can also be divided into methods for quantitative, signal analysis, and transform domains. This category includes the following features: (a) first Order, i.e., average or mean, standard deviation, etc., (b) GLCM feature, (c) Features based on GLRLM (run length), (d) other statistical methods based on neighborhood tone difference, statistical and edge-based features, (e) Method based on signal processing: Law's mask, have specified mask lengths of 3, 5, 7, and 9, is one of the most used methods for detecting levels, edges, and waves in this category and (f) based on the transformation method, the image is initially transformed to the frequency domain after applying some multi-resolution scheme, as the vision system of humans can process the images in this category. LBP (Local Binary Pattern), SIFT, SURF, and GIST are preferred in nonlinear techniques.
The shape and boundary of tumors can be used to evaluate the morphological features. Area, perimeter, convexity, and other statistical properties are some of the properties that describe the shape and margin of tumors. The feature vectors derived from ultrasound images using various feature extraction methods may often contain redundant features that provide little or no information for thyroid tumor characterization. The performance of the CAD system sustains from these redundant features. The advantages of feature selection are reduced training times, better classification models, and less overfitting [20].
Researchers have used various techniques, such as PCA, GA, LDA, etc., to reduce the dimensionality of features in thyroid ultrasound images [22, 23].
Classification module used by the different researchers to design ML-based CAD systems for TTUS image characterization
Using feature classification algorithms, researchers classify TTUS images into various classes according to the information given by the extracted features. The classification module used by the different researchers to design ML-based CAD systems for TTUS images characterization is shown in Fig. 11.
Fig. 11.
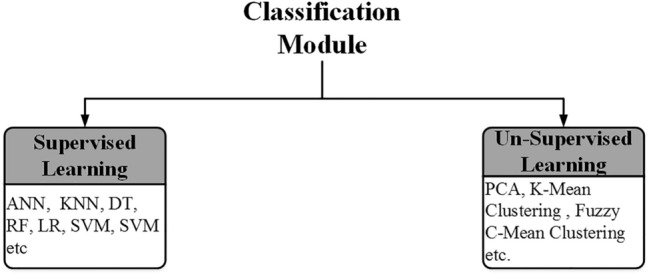
The classification module used by the different researchers to design ML-based CAD systems for TTUS images characterization
SVM kNN, ANN classifier, and other supervised learning approaches and their variants are popular in characterizing thyroid tumors [24]. Few unsupervised learning methods, such as fuzzy and clustering methods, are used for thyroid tumor characterization by the researchers.
Performance evaluation of the classification module used by the different researchers to design ML-based CAD systems for TTUS image characterization
The performance evaluation of the classification module used by the different researchers to design ML-based CAD systems for TTUS images characterization is described in Fig. 12.
Fig. 12.

The performance evaluation of the classification module used by the different researchers to design ML-based CAD systems for TTUS image characterization.
Note: TP True Positive, TN True Negative, FP False Positive, FN False Negative
The most often used measures for evaluating classifier effectiveness during the analysis of thyroid ultrasound images are precision (Pr), specificity (Sp), accuracy (ACC), etc. The AUC is used for thyroid ultrasound image characterization in ranking-type metrics.
Achievements in the development of CAD system for the characterization of thyroid tumors using ML-based methodologies
Tables 1, 2 highlights that researchers used original or pre-processed TTUS images with either manual or computer-assisted segmentation for differential diagnosis. The researcher has considered texture, morphological, or both features for extracting the characteristics from the segmented images. It is concluded that SVM, PNN, ANN, and KNN are the most widely used to classify thyroid ultrasound images. The following achievement is as follows.
For original images segmented using computer-assisted methods, A. Prochazka et al. [26] achieved an accuracy of 94.64% using texture features.
For the original US images segmented manually, U. R. Acharya et al. [48] proposed a design using texture features and the AdaBoost classifier, achieving an accuracy of 100%.
Studies proposed by D. Selvathi et al. [67] and C. Chang et al. [68] recorded the accuracy of 100% by texture features using an SVM classifier for pre-processed TTUS images segmented by the computer-assist algorithm.
For pre-processed images segmented manually, U. Acharya et al. [100] proposed a study based on combining texture features using the PNN_GA classifier, reporting an accuracy of 99.81%.
Challenges ahead in thyroid tumor characterization using ML-based methodologies
The literature shows that most research used a fusion of texture features (linear) and conventional shape features. The following challenges face the development of the CAD system to characterize thyroid tumors using machine learning.
Only five studies have reported using nonlinear local texture feature extraction methods like LBP, while three have used Zernike moments-based morphological feature extraction.
However, no study has reported combining linear and nonlinear texture and morphological features to classify TTUS images. Therefore, evaluating the efficacy of various nonlinear texture features, such as LBP, HOG, SIFT, Zernike, etc., is essential to consider potential future directions.
Another work direction can be combining texture and morphological features with linear and nonlinear shape and margin features.
Accordingly, Designing CAD systems has been a critical field of medical research. It analyzes medical images of the patient's status using machine learning algorithms, which provide decision-making about the patient's illness by the doctors or experts. A machine learning algorithm is simply a model containing various sources, including data collecting, storage, data retrieval, data processing, inherent random, etc. So, machine learning models are essential for the classification of medical images. The recent success of machine learning has prompted new research and development projects to enhance CAD functionality and develop CAD for various other challenging clinical applications. The potential and challenges of developing CAD systems using machine learning technology are discussed in the current work. The considerations needed for future implementation of CAD systems using machine learning in the clinical practice.
Future trends and direction for new research in the field of designing CAD tools using machine learning for TTUS images
In the first approach, optimal despeckling algorithms can be used to smoothen the medical image's homogenous area while preserving the edges of the lesion boundary. Different segmentation models can segment the thyroid lesion from original and pre-processed TTUS images. It is essential to pre-process the tumor images with suitable despeckling algorithm and segmentation to improve classification accuracy. Segment these images without affecting the diagnostic information to improve the characterization of lesions. Accordingly, a feature extraction algorithm based on textural and morphological features can classify thyroid lesions using original and pre-processed segmented TTUS images. Therefore, many researchers have shown massive interest in designing an efficient CAD based on machine learning algorithms for thyroid tumor classification.
In the second approach, handcraft features (Textural and morphological features) can be combined, or fusion is classified using LSTM, conventional classifier, i.e., SVM, PNN, KNN, random forest, etc., and a combination of autoencoder (AE), LSTM, and DBN (Deep Belief Network).
Another potential advancement could be shared feature learning, combining medical images from various modalities like MRI and ultrasound.
Classification of thyroid tumors using machine learning based on features extracted from deep learning-based self-design or pre-trained model. The convention-based classifier, namely SVM, PNN, KNN, etc., can classify thyroid tumors.
Conclusion
A comprehensive review of the studies was conducted to design a CAD system to diagnose thyroid tumors using ultrasound images. The review is restricted to the ML techniques adopted to segment and classify thyroid tumors. It summarizes the results obtained in each study. These CAD systems can assist the radiologist in routine clinical practice for interpretation, thus acting as a second opinion tool for improving diagnostic accuracy. This paper can be helpful to various researchers designing a CAD system for TTUS images in choosing the direction of their investigation, selecting the different methods, and comparing the performance of the existing techniques as per their requirements.
Acknowledgements
The authors would like to thanks Dr. Jyotsna Sen, Sr. Professor, department of radiodiagnosis, Pt. B. D. Sharma Postgraduate Institute of Medical Sciences, Rohtak, for stimulating discussions regarding different sonographic characteristics exhibited by various types of benign and malignant thyroid tumors. The first author acknowledge “National Project Implementation Unit (NPIU), a unit of Ministry of Human Resource Development, Government of India” for the financial assistantship through TEQIP-III project at Deenbandhu Chhotu Ram University of Science and Technology, Murthal, Haryana, India.
Funding
The authors have not disclosed any funding.
Data availability
Data available on request due to privacy/ethical restrictions.
Declarations
Conflict of interest
The authors declare that they have no conflict of interest.
Footnotes
Publisher's Note
Springer Nature remains neutral with regard to jurisdictional claims in published maps and institutional affiliations.
References
- 1.Papini E, Monpeyssen H, Frasoldati A, Hegedüs L. 2020 European thyroid association clinical practice guideline for the use of image-guided ablation in benign thyroid nodules. Eur Thyroid J. 2020;9:172–185. doi: 10.1159/000508484. [DOI] [PMC free article] [PubMed] [Google Scholar]
- 2.Di RGC. Good clinical practice advice: thyroid and pregnancy. Int J Gynecol Obstet. 2019;144:347–351. doi: 10.1002/ijgo.12745. [DOI] [PubMed] [Google Scholar]
- 3.Nagataki S, Nyström E. Epidemiology and primary prevention of thyroid cancer. Thyroid. 2002;12:889–896. doi: 10.1089/105072502761016511. [DOI] [PubMed] [Google Scholar]
- 4.Moon W, Baek JH, Jung SL, et al. Ultrasonography and the ultrasound-based management of thyroid nodules: consensus statement and recommendations NODULES. Korean J Radiol. 2011;12:1–14. doi: 10.3348/kjr.2011.12.1.1. [DOI] [PMC free article] [PubMed] [Google Scholar]
- 5.Russ G. Risk stratification of thyroid nodules on ultrasonography with the French TI-RADS: description and reflections. Ultrasonography. 2016;35:25–38. doi: 10.14366/usg.15027. [DOI] [PMC free article] [PubMed] [Google Scholar]
- 6.Chaudhary V, Bano S. Thyroid ultrasound. Indian J Endocrinol Metab. 2013;17:219–227. doi: 10.4103/2230-8210.109667. [DOI] [PMC free article] [PubMed] [Google Scholar]
- 7.Hoang JK, Sosa JA, Nguyen XV, et al. Imaging thyroid disease: updates, imaging approach, and management pearls. Radiol Clin North Am. 2014;53:145–161. doi: 10.1016/j.rcl.2014.09.002. [DOI] [PubMed] [Google Scholar]
- 8.Chung R, Kim D. Imaging of thyroid nodules. Appl Radiol. 2019;48:16–26. doi: 10.37549/AR2555. [DOI] [Google Scholar]
- 9.Zahir ST, Vakili M, Ghaneei A, et al. Ultrasound assistance in differentiating malignant thyroid nodules from benign ones. J Ayub Med Coll Abbottabad. 2016;28:644–649. [PubMed] [Google Scholar]
- 10.Yadav N, Dass R, Virmani J. Despeckling filters applied to thyroid ultrasound images: a comparative analysis. Multimed Tools Appl. 2022 doi: 10.1007/s11042-022-11965-6. [DOI] [Google Scholar]
- 11.Dass R. Speckle noise reduction of ultrasound images using BFO cascaded with wiener filter and discrete wavelet transform in homomorphic region. Procedia Comput Sci. 2018;132:1543–1551. doi: 10.1016/j.procs.2018.05.118. [DOI] [Google Scholar]
- 12.Pedraza L, Vargas C, Narváez F et al (2015) An open access thyroid ultrasound image database. In: 10th Int Symp Med Inf Process Anal 9287:92870W1–6. 10.1117/12.2073532
- 13.(2018) https://www.ultrasoundcases.info/cases/head-and-neck/thyroid-gland/
- 14.Yadav N, Dass R, Virmani J. Objective assessment of segmentation models for thyroid ultrasound images. J Ultrasound. 2022 doi: 10.1007/s40477-022-00726-8. [DOI] [PMC free article] [PubMed] [Google Scholar]
- 15.Poudel P, Illanes A, Sheet D, Friebe M. Evaluation of commonly used algorithms for thyroid ultrasound images segmentation and improvement using machine learning approaches. Hindawi J Healthc Eng. 2018;2018:1–13. doi: 10.1155/2018/8087624. [DOI] [PMC free article] [PubMed] [Google Scholar]
- 16.Kollorz E, Angelopoulou E, Beck M, et al. Bild für die Medizin (Inform aktuell) Berlin, Heidelberg: Springer; 2011. Using power watersheds to segment benign thyroid nodules in ultrasound image data; pp. 124–128. [Google Scholar]
- 17.Prabha DS, Kumar JS. Performance evaluation of image segmentation using objective methods. Indian J Sci Technol. 2016;9:1–8. doi: 10.17485/ijst/2016/v9i8/87907. [DOI] [Google Scholar]
- 18.Guo Y, Jiang SQ, Sun B, et al. Using neutrosophic graph cut segmentation algorithm for qualified rendering image selection in thyroid elastography video. Heal Inf Sci Syst. 2017;5:1–7. doi: 10.1007/s13755-017-0032-y. [DOI] [PMC free article] [PubMed] [Google Scholar]
- 19.Kollorz ENK, Hahn DA, Linke R, et al. Quantification of thyroid volume using 3-D ultrasound imaging. IEEE Trans Med Imaging. 2008;27:457–466. doi: 10.1109/TMI.2007.907328. [DOI] [PubMed] [Google Scholar]
- 20.Kriti, Virmani J, Agarwal R. Effect of despeckle filtering on classification of breast tumors using ultrasound images. Biocybern Biomed Eng. 2019 doi: 10.1016/j.bbe.2019.02.004. [DOI] [Google Scholar]
- 21.Yadav N, Dass R, Virmani J. Deep learning-based CAD system design for thyroid tumor characterization using ultrasound images. Multimed Tools Appl. 2023 doi: 10.1007/s11042-023-17137-4. [DOI] [Google Scholar]
- 22.Virmani J, Kumar V, Kalra N, Khandelwal N. PCA-SVM based CAD system for focal liver lesions using B-mode ultrasound images. Def Sci J. 2013;63:478–486. doi: 10.14429/dsj.63.3951. [DOI] [Google Scholar]
- 23.Ardakani AA, Gharbali A, Mohammadi A. Application of texture analysis method for classification of benign and malignant thyroid nodules in ultrasound images. Iran J Cancer Prev. 2015;8:116–124. doi: 10.7863/ultra.14.09057. [DOI] [PMC free article] [PubMed] [Google Scholar]
- 24.Yadav N, Dass R, Virmani J. Texture analysis of liver ultrasound images. Emergent Converging Technol Biomed Syst Lect Notes Electr Eng. 2022;841:575–585. doi: 10.1007/978-981-16-8774-7_48. [DOI] [Google Scholar]
- 25.Mailloux G, Bertrand M, Stampfler R, Ethier S. Computer analysis of echographic textures in hashimoto disease of the thyroid. J Clin Ultrasound. 1986;14:521–527. doi: 10.1002/jcu.1870140705. [DOI] [PubMed] [Google Scholar]
- 26.Prochazka A, Gulati S, Holinka S, Smutek D. Classification of thyroid nodules in ultrasound images using direction independent features extracted by two-threshold binary decomposition. Technol Cancer Res Treat. 2019;18:1–8. doi: 10.1177/1533033819830748. [DOI] [PMC free article] [PubMed] [Google Scholar]
- 27.Savelonas MA, Maroulis DE, Iakovidis DK, Dimitropoulos N (2008) Computer-aided malignancy risk assessment of nodules in thyroid US images utilizing boundary descriptors. In: Proc - 12th Pan-Hellenic Conf Informatics, PCI 2008. pp 157–160. 10.1109/PCI.2008.44
- 28.Savelonas M, Maroulis D, Sangriotis M. A computer-aided system for malignancy risk assessment of nodules in thyroid US images based on boundary features. Comput Methods Programs Biomed. 2009;6:25–32. doi: 10.1016/j.cmpb.2009.04.001. [DOI] [PubMed] [Google Scholar]
- 29.Ma J, Luo S, Dighe M et al (2010) Differential diagnosis of thyroid nodules with ultrasound elastography based on support vector machines. In: IEEE Int Ultrason Symp Proc. pp 1372–1375. 10.1109/ULTSYM.2010.0348
- 30.Yu Q, Jiang T, Zhou A, et al. Computer-aided diagnosis of malignant or benign thyroid nodes based on ultrasound images. Eur Arch Oto-Rhino-Laryngol. 2017;274:2891–2897. doi: 10.1007/s00405-017-4562-3. [DOI] [PubMed] [Google Scholar]
- 31.Ding J, Cheng H, Ning C, et al. Quantitative measurement for thyroid cancer characterization based on elastography. J Ultrasound Med. 2011;30:1259–1266. doi: 10.7863/jum.2011.30.9.1259. [DOI] [PubMed] [Google Scholar]
- 32.Bhatia KSS. Feasibility study of texture analysis using ultrasound shear wave elastography to predict malignancy in thyroid nodules. Ultrasound Med Bio. 2016;42:1–10. doi: 10.1016/j.ultrasmedbio.2016.01.013. [DOI] [PubMed] [Google Scholar]
- 33.Chen S-J. Classification of the thyroid nodules based on characteristic sonographic textural feature and correlated histopathology using hierarchical support vector machines. Ultrasound Med Biol. 2018;36:2018–2026. doi: 10.1016/j.ultrasmedbio.2010.08.019. [DOI] [PubMed] [Google Scholar]
- 34.Chang C, Chen S, Tsai M. Application of the support-vector-machine-based method for feature selection and classification of thyroid nodules in ultrasound images. Pattern Recognit. 2010;43:3494–3506. doi: 10.1016/j.patcog.2010.04.023. [DOI] [Google Scholar]
- 35.Tsantis S. Development of a support vector machine-based image analysis system for assessing the thyroid nodule malignancy risk on ultrasound. Ultrasound Med Biol. 2005;31:1451–1459. doi: 10.1016/j.ultrasmedbio.2005.07.009. [DOI] [PubMed] [Google Scholar]
- 36.Dandan L, Yakui Z, Linyao D, et al. Texture analysis and classification of diffuse thyroid diseases based on ultrasound images. IEEE Int Instrum Meas Technol Conf. 2018;2018:1–6. [Google Scholar]
- 37.Kim SY, Kim EK, Moon HJ, et al. Application of texture analysis in the differential diagnosis of benign and malignant thyroid nodules: comparison with gray-scale ultrasound and elastography. Am J Roentgenol. 2015;205:W343–W351. doi: 10.2214/AJR.14.13825. [DOI] [PubMed] [Google Scholar]
- 38.Bi L, Shuang Z. Diagnosis of thyroid nodules based on local non-quantitative multi-directional texture descriptor with rotation invariant characteristics for ultrasound image. J Med Syst. 2019;2019:1–10. doi: 10.1007/s10916-019-1373-7. [DOI] [PubMed] [Google Scholar]
- 39.Keramidas EG, Iakovidis D, Maroulis DE (2008) Thyroid texture representation via noise resistant image features thyroid texture representation via noise resistant image features. In: Proc IEEE Symp Comput Med Syst. pp 1–7. 10.1109/CBMS.2008.108
- 40.Keramidas EG, Iakovidis DK, Maroulis D, Karkanis S. Efficient and effective ultrasound image analysis scheme for thyroid nodule detection. ICIAR 2007 LNCS. 2007;4633:1052–1060. [Google Scholar]
- 41.Acharya UR, Faust O, Sree SV, Molinari F, Garberoglio R, Suri JS. Cost-effective and non-invasive automated benign & malignant thyroid lesion classification in 3D contrast-enhanced ultrasound using combination of wavelets and textures : a class of thyroscan TM algorithms. Technol Cancer Res Treat. 2011;10:371–380. doi: 10.7785/tcrt.2012.500214. [DOI] [PubMed] [Google Scholar]
- 42.Iakovidis DK, Keramidas EG, Maroulis D. Fuzzy local binary patterns for ultrasound texture characterization. ICIAR LNCS. 2008;5112:750–759. [Google Scholar]
- 43.Iakovidis DK, Keramidas EG, Maroulis D. Fusion of fuzzy statistical distributions for classification of thyroid ultrasound patterns. Artif Intell Med. 2010;50:33–41. doi: 10.1016/j.artmed.2010.04.004. [DOI] [PubMed] [Google Scholar]
- 44.Bibicu D, Moraru L, Biswas A. Thyroid nodule recognition based on feature selection and pixel classification methods. J Digit Imaging. 2013;26:119–128. doi: 10.1007/s10278-012-9475-5. [DOI] [PMC free article] [PubMed] [Google Scholar]
- 45.Chang C, Tsai M, Chen S (2008) Classification of the thyroid nodules using support vector machines. In: Int Jt Conf Neural Networks. pp 3093–3098
- 46.Ardakani AA, Gharbali A, Mohammadi A. Classification of benign and malignant thyroid nodules using wavelet texture analysis of sonograms. J Ultrasound Med. 2015;34:1983–1989. doi: 10.7863/ultra.14.09057. [DOI] [PubMed] [Google Scholar]
- 47.Raghavendra U, Gudigar A, Maithri M, et al. Optimized multi-level elongated quinary patterns for the assessment of thyroid nodules in ultrasound images. Comput Biol Med. 2018;95:55–62. doi: 10.1016/j.compbiomed.2018.02.002. [DOI] [PubMed] [Google Scholar]
- 48.Acharya UR, Faust O, Sree SV, et al. ThyroScreen system: High-resolution ultrasound thyroid image characterization into benign and malignant classes using novel combination of texture and discrete wavelet transform. Comput Methods Programs Biomed. 2012;107:233–241. doi: 10.1016/j.cmpb.2011.10.001. [DOI] [PubMed] [Google Scholar]
- 49.Nanda S, Sukumar M. Detection and classification of thyroid nodule using Shearlet coefficients and support vector machine. Int J Eng Technol. 2017;6:50. doi: 10.14419/ijet.v6i3.7705. [DOI] [Google Scholar]
- 50.Kale SD, Punwatkar KM. Texture analysis of ultrasound medical images for diagnosis of thyroid nodule using support vector machine. Int J Comput Sci Mob Comput. 2013;2:71–77. [Google Scholar]
- 51.Ardakani AA, Rasekhi A, Mohammadi A, Motevalian E. Differentiation between metastatic and tumor-free cervical lymph nodes in patients with papillary thyroid carcinoma by grey-scale sonographic texture analysis. J Radiol. 2018;83:37–46. doi: 10.5114/pjr.2018.75017. [DOI] [PMC free article] [PubMed] [Google Scholar]
- 52.Kale SD, Punwatkar KM. Texture analysis of thyroid ultrasound images for diagnosis of benign and malignant nodule using scaled conjugate gradient backpropagation training neural network. Int J Comput Eng Manag. 2013;16:33–38. [Google Scholar]
- 53.Catherine S, Maria L, Aristides A, Lambros V. Quantitative image analysis in sonograms of the thyroid gland. Nucl Instrum Methods Phys Res. 2006;569:606–609. doi: 10.1016/j.nima.2006.08.162. [DOI] [Google Scholar]
- 54.Lyra ME, Skouroliakou K, Vasoura E, Antoniou A (2010) Texture Characterization in Ultasonograms of the Thyroid Gland. In: Proc 10th IEEE Int Conf Inf Technol Appl Biomed. pp 1–4. 10.1109/ITAB.2010.5687628
- 55.Ding J, Huang J, Zhang Y (2011) A novel quantitative measurement for thyroid cancer detection based on elastography. In: 4th Int Congr Image Signal Process. pp 1801–1804
- 56.Nam SJ, Yoo J, Lee HS, et al. Quantitative evaluation for differentiating malignant and benign thyroid nodules. J Ultrasound Med. 2016;35:775–782. doi: 10.7863/ultra.15.05055. [DOI] [PubMed] [Google Scholar]
- 57.Smutek D. Image texture analysis of sonograms in chronic inflammations of thyroid gland. Ultrasound Med Biol. 2003;29:1531–1543. doi: 10.1016/S0301-5629(03)01049-4. [DOI] [PubMed] [Google Scholar]
- 58.Radim S, Smutek D, Sucharda P (2001) Systematic construction of texture features for hashimoto's lymphocytic thyroiditis recognition from sonographic images. In: Conf Artif Intell Med Eur. pp 339–348
- 59.Mazziotti G, Sorvillo F, Iorio S, et al. Grey-scale analysis allows a quantitative evaluation of thyroid echogenicity in the patients with Hashimoto’s thyroiditis. Clin Endocrinol (Oxf) 2003;59:223–229. doi: 10.1046/j.1365-2265.2003.01829.x. [DOI] [PubMed] [Google Scholar]
- 60.Omiotek Z, Burda A. Application of selected classification methods for detection of Hashimoto’s thyroiditis on the basis of ultrasound images. Comput Intell Med Biol. 2015 doi: 10.1007/978-3-319-16844-9. [DOI] [Google Scholar]
- 61.Bastanfard M, Jalaeian B, Jafari S. Analysis of sonogram images of thyroid gland based on wavelet transform. Int J Electr Comput Eng. 2007;1:673–676. [Google Scholar]
- 62.Liu C, Xie L, Kong W, et al. Prediction of suspicious thyroid nodule using arti fi cial neural network based on radiofrequency ultrasound and conventional ultrasound: a preliminary study. Ultrasonics. 2019;99:105951. doi: 10.1016/j.ultras.2019.105951. [DOI] [PubMed] [Google Scholar]
- 63.Aboudi N, Khlifa N (2020) Thyroid ultrasound images classification using the shearlet coefficients and the generic fourier descriptor. In: VISIGRAPP 2020 - Proc 15th Int Jt Conf Comput Vision, Imaging Comput Graph Theory Appl, vol. 4. pp 292–298. 10.5220/0008956902920298
- 64.Luo S, Kim EH, Dighe M, Kim Y. Thyroid nodule classification using ultrasound elastography via linear discriminant analysis. Ultrasonics. 2011;51:425–431. doi: 10.1016/j.ultras.2010.11.008. [DOI] [PubMed] [Google Scholar]
- 65.Savelonas MA, Iakovidis DK, Dimitropoulos N, Maroulis D (2007) Computational characterization of thyroid tissue in the radon domain. In: Twent IEEE Int Symp Comput Med Syst 5–8
- 66.Mailloux GE. Texture analysis of ultrasound b-mode images by segmentation. Ultrason Imaging. 1984;6:262–277. doi: 10.1177/016173468400600302. [DOI] [PubMed] [Google Scholar]
- 67.Selvathi D, Sharnitha VVSS (2011) Thyroid classification and segmentation in ultrasound images using machine learning algorithms. In: 2011 Int Conf Signal Process Commun Comput Netw Technol. pp 836–841. 10.1109/ICSCCN.2011.6024666
- 68.Chang C, Liu H, Tseng C. Computer-aided diagnosis for thyroid Graves’ disease in ultrasound images. Biomed Eng Appl Basis Commun. 2010;22:91–99. doi: 10.4015/S1016237210001815. [DOI] [Google Scholar]
- 69.Keramidas EG, Maroulis D, Iakovidis DK. TND: A thyroid nodule detection system for analysis of ultrasound images and videos. J Med Syst. 2012;36:1271–1281. doi: 10.1007/s10916-010-9588-7. [DOI] [PubMed] [Google Scholar]
- 70.Nugroho HA, Rahmawaty M, Triyani Y, Ardiyanto I (2016) Texture analysis for classification of thyroid ultrasound images. In: Int Electron Symp. pp 476–480. 10.1109/ELECSYM.2016.7861053
- 71.Singh N, Jindal A. Ultra sonogram images for thyroid segmentation and texture classification in diagnosis of malignant (cancerous) or benign (non-cancerous) nodules. Int J Eng Innov Technol. 2012;1:202–206. [Google Scholar]
- 72.Vanithamani R, Dhivya R (2018) Thyroid nodule classification in medical ultrasound images. In: Int Conf Soft Comput Pattern Recognit. 10.1007/978-3-319-60618-7
- 73.Nugroho HA, Zulfanahri, Nugroho A (2017) Feature extraction based on laws’ texture energy for lesion echogenicity classification of thyroid ultrasound images. In: Int Conf Comput Control Informatics its Appl Featur. pp 41–46. 10.1109/IC3INA.2017.8251737
- 74.Chang C, Huang H, Chen S. Automatic thyroid nodule segmentation and component analysis in ultrasound images. Biomed Eng Appl Basis Commun. 2010;22:81–89. doi: 10.4015/S1016237210001803. [DOI] [Google Scholar]
- 75.Gireesha HM, Nanda S. Thyroid nodule segmentation and classification in ultrasound images. Int J Eng Res Technol. 2014;3:2252–2256. [Google Scholar]
- 76.Snekhalatha U, Gomathy V. Ultrasound thyroid image segmentation, feature extraction, and classification of disease using feed forward back propagation network. Prog Adv Comput Intell Eng. 2018;563:89–98. doi: 10.1007/978-981-10-6872-0_9. [DOI] [Google Scholar]
- 77.Poudel P, Illanes A, Ataide EJG. Thyroid ultrasound texture classification using autoregressive features in conjunction with machine learning approaches. IEEE Access. 2019;7:79354–79365. doi: 10.1109/ACCESS.2019.2923547. [DOI] [Google Scholar]
- 78.Chang Y, Paul AK, Kim N, et al. Computer-aided diagnosis for classifying benign versus malignant thyroid nodules based on ultrasound images: a comparison with radiologist-based assessments. Med Phys. 2016;43:554–567. doi: 10.1118/1.4939060. [DOI] [PubMed] [Google Scholar]
- 79.Vadhiraj VV, Simpkin A, O’connell J, et al. Ultrasound image classification of thyroid nodules using machine learning techniques. Med. 2021;57:1–18. doi: 10.3390/medicina57060527. [DOI] [PMC free article] [PubMed] [Google Scholar]
- 80.Kesarkar XA, Kulhalli KV (2021) Thyroid Nodule Detection using Artificial Neural Network. In: Proc - Int Conf Artif Intell Smart Syst ICAIS 2021. pp 11–15. 10.1109/ICAIS50930.2021.9396035
- 81.Zulfanahri, Nugroho HA, Nugroho A et al (2017) Classification of thyroid ultrasound images based on shape features analysis. In: 10th Biomed Eng Int Conf 2017-Janua:1–5. 10.1109/BMEiCON.2017.8229106
- 82.Nugroho HA, Frannita EL (2017) Classification of Thyroid Nodules Based on Analysis of Margin Characteristic. In: Int Conf Comput Control Informatics its Appl. pp 47–51. 10.1109/IC3INA.2017.8251738
- 83.Legakis I, Savelonas MA, Maroulis D, Iakovidis DK. Computer-based nodule malignancy risk assessment in thyroid ultrasound images. Int J Comput Appl. 2011 doi: 10.2316/Journal.202.2011.1.202-2955. [DOI] [Google Scholar]
- 84.Singh N, Jindal A. A segmentation method and comparison of classification methods for thyroid ultrasound images. Int J Comput Appl. 2012;50:43–49. doi: 10.5120/7818-1115. [DOI] [Google Scholar]
- 85.Dhaygude Priti S, Handore SM. Detection of thyroid nodule in ultrasound images using artificial neural network. Int J Adv Comput Eng Networking (IJACEN) 2016;4(2):61–65. [Google Scholar]
- 86.Dhaygude PS, Handore SM. Feature extraction of thyroid nodule US images using GLCM. Int J Sci Res. 2016;5:2014–2017. [Google Scholar]
- 87.Afshar P, Mohammadi A, Plataniotis KN et al (2018) From hand-crafted to deep learning-based cancer radiomics: challenges and opportunities. Comput Vis Pattern Recognition (Cornell Univ)
- 88.Seabra JCR., Fred ALN (2009) A biometric identification system based on thyroid tissue echo-morphology. In: Proc Int Conf Bio-inspired Syst Signal Process. pp 186–193. 10.5220/0001556501860193
- 89.Tsantis S, Dimitropoulos N, Cavouras D, Nikiforidis G. Computerized medical imaging and graphics morphological and wavelet features towards sonographic thyroid nodules evaluation. Comput Med Imaging Graph. 2009;33:91–99. doi: 10.1016/j.compmedimag.2008.10.010. [DOI] [PubMed] [Google Scholar]
- 90.Acharya UR, Sree SV, Rama MM, et al. Non-invasive automated 3D thyroid lesion classification in ultrasound: a class of ThyroScan™ systems. Ultrasonics. 2012;52:508–520. doi: 10.1016/j.ultras.2011.11.003. [DOI] [PubMed] [Google Scholar]
- 91.Song G, Xue F, Zhang C. A model using texture features to differentiate the nature of thyroid nodules on sonography. J Ultrasound Med. 2015;34:1753–1760. doi: 10.7863/ultra.15.14.10045. [DOI] [PubMed] [Google Scholar]
- 92.Katsigiannis SEGK. A contourlet transform feature extraction scheme for ultrasound thyroid texture classification. Eng Intell Syst. 2010;18(3):171. [Google Scholar]
- 93.Acharya UR, Sree SV, Swapna G, et al. Effect of complex wavelet transform filter on thyroid tumor classification in three-dimensional ultrasound. Proc Inst Mech Eng Part H J Eng Med. 2013;227:284–292. doi: 10.1177/0954411912472422. [DOI] [PubMed] [Google Scholar]
- 94.Acharya UR, Chowriappa P, Fujita H, Bhat S. Thyroid lesion classification in 242 patient population using Gabor transform features from high resolution ultrasound images. Knowl-Based Syst. 2016 doi: 10.1016/j.knosys.2016.06.010. [DOI] [Google Scholar]
- 95.Acharya UR, S VS, Molinari F et al (2012) Automated benign & malignant thyroid lesion characterization and classification in 3D contrast-enhanced ultrasound. In: 34th Annu Int Conf IEEE EMBS. pp 452–455 [DOI] [PubMed]
- 96.Augustin S, Babu SS (2013) Thyroid classification as normal and abnormal using scg based feed forward back propagation neural network algorithm. In: Int J Comput Sci Mob Comput. pp 134–141
- 97.Acharya UR, Sree SV, Mookiah MRK, et al. Diagnosis of Hashimoto’s thyroiditis in ultrasound using tissue characterization and pixel classification. J Eng Med. 2013;227:788–798. doi: 10.1177/0954411913483637. [DOI] [PubMed] [Google Scholar]
- 98.Nugroho A, Nugroho HA, Setiawan NA, Choridah L. Internal content classification of ultrasound thyroid nodules based on textural features. Commun Sci Technol. 2016;1:61–69. doi: 10.21924/cst.1.2.2016.25. [DOI] [Google Scholar]
- 99.Koprowski R, Korzy A, Wróbel Z, et al. Influence of the measurement method of features in ultrasound images of the thyroid in the diagnosis of Hashimoto’s disease. Biomed Eng (NY) 2012;11:1–21. doi: 10.1186/1475-925X-11-91. [DOI] [PMC free article] [PubMed] [Google Scholar]
- 100.Algorithmus E, Klassifikator-parametereinstellung D. Evolutionary algorithm-based classifier parameter tuning for automatic ovarian cancer tissue characterization and classification. Ultraschall Med. 2012;35:237–245. doi: 10.1055/s-0032-1330336. [DOI] [PubMed] [Google Scholar]
- 101.Tsantis S, Dimitropoulos N, Cavouras D, Nikiforidis G. A hybrid multi-scale model for thyroid nodule boundary detection on ultrasound images. Comput Methods Programs Biomed. 2006;4:86–98. doi: 10.1016/j.cmpb.2006.09.006. [DOI] [PubMed] [Google Scholar]
- 102.Chen J, You H (2016) Efficient classification of benign and malignant thyroid tumors based on characteristics of medical ultrasonic images. In: 2016 IEEE Adv Inf Manag Commun Electron Autom Control Conf. pp 950–954
- 103.Tsantis S, Glotsos D, Spyridonos P, Al E (2004) Improving diagnostic accuracy in the classification of thyroid cancer by combining quantitative information extracted from both ultrasound and cytological images. In: 1st Int Conf “From Sci Comput to Comput Eng”. pp 8–10
- 104.Prochazka AA, Gulati S, Holinka S, Smutek D. Patch-based classification of thyroid nodules in ultrasound images using direction independent features extracted by two-threshold binary decomposition. Comput Med Imaging Graph. 2019;71:9–18. doi: 10.1016/j.compmedimag.2018.10.001. [DOI] [PubMed] [Google Scholar]
- 105.Khairalseed M, Laimes R (2021) Classification of thyroid nodules in H-scan ultrasound images using texture and principal component analysis. In: IEEE UFFC Latin America Ultrasonics Symposium (LAUS), pp 1–4
- 106.Rajshree Srivastava PK. A CNN-SVM hybrid model for the classification of thyroid nodules in medical ultrasound images. Int J Grid Util Comput. 2022;13(6):624–639. doi: 10.1504/IJGUC.2022.128316. [DOI] [Google Scholar]
- 107.Khairalseed M, Laimes R (2022) H-scan ultrasound imaging for the classification of thyroid tumors. In: IEEE International Ultrasonics Symposium (IUS), pp 1–3
- 108.Keutgen XM, Li H, Memeh K, Busch JC, Williams J, Lan Li, Sarne D, Finnerty B, Angelos P, Fahey TJ, Giger ML. A machine-learning algorithm for distinguishing malignant from benign indeterminate thyroid nodules using ultrasound radiomic features. J Med Imaging. 2022;9(3):034501. doi: 10.1117/1.JMI.9.3.034501. [DOI] [PMC free article] [PubMed] [Google Scholar]
- 109.Poornima D, Karegowda A (2022) Enhanced thyroid nodule classification adopting significant features selection. In: Fourth International Conference on Emerging Research in Electronics, Computer Science and Technology (ICERECT), pp 1–5
- 110.Zhang F, Sun Y. Analysis of the application value of ultrasound imaging diagnosis in the clinical staging of thyroid cancer. J Oncol. 2022;2022:1–10. doi: 10.1155/2022/8030262. [DOI] [PMC free article] [PubMed] [Google Scholar]
Associated Data
This section collects any data citations, data availability statements, or supplementary materials included in this article.
Data Availability Statement
Data available on request due to privacy/ethical restrictions.