

Abstract
Immune checkpoint inhibitors block the interaction between a receptor on one cell and its ligand on another cell, thus preventing the transduction of an immunosuppressive signal. While inhibition of the receptor–ligand interaction is key to the pharmacological activity of these drugs, it can be technically challenging to measure these intercellular interactions directly. Instead, target engagement (or receptor occupancy) is commonly measured, but may not always be an accurate predictor of receptor–ligand inhibition, and can be misleading when used to inform clinical dose projections for this class of drugs. In this study, a mathematical model explicitly representing the intercellular receptor–ligand interaction is used to compare dose prediction based on target engagement or receptor–ligand inhibition for two checkpoint inhibitors, atezolizumab and magrolimab. For atezolizumab, there is little difference between target engagement and receptor–ligand inhibition, but for magrolimab, the model predicts that receptor–ligand inhibition is significantly less than target engagement. The key variables explaining the difference between these two drugs are the relative concentrations of the target receptors and their ligands. Drug‐target affinity and receptor–ligand affinity can also have divergent effects on target engagement and inhibition. These results suggest that it is important to consider ligand–receptor inhibition in addition to target engagement and demonstrate the impact of using modeling for efficacious dose estimation.
INTRODUCTION
Target engagement, also referred to as “receptor occupancy,” is defined as the percent of all target receptor bound by a drug. It is a commonly measured experimental readout for monoclonal antibody drugs with membrane protein targets. 1 However, for antibodies that act by blocking the interaction of a receptor with a cognate ligand, target engagement may not accurately reflect the degree of inhibition of the receptor–ligand interaction. In these cases, receptor–ligand inhibition (referred to herein as “inhibition”) is one step further downstream of target engagement in the drug's mechanism of action and thus is often a more accurate metric for assessing the desired pharmacology. Instead, inhibition can be more challenging to measure directly in vivo than target engagement, and is less frequently assessed in drug development programs. Therefore, it is important to understand under which circumstances target engagement can be considered a good surrogate metric for inhibition for the purposes of dose selection.
One class of drugs that act by inhibiting receptor–ligand interactions are the immune checkpoint inhibitors. Immune checkpoints are proteins expressed by cells that modulate the strength of the immune response. They are expressed as part of the system to identify “self” vs. “non‐self” and prevent the immune system from attacking cells of its host. Immune checkpoints are upregulated in some cancers, allowing cancerous cells to evade immune surveillance. When a receptor on the surface of one cell interacts with a ligand on the surface of another cell, downstream signals are triggered that inhibit the immune cells' activity. Checkpoint inhibitors block the interaction of receptor and ligand and thereby prevent inhibition of the immune cell activity.
Two examples of immune checkpoint inhibitors are atezolizumab and magrolimab. Atezolizumab is an anti‐PD‐L1 monoclonal antibody that blocks the interaction of PD‐L1 with its binding partner, PD‐1. By inhibiting the PD‐1:PD‐L1 checkpoint, atezolizumab promotes T‐cell activation and antitumor activity. Another drug that works by blocking receptor–ligand interactions is the anti‐CD47 antibody, Magrolimab, currently in phase III clinical trials. This drug inhibits the interaction of CD47 with its ligand, SIRPα, on macrophages and thus increases the antibody‐dependent cellular phagocytosis of cancer cells.
Here, a mechanistic mathematical model of an antibody targeting a membrane receptor with a membrane ligand is used to predict target engagement and inhibition, and subsequently to compare whether they have similar dose response. Several properties related to the drug and the receptor–ligand pair can impact whether or not target engagement can be considered a close surrogate for inhibition. Using model simulations, we demonstrate that the drug‐target binding affinity, the receptor–ligand binding affinity, and relative concentrations of receptor and ligand expression can all contribute to the discrepancy between engagement and inhibition. Mathematical models that take all of these factors into account can be a useful tool to improve dose estimates by predicting the ability of a drug to effectively compete with a ligand for binding to its target receptor.
KEY QUESTION
The overall aim of this work is to compare the impact on dose prediction when using target engagement vs. inhibition as criteria for assessing checkpoint inhibition. The key questions of this case report are as follows: (1) whether defining the appropriate criteria for projecting effective dose can significantly impact the estimated dose and (2) what factors govern when target engagement differs from receptor–ligand inhibition.
ANALYSIS PLAN AND KEY ASSUMPTIONS
In this case study, all modeling simulations were run using the “Monospecific Anti‐Receptor with Membrane Ligand Competitor (4‐Compartment) with Avidity” model in Applied BioMath Assess™ software. A diagram of the model is shown in Figure 1. It is a mechanistic pharmacokinetic/pharmacodynamic (PK/PD) model of a drug binding to a membrane‐bound receptor on the surface of one cell and blocking binding to a membrane‐bound ligand on the surface of another cell. In this model, “receptor” is defined as the drug target and “ligand” is the drug target's cognate binding partner. The drug has bivalent binding to the target. The default model includes central, peripheral, disease, and tox compartments, each with a soluble and a membrane sub‐compartment. For this work, the tox compartment was turned off by setting the drug partition coefficient (Pdist) to the tox compartment to 0. This model allows us to explore engagement and inhibition effects at the site‐of‐action (i.e., tumor). The model includes intercompartmental transport of drug, drug binding to target, drug clearance, and receptor synthesis and degradation.
FIGURE 1.
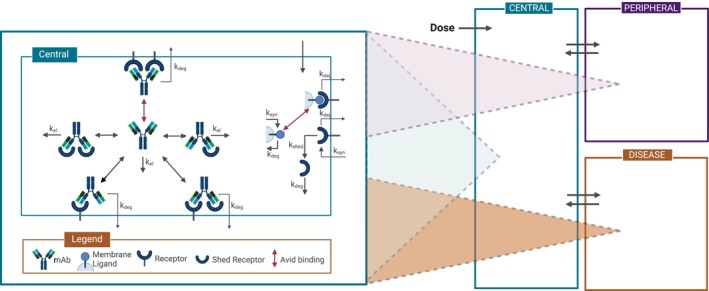
Model diagram. After administration in the central compartment, the antibody can distribute to the peripheral, and disease compartments. Elimination occurs in all compartments. The antibody can bind bivalently to membrane and soluble receptors. Synthesis, internalization, and avid binding of target receptor to ligand are also captured in every compartment. Figure created with BioRender.com.
Other key assumptions of the model included as follows: (a) species are well‐mixed in their respective soluble and membrane compartments; (b) receptor‐bound antibodies internalize with receptors at the same first‐order rate as internalization of unbound receptors; and (c) there is no transport of membrane receptors or membrane ligands between compartments, and therefore, no cellular trafficking represented in the model. More information about the model can be found in the supplemental text.
The model is parameterized for magrolimab and atezolizumab using published non‐clinical data for each drug and its respective target and cognate binding partner, including receptor and ligand concentrations, binding affinities, and other drug‐specific parameters. The only clinical data used to parameterize the model were the reported linear elimination half‐lives for magrolimab 2 and atezolizumab. 3 Unknown parameters were set to standard values for monoclonal antibodies. 4 , 5 , 6 Complete parameter tables for both models are found in Table S1, with target burden calculations for CD47, SIRPα, PD‐L1, and PD‐1 in Tables [Link], [Link], respectively.
Dose estimates are performed by calculating the dose level predicted to achieve 95% target engagement or receptor–ligand inhibition at trough in the tumor compartment following seven IV doses at a specified dosing interval. Dose estimates for target engagement and inhibition are compared with one another to determine the extent to which differences between the two metrics impact dose estimates. The dose estimates presented herein assume that toxicity is not dose‐limiting.
Two‐dimensional (2D) scans of model parameters are performed by varying values of two specified parameters while holding the values for other parameters constant. Parameter values for magrolimab were used as nominal values. The color of the heatmap represents engagement or inhibition (as indicated) at trough in the tumor compartment following seven IV doses at the specified dosing interval.
RESULTS
Model‐simulated PK was consistent with clinical observations for magrolimab and atezolizumab, with non‐linearity in both PK profiles indicative of target‐mediated drug disposition (Figure S1). Linear PK ranges for magrolimab and atezolizumab were >10 mg/kg QW and >0.5 mg/kg Q3W, respectively, in alignment with published findings. 2 , 3 The ability of the models to capture these clinical data supports the reliability of the model parameterizations with respect to target burden and binding affinity.
Model‐predicted dose‐responses of target engagement and receptor–ligand inhibition in a solid tumor are shown in Figure 2, for atezolizumab (left) and magrolimab (right). When parameterized for atezolizumab, the model predicts a dose of 0.72 mg/kg dosed Q3W IV will result in 95% target engagement in the tumor. The dose to achieve 95% inhibition of receptor–ligand complex formation is 1.78 mg/kg. Both predicted doses fall within 0.3–3 mg/kg; the range of doses estimated to reach 95% tumor target engagement from preclinical and clinical data from various publications. 3 , 7 In this case, the two metrics track relatively closely together, and thus, the metric used does not substantially impact dose projections.
FIGURE 2.
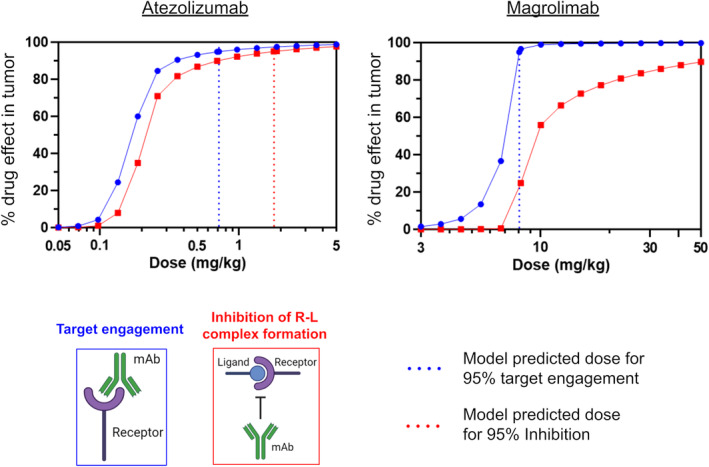
Dose response curves and predicted doses for atezolizumab and magrolimab based on target engagement versus receptor–ligand inhibition. Blue circles and red squares indicate target engagement and receptor–ligand inhibition dose response curves, respectively. Dotted lines indicate model‐predicted doses required for 95% target engagement (blue) or receptor–ligand inhibition (red).
In contrast to atezolizumab, the magrolimab model predicts there is a significant discrepancy between predicted target engagement and inhibition of receptor–ligand complex formation over a wide range of doses. For magrolimab, the dose projected to achieve 95% target engagement in the tumor is 8.05 mg/kg QW, but 95% inhibition is not achievable at doses up to 50 mg/kg. The clinical maintenance dose of magrolimab is 30 mg/kg QW, which our model predicts should achieve 99.7% target engagement in the tumor, but only 84.8% inhibition of complex formation. Given that the antitumor activity of magrolimab is thought to require preventing the interaction of CD47 and SIRPα, inhibition is likely the more relevant pharmacologic metric. These results suggest that insufficient receptor–ligand inhibition, among other factors, may contribute to the limited monotherapeutic efficacy observed for magrolimab in solid tumors, 2 in spite of near saturation of target engagement.
We hypothesized that receptor and ligand concentrations may play a role in differentiating atezolizumab and magrolimab, given that atezolizumab's target receptor, PD‐L1, is expressed at approximately the same level as the competitor ligand PD‐1, while magrolimab's target receptor, CD47, is expressed over 100x more than the competing ligand SIRPα (Table S1). To test this hypothesis, target engagement and receptor–ligand inhibition were simulated for various receptor and ligand concentrations in the tumor compartment, using parameters for magrolimab as the nominal condition at a dose of 10 mg/kg QW. The results are shown on a 2D contour plot in Figure 3. This analysis reveals conditions where differences would be expected between inhibition of the receptor–ligand interaction and target engagement. The gray cross indicates where CD47 and SIRPα expression levels lay on this surface, and the pink X shows the expression levels of PD‐L1 and PD‐1. The high expression level of CD47 over its ligand SIRPα as compared to similar expression of PD‐L1 relative to its ligand PD‐1 is the key reason in explaining why inhibition is significantly less than engagement for magrolimab but not for atezolizumab. Notably, changing tumor burden without changing relative receptor–ligand concentrations has no impact on either predicted target engagement or inhibition for either drug (Figure S2).
FIGURE 3.
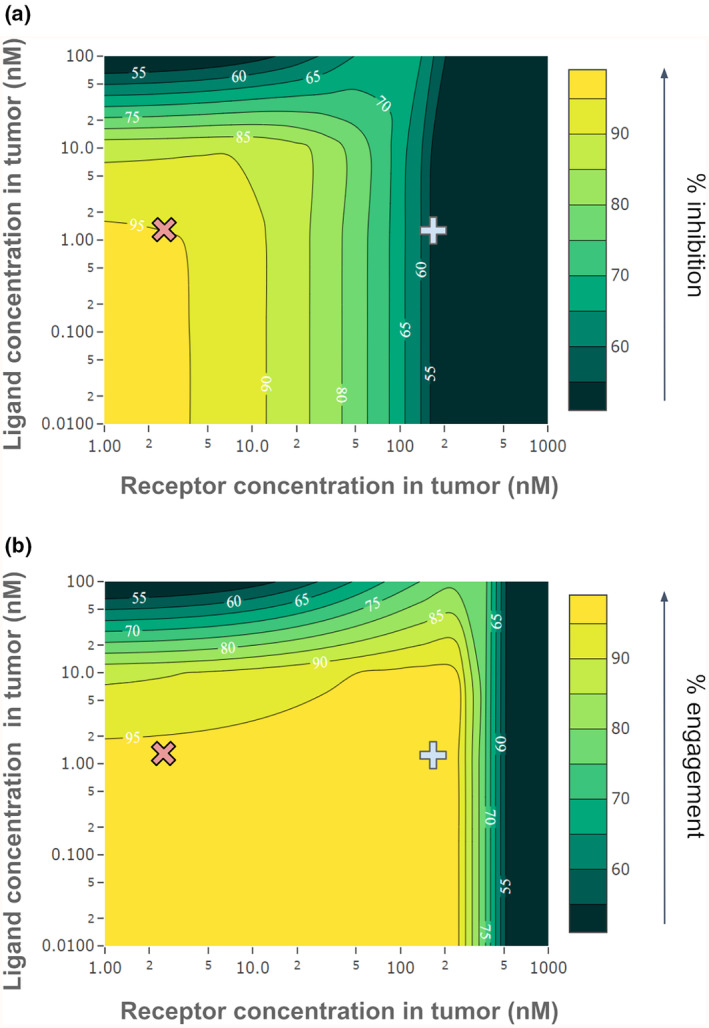
Impact of receptor and ligand concentrations in the tumor on target engagement and receptor–ligand inhibition for magrolimab. 2D parameter scans show the impact of varying receptor and ligand concentrations in the tumor at a fixed dose (10 mg/kg QW). Receptor concentration is varied on the x‐axis and ligand concentration on the y‐axis, with the color scale representing (a) % receptor–ligand inhibition, or (b) % target engagement. Estimated receptor and ligand concentrations in the tumor are indicated by the gray cross for CD47/SIRPα (receptor and ligand for magrolimab) or the pink X for PD‐L1/PD‐1 (receptor and ligand for atezolizumab).
To investigate how magrolimab's design parameters impact the dose required to achieve high inhibition, various binding affinities and doses were simulated, as shown in Figure 4. The experimentally measured K D of magrolimab for CD47, 8 nM, 8 achieves 84.8% inhibition of the complex formation in the tumor at the clinical dose of 30 mg/kg. Scanning different drug affinities, we find that a K D of 1 nM or less would achieve >95% inhibition in the tumor at doses around 15 mg/kg, half of the clinical dose. However, increasing the affinity beyond ~0.5 nM does not further reduce the dose achieving >95% inhibition. For magrolimab, the model predicts a tighter binding affinity could have helped lower the efficacious dose.
FIGURE 4.
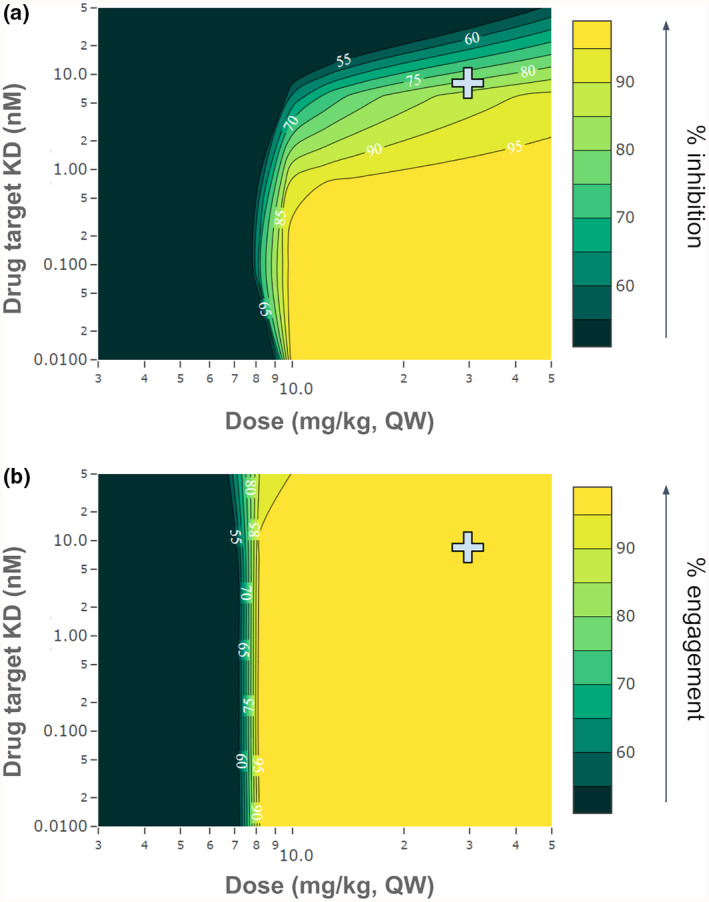
Impact of drug‐target binding affinity and dose on target engagement and receptor–ligand inhibition for magrolimab. 2D parameter scans show the impact of varying magrolimab binding affinity for CD47 on the predicted inhibition of CD47‐SIRPα interaction or CD47 target engagement at various doses. Dose is varied on the x‐axis and target K D on the y‐axis, with the color scale representing (a) % receptor–ligand inhibition, or (b) % target engagement. The predicted inhibition at the experimentally measured K D (8 nM) and clinical dose of magrolimab (30 mg/kg) are indicated by the gray cross.
The effective affinity between ligand and receptor also plays a role in determining whether engagement differs from inhibition. In Figure S3, the magrolimab model is used to simulate various combinations of receptor–ligand and drug‐target affinities and show their impact on engagement and inhibition. In this case, inhibition is increased by either increasing drug‐target affinity or decreasing receptor–ligand affinity (Figure S3A), while target engagement is increased by increasing drug‐target affinity only (Figure S3B). Consequently, the largest differences between target engagement and inhibition are observed at strong receptor–ligand affinities and weak drug‐target affinities. These observations can be explained in terms of relative receptor and ligand expression. For magrolimab, there is a large excess of target receptor (CD47) over ligand (SIRPα) in the tumor. Therefore, even when target engagement is very high, there is enough non‐drug‐bound receptor remaining to drive significant receptor–ligand binding if the receptor–ligand affinity is strong enough.
IMPACT ASSESSMENT
While target engagement has been a common end point measured clinically and predicted by mathematical models, our modeling suggests that target engagement may not always be equivalent to receptor–ligand inhibition. The magrolimab simulations reveal that the high ratio of receptor to ligand concentrations can cause a disconnect between engagement and inhibition. This is because the degree of receptor–ligand interaction is determined by the free receptor and free ligand concentrations relative to their binding affinity. In cases where the target concentration is well above the binding affinity, extremely high target engagement may be required to lower free target concentrations enough to reduce receptor–ligand complex formation. This is an important consideration when setting target engagement criteria for dose estimation. This also highlights the utility of models that explicitly represent the receptor–ligand interaction for dose estimation.
Models can be used prior to having clinical or even preclinical data available to assess the feasibility of a therapeutic strategy. 9 They can provide early and reasonably accurate estimates of effective doses for checkpoint inhibitors, as demonstrated in our simulations of atezolizumab and magrolimab. In particular, for checkpoint inhibitors, models can reveal whether target engagement is likely to be a good surrogate for receptor–ligand inhibition and help determine what drug or target properties are most important in this determination. The analysis shown herein can also be applied to other inhibitors that target receptors with competitive membrane ligands, where model‐informed drug design and target selection principles can be used to identify potential liabilities early in development.
CONCLUSION
For certain checkpoint inhibitors, receptor–ligand inhibition can be substantially lower than target engagement at a given dose, which can reduce the reliability of dose selection strategies based on target engagement. Using computational models, we can simulate both inhibition and engagement. For atezolizumab, inhibition and engagement are similar, but for magrolimab, receptor–ligand inhibition is notably less than target engagement over a wide range of dose levels. We investigated the cause of the differences between atezolizumab and magrolimab and found that larger tumor concentration of CD47 relative to its ligand SIRPα is the main cause for this difference. We also determined that a tighter affinity could have reduced the dose needed to achieve high receptor–ligand inhibition for magrolimab. The presented model can make feasibility assessments for checkpoint inhibitors or other therapies based on inhibition and/or target engagement by modeling receptor–ligand interactions.
FUNDING INFORMATION
Parts of this work were supported by the National Institutes of Health through grant 1R44GM116214, and from the US Food and Drug Administration through grant 1R43FD006606. The funders were not involved in the study design, collection, analysis, interpretation of data, the writing of this article, or the decision to submit it for publication.
CONFLICT OF INTEREST STATEMENT
Joshua F. Apgar and John M. Burke are Cofounders of Applied BioMath. Sarah A. Head, Carter Johnson, Saheli Sarkar, Andrew Matteson, Diana Marcantonio, Fei Hua, and David Flowers were Applied BioMath employees at the time of this work.
Supporting information
Appendix S1:
Figure S1:
Table S1:
Table S2:
Table S3:
Table S4:
Table S5:
ACKNOWLEDGMENTS
The authors would like to thank Victor Chang for contributing to the development of the model and the many colleagues at Applied BioMath who contributed to the discussion of this work.
Head SA, Johnson C, Sarkar S, et al. Comparison of dose selection based on target engagement versus inhibition of receptor–ligand interaction for checkpoint inhibitors. CPT Pharmacometrics Syst Pharmacol. 2024;13:919‐925. doi: 10.1002/psp4.13152
REFERENCES
- 1. Stewart JJ, Green CL, Jones N, et al. Role of receptor occupancy assays by flow cytometry in drug development. Cytometry B Clin Cytom. 2016;90:110‐116. [DOI] [PubMed] [Google Scholar]
- 2. Sikic BI, Lakhani N, Patnaik A, et al. First‐in‐human, first‐in‐class phase I trial of the anti‐CD47 antibody Hu5F9‐G4 in patients with advanced cancers. J Clin Oncol Off J Am Soc Clin Oncol. 2019;37:946‐953. [DOI] [PMC free article] [PubMed] [Google Scholar]
- 3. Stroh M, Winter H, Marchand M, et al. Clinical pharmacokinetics and pharmacodynamics of Atezolizumab in metastatic urothelial carcinoma. Clin Pharmacol Ther. 2017;102:305‐312. [DOI] [PubMed] [Google Scholar]
- 4. Shah DK, Betts AM. Towards a platform PBPK model to characterize the plasma and tissue disposition of monoclonal antibodies in preclinical species and human. J Pharmacokinet Pharmacodyn. 2012;39:67‐86. [DOI] [PubMed] [Google Scholar]
- 5. Shah DK, Betts AM. Antibody biodistribution coefficients: inferring tissue concentrations of monoclonal antibodies based on the plasma concentrations in several preclinical species and human. MAbs. 2013;5:297‐305. [DOI] [PMC free article] [PubMed] [Google Scholar]
- 6. Betts A, Keunecke A, van Steeg TJ, et al. Linear pharmacokinetic parameters for monoclonal antibodies are similar within a species and across different pharmacological targets: a comparison between human, cynomolgus monkey and hFcRn Tg32 transgenic mouse using a population‐modeling approach. MAbs. 2018;10:751‐764. [DOI] [PMC free article] [PubMed] [Google Scholar]
- 7. Deng R, Bumbaca D, Pastuskovas CV, et al. Preclinical pharmacokinetics, pharmacodynamics, tissue distribution, and tumor penetration of anti‐PD‐L1 monoclonal antibody, an immune checkpoint inhibitor. MAbs. 2016;8:593‐603. [DOI] [PMC free article] [PubMed] [Google Scholar]
- 8. Liu J, Wang L, Zhao F, et al. Pre‐clinical development of a humanized anti‐CD47 antibody with anti‐cancer therapeutic potential. PLoS One. 2015;10:e0137345. [DOI] [PMC free article] [PubMed] [Google Scholar]
- 9. Marcantonio DH, Matteson A, Presler M, et al. Early feasibility assessment: a method for accurately predicting biotherapeutic dosing to inform early drug discovery decisions. Front Pharmacol. 2022;13:864768. [DOI] [PMC free article] [PubMed] [Google Scholar]
Associated Data
This section collects any data citations, data availability statements, or supplementary materials included in this article.
Supplementary Materials
Appendix S1:
Figure S1:
Table S1:
Table S2:
Table S3:
Table S4:
Table S5: