

Abstract
Background
The effect of glycated hemoglobin (HbA1c) variability on adverse outcomes in patients with heart failure (HF) is unclear. We aim to investigate the predictive value of HbA1c variability on the risks of all‐cause death and HF rehospitalization in patients with HF irrespective of their diabetic status.
Methods and Results
Using a previously validated territory‐wide clinical data registry, HbA1c variability was assessed by average successive variability (ASV) or SD of all HbA1c measurements after HF diagnosis. Multivariable Cox proportional hazards models were used to estimate the adjusted hazard ratio (HR) and its corresponding 95% CI. A total of 65 950 patients with HF were included in the study. Over a median follow‐up of 6.7 (interquartile range, 4.0–10.6) years, 34 508 patients died and 52 446 required HF rehospitalization. Every unit increment of variability in HbA1c was significantly associated with higher HF rehospitalization (HR ASV, 1.20 [95% CI, 1.18–1.23]) and all‐cause death (HR ASV, 1.50 [95% CI, 1.47–1.53]). Diabetes significantly modified the association between HbA1c variability and outcomes (P interaction<0.001). HbA1c variability in patients with HF without diabetes conferred a higher risk of rehospitalization (HR ASV, 1.92 [95% CI, 1.70–2.17] versus HR ASV, 1.19 [95% CI, 1.17–1.21]), and all‐cause death (HR ASV, 3.90 [95% CI, 3.31–4.61] versus HR ASV, 1.47 [95% CI, 1.43–1.50] compared with patients with diabetes).
Conclusions
HbA1c variability is significantly associated with greater risk of rehospitalization and all‐cause death in patients with HF, irrespective of their diabetic status. These observations were more pronounced in patients with HF without diabetes.
Keywords: diabetes, HbA1c variability, heart failure
Subject Categories: Heart Failure
Nonstandard Abbreviations and Acronyms
- ACCORD
Action to Control Cardiovascular Risk in Diabetes
- ALLHAT
Antihypertensive and Lipid‐Lowering Treatment to Prevent Heart Attack Trial
- ASV
average successive variability
- CDARS
Clinical Data Analysis Reporting System
- SGLT2i
sodium–glucose cotransporter 2 inhibitor
Clinical Perspective.
What Is New?
Glycated hemoglobin variability is significantly associated with a greater risk of rehospitalization and all‐cause death in patients with heart failure.
The prognostic value of glycated hemoglobin variability is more pronounced in patients without diabetes compared with those with diabetes.
What Are the Clinical Implications?
The variability of glycated hemoglobin, irrespective of diabetic status, may serve as a predictor of death and rehospitalization in patients with heart failure, suggesting its relevance for risk stratification in this population.
Heart failure (HF) affects more than 64 million individuals globally, and the prevalence is expected to increase further as a result of an aging population and improved survival after diagnosis. 1 , 2 Identification of contemporary risk factors as well as potential therapeutic targets that could reduce hospitalization and death in patients with HF is therefore clinically relevant and could greatly reduce the associated health care burden.
Among many others, blood glucose level is an established factors of adverse outcome in patients with HF. In particular, glycated hemoglobin (HbA1c), a reliable and reproducible biomarker of the plasma glucose level over the previous 8 to 12 weeks, is recommended for use in both the diagnosis and monitoring of glycemic control in patients with diabetes. 3 Plasma glucose tends to be dynamic and is influenced by multiple factors, such as modifications of antidiabetic medications, underlying concomitant diseases, and lifestyle practice. Importantly, the fluctuation of glycemic status in patients with diabetes, which can be readily quantified by glycemic variability, correlates with the development of microvascular and macrovascular complications, 4 as well as death. 5 Glycemic variability is characterized by 2 components: short‐term variability, which occurs over days to weeks, and long‐term variability, which can be assessed by calculating fluctuations in HbA1c levels across multiple visits over months to years of follow‐up. Previously, HbA1c variability has been shown to be prognostically relevant even in patients without diabetes. 6 The role of HbA1c variability in patients with HF, however, has not been fully explored, especially among those without diabetes. Using a territory‐wide, prospectively updated, and previously validated medical database, we hereby aim to evaluate the association between HbA1c variability and the risk of HF readmission and all‐cause death in patients with HF irrespective of their underlying diabetic status.
METHODS
For legal reasons, study data cannot be made available to other researchers.
Data Source
This is a retrospective cohort study using data from the Clinical Data Analysis Reporting System (CDARS), a territory‐wide health care system developed by the Hong Kong Hospital Authority. Hong Kong Hospital Authority is the statutory body and singular provider of public health care services in Hong Kong, providing >80% inpatient services for 7.5 million people. 7 Information collected by CDARS includes but is not limited to diagnoses, demographic data, drug prescriptions, procedures, laboratory tests, and visits to the emergency department as well as episodes of hospital visits since 1993. 8 The International Classification of Diseases, both Ninth Revision (ICD‐9) and Tenth Revision (ICD‐10) were used to determine diagnostic data. Previous studies have proved that CDARS has a high coding accuracy, which enables it to be a reliable data source for conducting high‐quality epidemiological research. 8 , 9 , 10 To protect identity, patient data (name and Hong Kong identification number) were deidentified in CDARS, and unique reference numbers were generated. The study was approved by the institutional review board of the University of Hong Kong and the West Cluster of the Hong Kong Hospital Authority. Informed consent was waived because of the anonymized nature of the data.
Study Population and Outcomes
All patients first diagnosed with HF (ICD‐9: 402, 404, 425, 428) between January 1, 2003, and January 1, 2020, were searched. Patients who had at least 3 HbA1c measurements after being diagnosed were included. Patients who died within 90 days after the index date were excluded (Figure 1). Patients were followed up until death or December 31, 2021, whichever came earlier. The primary outcomes were rehospitalization for HF and all‐cause death.
Figure 1. Flowchart of the study cohort.
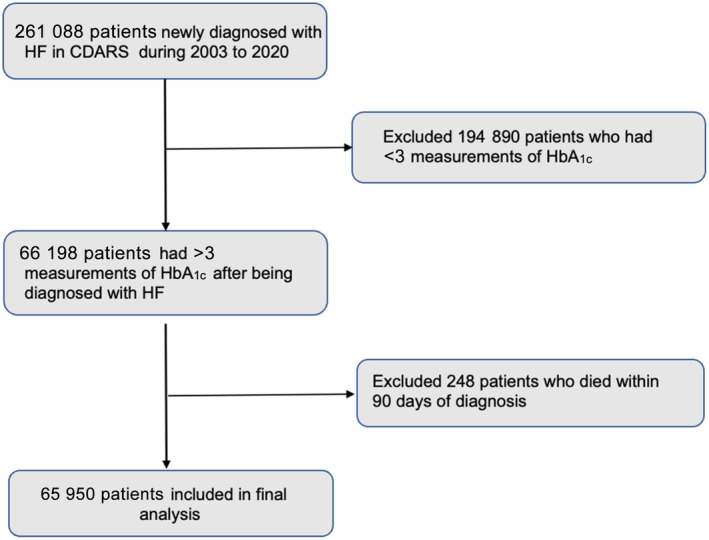
CDARS indicates clinical diagnosis and report system; HbA1c, glycated hemoglobin; and HF, heart failure.
Exposures
All HbA1c measurements collected from CDARS during the follow‐up period were used for variability calculation. We used 2 established measures to estimate the variability of HbA1c: HbA1c average successive variability (ASV) and SD. 11 ASV, defined as the average absolute difference between successive values, was the main exposure variable of interest. Since both ASV and SD were nonnegative numbers, the values were independent of the downward or upward trend of HbA1c.
Clinical Covariates
Demographics included age, sex, smoking, and alcohol consumption. Comorbidities included history or presence of hypertension, obesity, chronic kidney disease (CKD), dyslipidemia, or diabetes. Drug use included baseline use of angiotensin‐converting enzyme inhibitors, angiotensin II receptor blockers, calcium channel blockers, β blockers, diuretics, statins, insulin, metformin, sodium–glucose cotransporter 2 inhibitors (SGLT2is) and other antidiabetic drugs. Baseline drug use was defined as >90 days of consistent use before the index date. Detailed ICD‐9 and ICD‐10 codes used are in Table S1. In addition, HbA1c collected during the follow‐up period were used to calculate the mean of HbA1c.
Statistical Analysis
Patients were divided into 5 groups according to the quintiles of ASV. The levels of ASV in each group were as follows: quintile 1: ASV<0.207; quintile 2: 0.207≤ASV<0.358; quintile 3: 0.358≤ASV<0.586; quintile 4: 0.586≤ASV<0.97; group 5: ASV≥0.97. Continuous variables were presented as mean±SD and compared by ANOVA or the Kruskal–Wallis test. Categorical variables were presented as numbers (percentages) and compared by χ 2 test. We used a multivariable Cox proportional hazards regression model to calculate the adjusted hazard ratio (HR) for the effects of HbA1c variability on all‐cause death and HF rehospitalization. Death was considered as a competing risk for HF rehospitalization using the Fine and Gray method. HbA1c variability was modeled as a continuous variable (per unit increment in variability of HbA1c) or as quintiles, with the lowest quintile serving as the reference group. Three adjusted models were used as follows: Model 1 included age and sex. Model 2 included all the covariates in Model 1 and was additionally adjusted for obesity; smoking; alcohol consumption; hypertension; CKD; dyslipidemia; diabetes; and baseline use of angiotensin‐converting enzyme inhibitors, angiotensin II receptor blockers, calcium channel blockers, β blockers, diuretics, statins, insulin, metformin, SGLT2is, and other antidiabetic drugs. Model 3 included all covariates in model 2, as well as the mean of HbA1c.
Subgroup analysis was conducted on the basis of patients' characteristics and comorbidities stratified by age, sex, alcohol consumption, smoking, hypertension, obesity, and diabetic status.
Multiple sensitivity analyses were performed: first, body mass index and blood pressure were adjusted in a specific subset of the population where relevant data were obtainable. Second, we excluded patients with an event of HF within 30 days after the index date. Third, we performed a sensitivity analysis by censoring at the last clinic visit date. Fourth, we conducted an analysis limiting the use of HbA1c variability before HF rehospitalization. All statistical tests were 2‐sided, with P<0.05 set as the significance level. All statistical analyses were performed using R version 4.0.2 (R Foundation for Statistical Computing, Vienna, Austria).
RESULTS
Baseline Characteristics
A total of 65 950 patients with HF were included in the final analysis, of whom 52.9% were men. The mean age was 66.6±12.0 years. During a median follow‐up of 6.7 (interquartile range, 4.0–10.6) years, 34 508 (52.3%) patients died and 52 446 (79.5%) cases of HF rehospitalization occurred. The median number of HbA1c measurements was 8 (interquartile range, 4–12), the median interval of HbA1c measurements was 146 days (interquartile range, 100–252). The mean HbA1c variability—HbA1c ASV was 0.63%±0.56% and the mean follow‐up HbA1c was 6.88%±1.24%.
Table 1 presents the baseline characteristics of patients stratified by quintiles of HbA1c ASV. Age and sex distribution were similar between all quintiles. Patients with HF in the highest quintile had a greater proportion of alcohol consumption and smoking. It was also more common for this group to have hypertension, obesity, diabetes, CKD, and baseline usage of angiotensin‐converting enzyme inhibitors, diuretics, insulin, metformin, and other antidiabetic drugs.
Table 1.
Baseline Characteristics of Participants Stratified by Quintiles of HbA1c ASV
| Total (n=65 950) | Quintile 1 (n=13 624) | Quintile 2 (n=13 608) | Quintile 3 (n=13 250) | Quintile 4 (n=12 934) | Quintile 5 (n=12 534) | |
|---|---|---|---|---|---|---|
| HbA1c ASV, % | 0.63 (0.56) | 0.14 (0.05) | 0.29 (0.04) | 0.48 (0.07) | 0.78 (0.11) | 1.60 (0.66) |
| Demographics | ||||||
| Age, y, mean±SD | 66.6±12.0 | 65.3±12.8 | 67.2±12.2 | 67.1±11.8 | 66.5±11.7 | 66.8±11.6 |
| Sex, male, n (%) | 34 887 (52.9) | 7783 (57.1) | 7320 (53.8) | 6856 (51.7) | 6537 (50.5) | 6391 (51.0) |
| Smoking, n (%) | 3014 (4.6) | 554 (4.1) | 640 (4.7) | 625 (4.7) | 559 (4.3) | 636 (5.1) |
| Alcohol, n (%) | 906 (1.4) | 127 (0.9) | 153 (1.1) | 180 (1.4) | 197 (1.5) | 249 (2.0) |
| Comorbidities, n (%) | ||||||
| Hypertension | 29 639 (44.9) | 4723 (34.7) | 5660 (41.6) | 6347 (47.9) | 6449 (49.9) | 6460 (51.5) |
| Obesity | 1239 (1.9) | 185 (1.4) | 215 (1.6) | 262 (2.0) | 286 (2.2) | 291 (2.3) |
| Dyslipidemia | 10 009 (15.2) | 1732 (12.7) | 1936 (14.2) | 2099 (15.8) | 2170 (16.8) | 2072 (16.5) |
| Diabetes | 48 673 (73.8) | 3649 (26.8) | 8287 (60.9) | 11 583 (87.4) | 12 639 (97.7) | 12 515 (99.8) |
| CKD | 5285 (8.0) | 521 (3.8) | 851 (6.3) | 1181 (8.9) | 1383 (10.7) | 1349 (10.8) |
| Drugs, n (%) | ||||||
| ACEi | 21 493 (32.6) | 3142 (23.1) | 4002 (29.4) | 4523 (34.1) | 4931 (38.1) | 4895 (39.1) |
| ARB | 7264 (11.0) | 1236 (9.1) | 1496 (11.0) | 1581 (11.9) | 1600 (12.4) | 1351 (10.8) |
| β Blocker | 24 798 (37.6) | 4573 (33.6) | 5140 (37.8) | 5136 (38.8) | 5203 (40.2) | 4746 (37.9) |
| CCB | 25 228 (38.3) | 4017 (29.5) | 4843 (35.6) | 5457 (41.2) | 5580 (43.1) | 5331 (42.5) |
| Diuretics | 22 891 (34.7) | 3290 (24.1) | 4377 (32.2) | 4796 (36.2) | 5242 (40.5) | 5186 (41.4) |
| Statin | 18 444 (28.0) | 3083 (22.6) | 3597 (26.4) | 3834 (28.9) | 4088 (31.6) | 3842 (30.7) |
| Insulin | 7155 (10.8) | 100 (0.7) | 397 (2.9) | 1265 (9.5) | 2505 (19.4) | 2888 (23.0) |
| Metformin | 27 396 (41.5) | 1188 (8.7) | 3727 (27.4) | 6602 (49.8) | 7879 (60.9) | 8000 (63.8) |
| SGLT2i | 2146 (3.3) | 79 (0.6) | 203 (1.5) | 589 (4.4) | 583 (6.6) | 692 (5.5) |
| Other antidiabetic drugs | 17 192 (26.1) | 467 (3.4) | 1777 (13.1) | 3784 (38.6) | 5577 (41.0) | 5637 (45.0) |
| Glucose status | ||||||
| Baseline HbA1c, mean (%) | 6.95 (1.61) | 5.89 (0.50) | 6.19 (0.70) | 6.79 (1.06) | 7.59 (1.52) | 8.43 (2.18) |
| Follow‐up HbA1c, mean (%) | 6.88 (1.24) | 5.88 (0.48) | 6.16 (0.62) | 6.70 (0.82) | 7.45 (1.00) | 8.36 (1.20) |
P<0.001 for all characteristics. ACEi indicates angiotensin‐converting enzyme inhibitor; ARB, angiotensin receptor blocker; ASV, average successive variability; CCB, calcium channel blocker; CKD, chronic kidney disease; FPG, fasting plasma glucose; HbA1c, glycated hemoglobin; and SGLT2i, sodium‐glucose cotransporter 2 inhibitor.
Associations of Long‐Term HbA1c Variability and the Risk of All‐Cause Death or HF Rehospitalization
HbA1c variability was significantly associated with the risks of death and HF rehospitalization. When being examined continuously in the fully adjusted model (model 3), each unit change of ASV was associated with a higher risk of all‐cause death (HR, 1.50 [95% CI, 1.47–1.53]), as well as a higher risk of HF rehospitalization (HR, 1.20 [95% CI, 1.18–1.23]). Results were consistent when HbA1c variability was indexed by each unit change in SD as well (Figure 2).
Figure 2. Multivariable‐adjusted association of each unit increment of variability in HbA1c with risk of all‐cause death and HF rehospitalization among patients with HF.
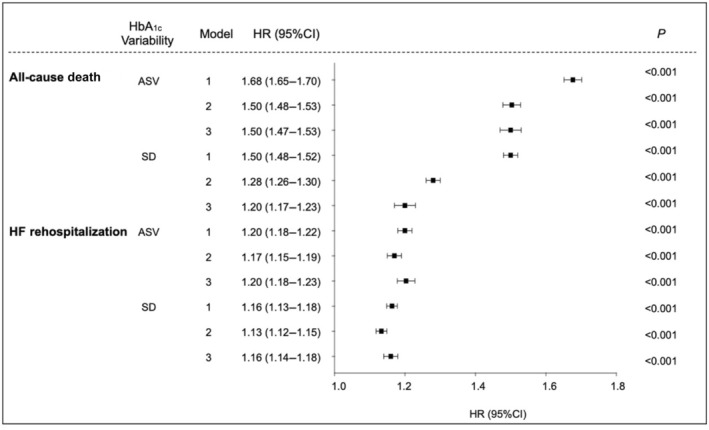
Model 1: adjusted for age and sex. Model 2: adjusted for age, sex, alcohol consumption, smoking; obesity, dyslipidemia, hypertension, diabetes, chronic kidney disease; use of angiotensin‐converting enzyme inhibitor, angiotensin receptor blocker, calcium channel blocker, β blocker, diuretic, statin, insulin, metformin, sodium–glucose cotransporter 2 inhibitor, and other antidiabetic drug. Model 3: adjusted for factors in model 2 and HbA1c mean. Cox regression model with competing risk regression was used where appropriate. ASV indicates average successive variability; CDARS, Clinical Data Analysis Reporting System; HbA1c, glycated hemoglobin; and HF, heart failure.
In all adjusted models, compared with the lowest quintile (reference group), patients in the highest quintile of HbA1c ASV had a significantly higher risk for all‐cause death (HR, 2.34 [95% CI, 2.22–2.46]), as well as for HF rehospitalization (HR, 1.46 [95% CI, 1.41–1.53]). Across increasing quintiles of HbA1c ASV, the risk of death and HF rehospitalization increased in a graded fashion (Table 2). Similar results were observed with quintiles of HbA1c SD (Table S2). In comparison with the lowest quintile, the highest quintile of HbA1c SD was also associated with a higher risk of all‐cause death (HR, 1.60 [95% CI, 1.52–1.69]) and HF rehospitalization (HR, 1.42 [95% CI, 1.38–1.48]).
Table 2.
Association Between HbA1c ASV and the Risk of All‐Cause Death and HF Rehospitalization Grouped by Quintiles
| Quintile 1 (n=13 624) | Quintile 2 (n=13 608) | Quintile 3 (n=13 250) | Quintile 4 (n=12 934) | Quintile 5 (n=12 534) | P value | |
|---|---|---|---|---|---|---|
| All‐cause death, HR (95% CI) | ||||||
| Cases, n (%) | 3913 (28.7) | 5940 (43.7) | 7369 (55.6) | 8250 (63.8) | 9036 (72.1) | |
| Model 1 | Reference | 1.42 (1.36–1.47) | 1.96 (1.89–2.04) | 2.39 (2.30–2.49) | 3.18 (3.06–3.30) | <0.001 |
| Model 2 | Reference | 1.27 (1.22–1.33) | 1.60 (1.53–1.67) | 1.78 (1.70–1.87) | 2.39 (2.28–2.50) | <0.001 |
| Model 3 | Reference | 1.27 (1.22–1.33) | 1.60 (1.531.67) | 1.76 (1.68–1.85) | 2.34 (2.22–2.46) | <0.001 |
| HF rehospitalization, HR (95% CI) | ||||||
| Cases, n (%) | 9730 (71.4) | 10 603 (77.9) | 10 711 (80.8) | 10 711 (82.8) | 10 691 (85.3) | |
| Model 1 | Reference | 1.12 (1.09–1.15) | 1.20 (1.17–1.23) | 1.26 (1.23–1.29) | 1.42 (1.38–1.46) | <0.001 |
| Model 2 | Reference | 1.12 (1.09–1.15) | 1.21 (1.17–1.24) | 1.25 (1.21–1.29) | 1.41 (1.36–1.46) | <0.001 |
| Model 3 | Reference | 1.12 (1.08–1.15) | 1.21 (1.20–1.28) | 1.27 (1.25–1.34) | 1.46 (1.41–1.53) | <0.001 |
Model 1: adjusted for age and sex. Model 2: adjusted for age, sex, alcohol consumption, smoking; obesity, dyslipidemia, hypertension, diabetes, chronic kidney disease; use of angiotensin‐converting enzyme inhibitor, angiotensin receptor blocker, calcium channel blocker, β blocker, diuretic, statin, insulin, metformin, sodium–glucose cotransporter 2 inhibitor, and other antidiabetic drug. Model 3: adjusted for factors in model 2 and HbA1c mean. Cox regression model with competing risk regression was used where appropriate. ASV indicates average successive variability; HbA1c, glycated hemoglobin; and HF, heart failure.
The multivariable adjusted survival curve showed that cumulative incidence of all‐cause death and HF rehospitalization increased progressively with increasing quintiles of HbA1c ASV. Individuals in the top quintile experienced a higher cumulative incidence of all‐cause death (P<0.001; Figure 3A) and HF rehospitalization (P<0.001; Figure 3B) during the follow‐up period. Patients were categorized into 4 groups on the basis of the mean and ASV of HbA1c, as depicted in Figure S1A. The cumulative incidence curve illustrated that patients with a higher ASV displayed a greater incidence of both all‐cause death (P<0.001; Figure S1B) and HF rehospitalization (P<0.001; Figure S1C), independent of their mean HbA1c level.
Figure 3. Multivariable adjusted survival curve for quintiles of HbA1c ASV.
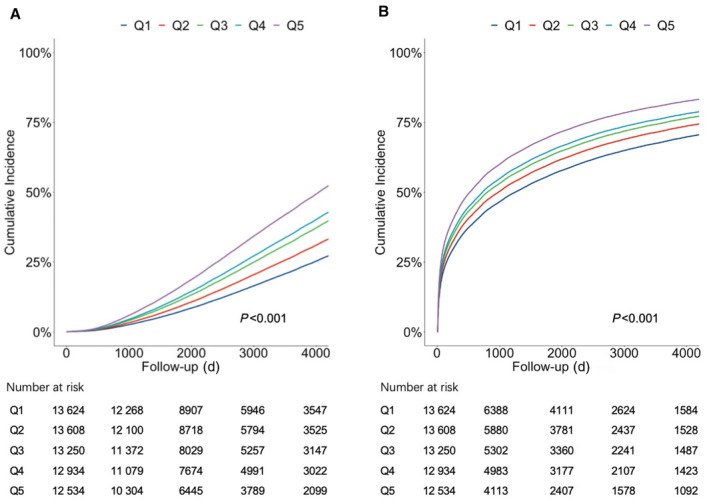
Multivariable adjusted survival curve of all‐cause death (A) and HF rehospitalization (B) in different quintiles of HbA1c ASV. ASV indicates average successive variability; HbA1c, glycated hemoglobin; and HF, heart failure.
Subgroup analysis is shown in Table 3. Higher HbA1c variability was associated with increased risk of all‐cause death and HF rehospitalization in all subgroups stratified by age (≤75 versus >75 years), sex, alcohol consumption, smoking, hypertension, CKD, obesity, and dyslipidemia. The interactions between HbA1c variability and age, sex, or CKD were significant (P interaction<0.01).
Table 3.
Subgroup Analysis of the Association Between Each Unit Increment of HbA1c ASV With the Risks of All‐Cause Death and HF Rehospitalization
| All‐cause death | HF rehospitalization | |||||
|---|---|---|---|---|---|---|
| HR (95% CI) | P value | P for interaction | HR (95% CI) | P value | P for interaction | |
| Age, y | <0.001 | <0.001 | ||||
| ≤75 (n=47 966) | 1.60 (1.56–1.64) | <0.001 | 1.21 (1.18–1.24) | <0.001 | ||
| >75 (n=17 984) | 1.31 (1.25–1.36) | <0.001 | 1.19 (1.15–1.24) | <0.001 | ||
| Sex | <0.001 | 0.003 | ||||
| Female (n=31 063) | 1.54 (1.59–1.59) | <0.001 | 1.24 (1.20–1.27) | <0.001 | ||
| Male (n=34 887) | 1.47 (1.43–1.52) | <0.001 | 1.18 (1.15–1.21) | <0.001 | ||
| Alcohol | 0.16 | 0.2 | ||||
| Yes (n=906) | 1.63 (1.39–1.90) | <0.001 | 1.17 (1.02–1.34) | <0.05 | ||
| No (n=65 044) | 1.50 (1.46–1.53) | <0.001 | 1.21 (1.18–1.23) | <0.001 | ||
| Smoking | 0.06 | 0.08 | ||||
| Yes (n=3014) | 1.41 (1.29–1.55) | <0.001 | 1.19 (1.10–1.29) | <0.001 | ||
| No (n=62 936) | 1.51 (1.48–1.54) | <0.001 | 1.21 (1.18–1.23) | <0.001 | ||
| Hypertension | 0.38 | 0.22 | ||||
| Yes (n=29 639) | 1.54 (1.49–1.59) | <0.001 | 1.18 (1.15–1.21) | <0.001 | ||
| No (n=36 311) | 1.45 (1.41–1.50) | <0.001 | 1.20 (1.17–1.24) | <0.001 | ||
| CKD | <0.001 | <0.001 | ||||
| Yes (n=5285) | 1.37 (1.28–1.46) | <0.001 | 1.11 (1.04–1.19) | <0.01 | ||
| No (n=60 665) | 1.50 (1.47–1.54) | <0.001 | 1.22 (1.19–1.24) | <0.001 | ||
| Obesity | 0.73 | 0.91 | ||||
| Yes (n=1239) | 1.59 (1.33–1.89) | <0.001 | 1.17 (1.03–1.37) | <0.05 | ||
| No (n=64 711) | 1.50 (1.47–1.53) | <0.001 | 1.21 (1.18–1.23) | <0.001 | ||
| Dyslipidemia | 0.007 | 0.30 | ||||
| Yes (n=10 009) | 1.63 (1.54–1.73) | <0.001 | 1.20 (1.14–1.26) | <0.001 | ||
| No (n=55 941) | 1.48 (1.45–1.52) | <0.001 | 1.21 (1.18–1.23) | <0.001 | ||
These analyses were calculated in model 3 where age, sex, alcohol consumption, smoking; obesity, dyslipidemia, hypertension, diabetes, chronic kidney disease; use of angiotensin‐converting enzyme inhibitor, angiotensin receptor blocker, calcium channel blocker, β blocker, diuretic, statin, insulin, metformin, sodium–glucose cotransporter 2 inhibitor, other antidiabetic drug; and HbA1c mean were adjusted. Cox regression model with competing risk regression was used where appropriate. ASV indicates average successive variability; CKD, chronic kidney disease; HbA1c, glycated hemoglobin; and HF, heart failure.
Associations of HbA1c Variability and Outcomes By Diabetic Status
In our study population, 17 277 (26.2%) patients with HF were nondiabetic. Baseline characteristics of patients with and without diabetes are shown in Tables S3 and S4. Patients with HF with diabetes were older, more likely to be women, and more commonly on cardiovascular medications. A history of hypertension, obesity, dyslipidemia, or CKD was also more frequently seen in patients with HF with diabetes. Among patients with HF with diabetes, each unit change in HbA1c ASV was associated with increased risk of all‐cause death (HR, 1.47 [95% CI, 1.43–1.50]; P<0.001) and HF rehospitalization (HR, 1.19 [95% CI, 1.17–1.21]; P<0.001). Similar results were observed with HbA1c SD, which was significantly associated with both incident death (HR, 1.16 [95% CI, 1.13–1.19]; P<0.001) and HF rehospitalization (HR, 1.14 [95% CI, 1.12–1.17]; P<0.001; Table 4).
Table 4.
Multivariable‐Adjusted Association of Each Unit Increment of Long‐Term Variability in HbA1c With Risk of All‐Cause Death and HF Rehospitalization Among Patients With HF With or Without Diabetes
| Outcomes | Events (n) | ASV | SD | ||
|---|---|---|---|---|---|
| HR (95% CI), P value | P for interaction | HR (95% CI), P value | P for interaction | ||
| All‐cause death | |||||
| Model 1 | <0.001 | <0.001 | |||
| With diabetes (n=48 673) | 28 706 | 1.49 (1.46–1.51), <0.001 | 1.30 (1.28–1.32), <0.001 | ||
| Without diabetes (n=17 277) | 5802 | 4.64 (3.96–5.45), <0.001 | 5.47 (4.52–6.62), <0.001 | ||
| Model 2 | <0.001 | <0.001 | |||
| With diabetes (n=48 673) | 28 706 | 1.48 (1.46–1.51), <0.001 | 1.30 (1.28–1.32), <0.001 | ||
| Without diabetes (n=17 277) | 5802 | 4.31 (3.66–5.10), <0.001 | 4.85 (4.00–5.90), <0.001 | ||
| Model 3 | <0.001 | <0.001 | |||
| With diabetes (n=48 673) | 28 706 | 1.47 (1.43–1.50), <0.001 | 1.16 (1.13–1.19), <0.001 | ||
| Without diabetes (n=17 277) | 5802 | 3.90 (3.31–4.61), <0.001 | 4.26 (3.49–5.19), <0.001 | ||
| HF rehospitalization | |||||
| Model 1 | <0.001 | <0.001 | |||
| With diabetes (n=48 673) | 39 410 | 1.18 (1.16–1.19), <0.001 | 1.14 (1.12–1.16), <0.001 | ||
| Without diabetes (n=17 277) | 13 036 | 2.09 (1.86–2.35), <0.001 | 2.39 (2.08–2.73), <0.001 | ||
| Model 2 | <0.001 | <0.001 | |||
| With diabetes (n=48 673) | 39 410 | 1.16 (1.15–1.18), <0.001 | 1.13 (1.10–1.14), <0.001 | ||
| Without diabetes (n=17 277) | 13 036 | 1.96 (1.73–2.20), <0.001 | 2.21 (1.92–2.52), <0.001 | ||
| Model 3 | <0.001 | <0.001 | |||
| With diabetes (n=48 673) | 39 410 | 1.19 (1.17–1.21), <0.001 | 1.14 (1.12–1.17), <0.001 | ||
| Without diabetes (n=17 277) | 13 036 | 1.92 (1.70–2.17), <0.001 | 2.16 (1.88–2.48), <0.001 | ||
Model 1: adjusted for age and sex. Model 2: adjusted for age, sex, alcohol consumption, smoking; history of obesity, dyslipidemia, hypertension, diabetes, chronic kidney disease; use of angiotensin‐converting enzyme inhibitor, angiotensin receptor blocker, calcium channel blocker, β blocker, diuretic, statin, insulin, metformin, sodium–glucose cotransporter 2 inhibitor, and other antidiabetic drug. Model 3: adjusted for factors in model 2 and HbA1c mean. Cox regression model with competing risk regression was used where appropriate. ASV indicates average successive variability; HbA1c, glycated hemoglobin; and HF, heart failure.
In patients with HF without diabetes, we also found that each unit change of HbA1c ASV was significantly associated with death (HR, 3.90 [95% CI, 3.31–4.61]; P<0.001) and HF rehospitalization (HR, 1.92 [95% CI, 1.70–2.17]; P<0.001) in the fully adjusted model. Similar results were observed in each unit change for HbA1c SD, which was also associated with death (HR, 4.26 [95% CI, 3.49–5.19]; P<0.001) and HF rehospitalization (HR, 2.16 [95% CI, 1.88–2.48]; P<0.001). Notably, we found a significant interaction between HbA1c variability and diabetes status, where the associations of HbA1c variability with adverse outcomes (both all‐cause death and HF rehospitalization) were more pronounced in patients without diabetes compared with those with diabetes (P interaction<0.01 for all models; Table 4).
Sensitivity Analysis
The results were similar after adjustment for blood pressure (Table S5), body mass index (Table S6), percentage change of HbA1c during the follow‐up period (Table S7) or SGLT2i use during the follow‐up period (Table S8). The results of sensitivity analyses of excluding patients with an event of HF readmission within 30 days (Table S9), event of blood transfusion (Table S10), or event of sepsis and pneumonia (Table S11) after the index date was consistent with the primary analyses. Among 65 950 patients in the entire study cohort, 354 (0.5%) did not have any clinical activities recorded after the index date. By censoring at the last clinic visit date, sensitivity analysis showed the association of HbA1c variability and the risk of all‐cause death and HF readmission remains significant (Table S12). Analysis censoring HbA1c variability before HF rehospitalization was also consistent with the previous analyses (Table S13). There were 3574 patients who developed diabetes during the follow‐up period. The sensitivity analyses censoring these patients also demonstrated that HbA1c variability was related to the risk of all‐cause death and HF readmission (Table S14). However, patients who remained nondiabetic throughout the entire follow‐up period exhibited a higher risk of HF rehospitalization and all‐cause death for each unit increment of HbA1c ASV compared with patients who developed diabetes (Table S15).
DISCUSSION
In this cohort study of 65 950 patients with HF, irrespective of diabetic status, HbA1c variability was positively correlated with all‐cause death and HF rehospitalization. The prognostic value of HbA1c variability for both all‐cause death and HF rehospitalization were more pronounced in those without diabetes.
It is common for patients with HF to have concomitant diabetes (ranges from 10% to 47%), 12 , 13 and the prevalence of both conditions are expected to increase over time. Although HF and diabetes are independently associated with adverse outcomes, having both conditions simultaneously was shown to have a worse prognosis. 14 Compared with those without diabetes, patients with diabetes had a 28% increased risk of death and 37% increased risk of HF rehospitalization as reported in a multinational cohort of 9428 patients with HF. 15 Measures that can accurately predict adverse outcome in this high‐risk group of patients (concomitant HF and diabetes) are thus clinically relevant. Rather than aiming to achieve a static and an ambiguous optimal level, emerging evidence has shown the prognostic significance of glucose fluctuation in patients with diabetes. 6 , 16 Glycemic variability in diabetes, even after adjusting for underlying HbA1c and fasting blood glucose level, consistently predicts both microvascular and macrovascular complications in patients with diabetes. 4 , 17 Beyond these complications, a post hoc analysis of the ACCORD (Action to Control Cardiovascular Risk in Diabetes) trial that included 8576 participants with diabetes further demonstrated that a greater long‐term variability in HbA1c was associated with a higher risk of HF, independent of known risk factors and changes of HbA1c level. 5 , 11 In a recent study that included 902 patients with diabetes and a background history of HF, the prognostic value of HbA1c for all‐cause death and HF readmission was further demonstrated over 42 months of follow‐up. 18 Our study, which included a substantially larger subset of patients with HF, along with multiple HbA1c assessments spanning over a long duration of follow‐up (median, 6.7 years), confirmed that a higher HbA1c variability was associated with adverse outcomes in those with diabetes. The validity of our findings were further confirmed by adjusting for several key risk factors concerning HF outcome, including the use of cardiac medications, comorbidities, and mean HbA1c level.
While the prognostic value of HbA1c variability is well established and used extensively in patients with diabetes, the role of glycemic variability in patients without diabetes has only recently been contemplated. In a primary care population of 6756 participants without diabetes or cardiovascular disease, HbA1c variability was associated with increased risk of adverse cardiovascular events and all‐cause death over a median follow‐up time of 6.3 years. 19 In a cohort that included 53 607 Chinese participants free of cardiovascular diseases, of whom 97% were nondiabetic, visit‐to‐visit variability of fasting blood glucose was associated with risk of cardiovascular disease and all‐cause death. 20 This finding was further validated in a post hoc analysis of ALLHAT (Antihypertensive and Lipid‐Lowering Treatment to Prevent Heart Attack Trial), which showed that visit‐to‐visit fasting blood glucose variability was associated with increased risk of all‐cause death in individuals with and without diabetes. 6 Another study conducted in the intensive care unit setting demonstrated that glycemic variability only predicted death among patients without diabetes (n=3142) and was neutral in patients with diabetes (n=942). 21 Intriguingly, our study not only reaffirms the prognostic value of HbA1c variability but also demonstrates that HbA1c variability has a more pronounced effect on all‐cause death and HF readmission in patients without diabetes. Although HF and diabetes often occur concomitantly, patients without diabetes constitute the majority of the HF population, ranging from 50% to 90% of all HF cases. 22 The prognostic value of HbA1c variability in patients without diabetes is clinically relevant and therefore should be considered for risk stratification and be further verified by future prospective studies.
In diabetes, intermittent hyperglycemia rather than chronic hyperglycemia, as reflected by a high glycemic variability, triggers endothelial dysfunction, reactive oxygen species production, and cytokine release, all of which may lead to subsequent cardiovascular events. 23 , 24 In the context of nondiabetes, several predisposing factors may be responsible for the higher incidence of adverse events that is observed in this study. First, in normoglycemic status, oscillating glucose levels had more significant deleterious effects than constant high glucose levels on endothelial function and oxidative stress. 24 A study has further demonstrated that following oral glucose loading, endothelium‐dependent vasodilatation, a surrogate marker for premature atherosclerosis, was suppressed in both patients with and without diabetes. 25 Second, the fluctuation in glycemic level (HbA1c and fasting blood glucose) that largely falls within the normal range may deceptively reassure patients without diabetes of low cardiovascular risk, as shown in the present as well as other studies. 19 , 20 Third, HbA1c variability could be a proxy for concomitant systemic conditions, such as generalized frailty and malnutrition, which confer cardiovascular risk in the setting of HF through parallel pathways. This motion is particularly valid as HbA1c variation primarily characterizes the changes of general condition in patients without diabetes, rather than the possibility of alteration by drugs among patients with diabetes. It should be noted that antidiabetic drug use may contribute to glycemic variability in patients with diabetes, of which the use of insulin and sulfonylurea may induce hypoglycemia and trigger adverse events like ventricular arrythmias. 14 The importance of glycemic variability and the conceived greater magnitude of risk conferred among nondiabetes (versus diabetes) deserves further evaluation.
Clinical Implication
Current management guidelines vary in the precise glycemic targets or ranges, but most recommend an HbA1c threshold of <7.0% for patients with diabetes. 26 , 27 , 28 While glycemic control has always been central in the management of HF, the optimal range and method for assessment remains contentious. A large cohort study of patients with HF and concomitant diabetes showed a U‐shaped relation between HbA1c and death, with the lowest risk in patients with moderate glycemic control (HbA1c, 7.1%–8.0%). 29 Studies on patients with diabetes have also found no differences in HF admission between the intensive (mean HbA1c, 6.4%–7.0%) and standard treatment arms (mean HbA1c, 7.3%–8.4%). 30 , 31 , 32 , 33 In addition, intense glycemic control may induce episodes of hypoglycemia, which may predispose patients to arrhythmia and other adverse cardiovascular events. 34 As such, contemporary recommendations have suggested that optimal glycemic targets for patients with diabetes and HF should be between 7% and 8%. 22 Moreover, the glycemic control strategy in these patients should be individualized, taking into consideration coexisting comorbidities, severity of HF, and the risk and benefit of tight HbA1c control. 22 Our results indicate that among individuals with HF, higher visit‐to‐visit HbA1c variability is linked to an elevated risk of all‐cause death and HF readmission independent of the influence of average blood glucose levels. The low costs and high accessibility of this biomarker also support the routine use of HbA1c measurement during follow‐up for assessment of variation in metabolic parameters and risk stratification in these patients. Recent studies have further demonstrated that strategies, such as exercise 35 and medication, including SGLT2is, 36 , 37 , 38 could potentially reduce HbA1c variability and thus should be evaluated as a therapeutic target to reduce adverse outcome in patients with HF.
Strengths and Limitations
Our study uses a territory‐wide, well‐validated health care system with full records of diagnoses, laboratory results, and drug prescriptions. The system can capture all relevant information required to preclude selection and recall biases common to conventional observational studies. 39 The validity of the current result is further enhanced by extensive adjustments for potential confounders, including but not limited to known risk factors, medications, and mean HbA1c level. The robustness of the results demonstrated in our study is further enhanced with several sensitivity analyses.
Our results should be interpreted in the context of several limitations. Echocardiographic data and clinical status of patients with HF, such as New York Heart Association functional classification, were not available in CDARS, and the differential impact of different types of HF based on left ventricular ejection fraction classification could not be assessed. Nevertheless, previous studies have shown similar prognostic value of HbA1c variability among patients with HF with diabetes irrespective of underlying left ventricular ejection fraction. 18 There is a potential bias due to the exclusion of individuals with fewer than 3 HbA1c measurements. This limitation is inherent to the study design. Similar to other administrative database, socioeconomic and smoking status at the index date, as well as anthropometric and lifestyle particulars are not systemically available in CDARS. 40 , 41 In Hong Kong, >90% of the local population visit public hospitals that capture all relevant data in the CDARS. Patients who have visited private hospitals cannot be ascertained, although this is rare as most patients who visit public hospitals tend to be followed in this setting. The percentage of individuals using SGLT2is at baseline was relatively low (3.3%) in our study population. This was primarily because the majority of HF diagnoses in our population were established before SGLT2is were officially recommended for HF treatment.
CONCLUSIONS
Our study suggests that greater HbA1c variability in patients with HF is associated with a higher risk of all‐cause death and rehospitalization. The prognostic value of HbA1c variability is more pronounced in patients without diabetes compared with those with diabetes. The use of HbA1c variability for better risk stratification in patients with HF, irrespective of underlying diabetic status, merits future evaluation.
Sources of Funding
This study was supported by Sanming Project of Medicine in Shenzhen, China (No. SZSM201911020), and Hong Kong University– Shen Zhen Hospital Fund for Shenzhen Key Medical Discipline (No. SZXK2020081). The funders of the study had no role in study design, data collection and analysis, decision to publish, or preparation of the manuscript.
Disclosures
None.
Supporting information
Tables S1–S15
Figure S1
This manuscript was sent to Tazeen H. Jafar, MD MPH, Associate Editor, for review by expert referees, editorial decision, and final disposition.
This work was presented in part at the European Society of Cardiology Heart Failure Congress, May 20–23, 2023, in Prague, Czech Republic.
Supplemental Material is available at https://www.ahajournals.org/doi/suppl/10.1161/JAHA.123.034109
For Sources of Funding and Disclosures, see page 10.
References
- 1. GBD 2017 disease and injury incidence and prevalence collaborators. Global, regional, and national incidence, prevalence, and years lived with disability for 354 diseases and injuries for 195 countries and territories, 1990–2017: a systematic analysis for the global burden of disease study 2017. Lancet. 2018;392:1789–1858. [DOI] [PMC free article] [PubMed] [Google Scholar]
- 2. Ponikowski P, Voors AA, Anker SD, Bueno H, Cleland JGF, Coats AJS, Falk V, González‐Juanatey JR, Harjola VP, Jankowska EA, et al. 2016 ESC guidelines for the diagnosis and treatment of acute and chronic heart failure. Eur Heart J. 2016;37:2129–2200. doi: 10.1093/eurheartj/ehw128 [DOI] [PubMed] [Google Scholar]
- 3. American Diabetes Association . Diagnosis and classification of diabetes mellitus. Diabetes Care. 2011;34:S62–S69. doi: 10.2337/dc11-S062 [DOI] [PMC free article] [PubMed] [Google Scholar]
- 4. Hirakawa Y, Arima H, Zoungas S, Ninomiya T, Cooper M, Hamet P, Mancia G, Poulter N, Harrap S, Woodward M, et al. Impact of visit‐to‐visit glycemic variability on the risks of macrovascular and microvascular events and all‐cause mortality in type 2 diabetes: the ADVANCE trial. Diabetes Care. 2014;37:2359–2365. doi: 10.2337/dc14-0199 [DOI] [PubMed] [Google Scholar]
- 5. Sheng C‐S, Tian J, Miao Y, Cheng Y, Yang Y, Reaven PD, Bloomgarden ZT, Ning G. Prognostic significance of long‐term HbA1c variability for all‐cause mortality in the ACCORD trial. Diabetes Care. 2020;43:1185–1190. doi: 10.2337/dc19-2589 [DOI] [PubMed] [Google Scholar]
- 6. Echouffo‐Tcheugui JB, Zhao S, Brock G, Matsouaka RA, Kline D, Joseph JJ. Visit‐to‐visit glycemic variability and risks of cardiovascular events and all‐cause mortality: the ALLHAT study. Diabetes Care. 2019;42:486–493. doi: 10.2337/dc18-1430 [DOI] [PMC free article] [PubMed] [Google Scholar]
- 7. Ren QW, Yu SY, Teng THK, Li X, Cheung KS, Wu MZ, Li HL, Wong PF, Tse HF, Lam CSP, et al. Statin associated lower cancer risk and related mortality in patients with heart failure. Eur Heart J. 2021;42:3049–3059. doi: 10.1093/eurheartj/ehab325 [DOI] [PMC free article] [PubMed] [Google Scholar]
- 8. Wong AYS, Root A, Douglas IJ, Chui CSL, Chan EW, Ghebremichael‐Weldeselassie Y, Siu CW, Smeeth L, Wong ICK. Cardiovascular outcomes associated with use of clarithromycin: population based study. BMJ (Online). 2016;352:h6926. doi: 10.1136/bmj.h6926 352 [DOI] [PubMed] [Google Scholar]
- 9. Lau WCY, Chan EW, Cheung CL, Sing CW, Man KKC, Lip GYH, Siu CW, Lam JKY, Lee ACH, Wong ICK. Association between dabigatran vs warfarin and risk of osteoporotic fractures among patients with nonvalvular atrial fibrillation. JAMA. 2017;317:1151–1158. doi: 10.1001/jama.2017.1363 [DOI] [PubMed] [Google Scholar]
- 10. Cheung KS, Chan EW, Wong AYS, Chen L, Wong ICK, Leung WK. Long‐term proton pump inhibitors and risk of gastric cancer development after treatment for helicobacter pylori: a population‐based study. Gut. 2018;67:28–35. doi: 10.1136/gutjnl-2017-314605 [DOI] [PubMed] [Google Scholar]
- 11. Segar MW, Patel KV, Vaduganathan M, Caughey MC, Butler J, Fonarow GC, Grodin JL, McGuire DK, Pandey A. Association of long‐term change and variability in glycemia with risk of incident heart failure among patients with type 2 diabetes: a secondary analysis of the ACCORD trial. Diabetes Care. 2020;43:1920–1928. doi: 10.2337/dc19-2541 [DOI] [PMC free article] [PubMed] [Google Scholar]
- 12. Bertoni AG, Hundley WG, Massing MW, Bonds DE, Burke GL, Goff DC. Heart failure prevalence, incidence, and mortality in the elderly with diabetes. Diabetes Care. 2004;27:699–703. doi: 10.2337/diacare.27.3.699 [DOI] [PubMed] [Google Scholar]
- 13. Shah AD, Langenberg C, Rapsomaniki E, Denaxas S, Pujades‐Rodriguez M, Gale CP, Deanfield J, Smeeth L, Timmis A, Hemingway H. Type 2 diabetes and incidence of cardiovascular diseases: a cohort study in 1·9 million people. Lancet Diabetes Endocrinol. 2015;3:105–113. doi: 10.1016/S2213-8587(14)70219-0 [DOI] [PMC free article] [PubMed] [Google Scholar]
- 14. Gustafsson I, Brendorp B, Seibaek M, Burchardt H, Hildebrandt P, Køber L, Torp‐Pedersen C. Influence of diabetes and diabetes‐gender interaction on the risk of death in patients hospitalized with congestive heart failure. J Am Coll Cardiol. 2004;43:771–777. doi: 10.1016/j.jacc.2003.11.024 [DOI] [PubMed] [Google Scholar]
- 15. Dauriz M, Targher G, Laroche C, Temporelli PL, Ferrari R, Anker S, Coats A, Filippatos G, Crespo‐Leiro M, Mebazaa A, et al. Association between diabetes and 1‐year adverse clinical outcomes in a multinational cohort of ambulatory patients with chronic heart failure: results from the ESC‐HFA heart failure long‐term registry. Diabetes Care. 2017;40:671–678. doi: 10.2337/dc16-2016 [DOI] [PubMed] [Google Scholar]
- 16. Adams RJ, Appleton SL, Hill CL, Wilson DH, Taylor AW, Chittleborough CR, Gill TK, Ruffin RE. Independent association of HbA(1c) and incident cardiovascular disease in people without diabetes. Obesity (Silver Spring). 2009;17:559–563. doi: 10.1038/oby.2008.592 [DOI] [PubMed] [Google Scholar]
- 17. Penno G, Solini A, Zoppini G, Orsi E, Fondelli C, Zerbini G, Morano S, Cavalot F, Lamacchia O, Trevisan R, et al. Hemoglobin A1c variability as an independent correlate of cardiovascular disease in patients with type 2 diabetes: a cross‐sectional analysis of the renal insufficiency and cardiovascular events (RIACE) Italian multicenter study. Cardiovasc Diabetol. 2013;12:98. doi: 10.1186/1475-2840-12-98 [DOI] [PMC free article] [PubMed] [Google Scholar]
- 18. Gu J, Pan J, Fan Y, Zhang H, Zhang J, Wang C. Prognostic impact of HbA1c variability on long‐term outcomes in patients with heart failure and type 2 diabetes mellitus. Cardiovasc Diabetol. 2018;17:1–11. doi: 10.1186/s12933-018-0739-3 [DOI] [PMC free article] [PubMed] [Google Scholar]
- 19. Ghouse J, Skov MW, Kanters JK, Lind B, Isaksen JL, Blanche P, Haunsø S, Køber L, Svendsen JH, Olesen MS, et al. Visit‐to‐visit variability of hemoglobin a(1c) in people without diabetes and risk of major adverse cardiovascular events and all‐cause mortality. Diabetes Care. 2019;42:134–141. doi: 10.2337/dc18-1396 [DOI] [PubMed] [Google Scholar]
- 20. Wang A, Liu X, Xu J, Han X, Su Z, Chen S, Zhang N, Wu S, Wang Y, Wang Y. Visit‐to‐visit variability of fasting plasma glucose and the risk of cardiovascular disease and all‐cause mortality in the general population. J Am Heart Assoc. 2017;6:1–11. doi: 10.1161/JAHA.117.006757 [DOI] [PMC free article] [PubMed] [Google Scholar]
- 21. Krinsley JS. Glycemic variability and mortality in critically ill patients: the impact of diabetes. J Diabetes Sci Technol. 2009;3:1292–1301. doi: 10.1177/193229680900300609 [DOI] [PMC free article] [PubMed] [Google Scholar]
- 22. Dunlay SM, Givertz MM, Aguilar D, Allen LA, Chan M, Desai AS, Deswal A, Dickson VV, Kosiborod MN, Lekavich CL, et al. Type 2 diabetes mellitus and heart failure: a scientific statement from the American heart association and the heart failure society of America: this statement does not represent an update of the 2017 ACC/AHA/HFSA heart failure guideline update. Circulation. 2019;140:e294–e324. doi: 10.1161/CIR.0000000000000691 [DOI] [PubMed] [Google Scholar]
- 23. Quagliaro L, Piconi L, Assaloni R, Martinelli L, Motz E, Ceriello A. Intermittent high glucose enhances apoptosis related to oxidative stress in human umbilical vein endothelial cells. Diabetes. 2003;52:2795–2804. doi: 10.2337/diabetes.52.11.2795 [DOI] [PubMed] [Google Scholar]
- 24. Ceriello A, Esposito K, Piconi L, Ihnat MA, Thorpe JE, Testa R, Boemi M, Giugliano D. Oscillating glucose is more deleterious to endothelial function and oxidative stress than mean glucose in normal and type 2 diabetic patients. Diabetes. 2008;57:1349–1354. doi: 10.2337/db08-0063 [DOI] [PubMed] [Google Scholar]
- 25. Kawano H, Motoyama T, Hirashima O, Hirai N, Miyao Y, Sakamoto T, Kugiyama K, Ogawa H, Yasue H. Hyperglycemia rapidly suppresses flow‐mediated endothelium‐dependent vasodilation of brachial artery. J Am Coll Cardiol. 1999;34:146–154. doi: 10.1016/S0735-1097(99)00168-0 [DOI] [PubMed] [Google Scholar]
- 26. American Diabetes Association . 6. Glycemic targets: standards of medical Care in Diabetes—2018. Diabetes Care. 2018;41:S55–S64. doi: 10.2337/dc18-S006 [DOI] [PubMed] [Google Scholar]
- 27. Conlin PR, Colburn J, Aron D, Pries RM, Tschanz MP, Pogach L. Synopsis of the 2017 U.S. Department of Veterans Affairs/U.S. Department of Defense clinical practice guideline: Management of Type 2 diabetes mellitus. Ann Intern Med. 2017;167:655. [DOI] [PubMed] [Google Scholar]
- 28. Garber AJ, Abrahamson MJ, Barzilay JI, Blonde L, Bloomgarden ZT, Bush MA, Dagogo‐Jack S, DeFronzo RA, Einhorn D, Fonseca VA, et al. Consensus statement by the American association of clinical endocrinologists and American college of endocrinology on the comprehensive type 2 diabetes management algorithm—2016 EXECUTIVE SUMMARY. Endocr Pract. 2016;22:84–113. doi: 10.4158/EP151126.CS [DOI] [PubMed] [Google Scholar]
- 29. Elder DHJ, Singh JSS, Levin D, Donnelly LA, Choy A, George J, Struthers AD, Doney ASF, Lang CC. Mean HbA1c and mortality in diabetic individuals with heart failure: a population cohort study. Eur J Heart Fail. 2016;18:94–102. doi: 10.1002/ejhf.455 [DOI] [PubMed] [Google Scholar]
- 30. Duckworth W, Abraira C, Moritz T, Reda D, Emanuele N, Reaven PD, Zieve FJ, Marks J, Davis SN, Hayward R, et al. Glucose control and vascular complications in veterans with type 2 diabetes. N Engl J Med. 2009;360:129–139. doi: 10.1056/NEJMoa0808431 [DOI] [PubMed] [Google Scholar]
- 31. Patel A, MacMahon S, Chalmers J, Neal B, Billot L, Woodward M, Marre M, Cooper M, Glasziou P, Grobbee D, et al. Intensive blood glucose control and vascular outcomes in patients with type 2 diabetes. N Engl J Med. 2008;358:2560–2572. doi: 10.1056/NEJMoa0802987 [DOI] [PubMed] [Google Scholar]
- 32. UK Prospective Diabetes Study (UKPDS) Group . Intensive blood‐glucose control with sulphonylureas or insulin compared with conventional treatment and risk of complications in patients with type 2 diabetes (UKPDS 33). Lancet. 1998;352:837–853. doi: 10.1016/S0140-6736(98)07019-6 [DOI] [PubMed] [Google Scholar]
- 33. Gerstein HC, Miller ME, Byington RP, Goff DCJ, Bigger JT, Buse JB, Cushman WC, Genuth S, Ismail‐Beigi F, Grimm RHJ, et al. Effects of intensive glucose lowering in type 2 diabetes. N Engl J Med. 2008;358:2545–2559. doi: 10.1056/NEJMoa0802743 [DOI] [PMC free article] [PubMed] [Google Scholar]
- 34. Yun J‐S, Park Y‐M, Han K, Cha S‐A, Ahn Y‐B, Ko S‐H. Severe hypoglycemia and the risk of cardiovascular disease and mortality in type 2 diabetes: a nationwide population‐based cohort study. Cardiovasc Diabetol. 2019;18:103. doi: 10.1186/s12933-019-0909-y [DOI] [PMC free article] [PubMed] [Google Scholar]
- 35. Figueira FR, Umpierre D, Casali KR, Tetelbom PS, Henn NT, Ribeiro JP, Schaan BD. Aerobic and combined exercise sessions reduce glucose variability in type 2 diabetes: crossover randomized trial. PLoS One. 2013;8:e57733. doi: 10.1371/journal.pone.0057733 [DOI] [PMC free article] [PubMed] [Google Scholar]
- 36. Fuchigami A, Shigiyama F, Kitazawa T, Okada Y, Ichijo T, Higa M, Hiyoshi T, Inoue I, Iso K, Yoshii H, et al. Efficacy of dapagliflozin versus sitagliptin on cardiometabolic risk factors in Japanese patients with type 2 diabetes: a prospective, randomized study (DIVERSITY‐CVR). Cardiovasc Diabetol. 2020;19:1. doi: 10.1186/s12933-019-0977-z [DOI] [PMC free article] [PubMed] [Google Scholar]
- 37. Danne T, Cariou B, Buse JB, Garg SK, Rosenstock J, Banks P, Kushner JA, McGuire DK, Peters AL, Sawhney S, et al. Improved time in range and glycemic variability with Sotagliflozin in combination with insulin in adults with type 1 diabetes: a pooled analysis of 24‐week continuous glucose monitoring data from the inTandem program. Diabetes Care. 2019;42:919–930. doi: 10.2337/dc18-2149 [DOI] [PMC free article] [PubMed] [Google Scholar]
- 38. Ceriello A, Ofstad AP, Zwiener I, Kaspers S, George J, Nicolucci A. Empagliflozin reduced long‐term HbA1c variability and cardiovascular death: insights from the EMPA‐REG OUTCOME trial. Cardiovasc Diabetol. 2020;19:1–7. doi: 10.1186/s12933-020-01147-9 [DOI] [PMC free article] [PubMed] [Google Scholar]
- 39. Huang J‐Y, Tse Y‐K, Li H‐L, Chen C, Zhao C‐T, Liu M‐Y, Wu M‐Z, Ren Q‐W, Yu S‐Y, Hung D, et al. Prediabetes is associated with increased risk of heart failure among patients with atrial fibrillation. Diabetes Care. 2023;46:190–196. doi: 10.2337/dc22-1188 [DOI] [PubMed] [Google Scholar]
- 40. Jensen MH, Kjolby M, Hejlesen O, Jakobsen PE, Vestergaard P. Risk of major adverse cardiovascular events, severe hypoglycemia, and all‐cause mortality for widely used antihyperglycemic dual and triple therapies for type 2 diabetes management: a cohort study of all Danish users. Diabetes Care. 2020;43:1209–1218. doi: 10.2337/dc19-2535 [DOI] [PubMed] [Google Scholar]
- 41. He M‐S, Chang F‐L, Lin H‐Z, Wu J‐L, Hsieh T‐C, Lee Y‐C. The association between diabetes and age‐related macular degeneration among the elderly in Taiwan. Diabetes Care. 2018;41:2202–2211. doi: 10.2337/dc18-0707 [DOI] [PubMed] [Google Scholar]
Associated Data
This section collects any data citations, data availability statements, or supplementary materials included in this article.
Supplementary Materials
Tables S1–S15
Figure S1