

Abstract
Background
Despite its approval for acute ischemic stroke >25 years ago, intravenous thrombolysis (IVT) remains underused, with inequities by age, sex, race, ethnicity, and geography. Little is known about IVT rates by insurance status.
Methods and Results
We assessed temporal trends from 2002 to 2015 in IVT for acute ischemic stroke in the Nationwide Inpatient Sample using adjusted, survey‐weighted logistic regression. We calculated odds ratios for IVT for each category in 2002 to 2008 (period 1) and 2009 to 2015 (period 2). IVT use for acute ischemic stroke increased from 1.0% in 2002 to 6.8% in 2015 (adjusted annual relative ratio, 1.15). Individuals aged ≥85 years had the most pronounced increase during 2002 to 2015 (adjusted annual relative ratio, 1.18) but were less likely to receive IVT compared with 18‐ to 44‐year‐olds in period 1 (adjusted odds ratio [aOR], 0.23) and period 2 (aOR, 0.36). Women were less likely than men to receive IVT, but the disparity narrowed over time (period 1: aOR, 0.81; period 2: aOR, 0.94). Inequities in IVT resolved for Hispanic individuals in period 2 (aOR, 0.96) but not for Black individuals (period 2: aOR, 0.81). The disparity in IVT for Medicare patients, compared with privately insured patients, lessened over time (period 1: aOR, 0.59; period 2: aOR, 0.75). Patients treated in rural hospitals remained less likely to receive IVT than in urban hospitals; a more dramatic increase in urbanity widened the inequity (period 2, urban nonteaching versus rural: aOR, 2.58, period 2, urban teaching versus rural: aOR, 3.90).
Conclusions
IVT for acute ischemic stroke increased among adults. Despite some encouraging trends, the remaining disparities highlight the need for intensified efforts at addressing inequities.
Keywords: epidemiology, ethnicity, inequities, sex differences, thrombolysis
Subject Categories: Epidemiology
Nonstandard Abbreviations and Acronyms
- AIS
acute ischemic stroke
- IVT
intravenous thrombolysis
- NIS
National Inpatient Sample
Clinical Perspective.
What Is New?
In the study period of 2002 to 2015, intravenous thrombolysis use for acute ischemic stroke steadily increased across all ages in adults, most prominently for those aged >85 years. Sex‐based inequities improved to near complete resolution.
The inequity for Hispanic individuals resolved; however, marked inequities in intravenous thrombolysis remain for Black individuals, individuals with Medicare and Medicaid insurance, and patients admitted to rural hospitals.
What Are the Clinical Implications?
On a regional and national level, strategies to reduce inequities include tracking intravenous thrombolysis use by sociodemographic and hospital characteristics and creating policies to reduce inequities.
At the hospital level, diversifying the workforce; ensuring that evidence‐based protocols are instituted and implemented; tracking use of intravenous thrombolysis by age, sex, race, ethnicity, and insurance status; and making targeted efforts to reduce any inequities will be key. At the provider level, key considerations include provider training on implicit bias and ensuring that care is concordant with language, literacy, and culture.
Administration of intravenous thrombolysis (IVT) with recombinant tissue plasminogen activator in appropriately selected patients with acute ischemic stroke (AIS) is associated with improved mortality rates and functional outcomes. 1 , 2 With expansion of evidence‐based systems of care, such as primary and comprehensive stroke center designation, IVT use has become more widespread over time in the United States, 3 , 4 , 5 , 6 though it remains significantly underused in eligible populations.
Additionally, marked inequities remain by sex, 7 age, 3 race and ethnicity, 7 , 8 and geographic location. 4 , 6 , 9 For example, women are less likely to receive IVT than men, and individuals admitted to rural hospitals are less likely to receive IVT than those admitted to urban hospitals. 3 , 7 While some sociodemographic inequities in IVT use have improved over the past few decades (eg, use of IVT in individuals aged ≥85 years 3 from 2005 to 2010), others remain unresolved or have worsened (eg, for women from 2007 to 2011, 7 for Black and Hispanic individuals from 2004 to 2010, 8 for all non‐White individuals from 2007 to 2011, 7 and for people living in rural areas from 2000 to 2010 4 and 2012 to 2017 9 ). Several major studies published in 2008 provided evidence of benefit of IVT during the extended time window of 3 to 4.5 hours in AIS. 1 , 10 , 11 It is unclear if there were differences in use by demographic and hospital characteristics after these studies.
Furthermore, although one could postulate that use of evidence‐based protocols would reduce disparities, a recent study revealed that presentation to a primary stroke center enhanced the rate of IVT use overall but did not alleviate racial disparities. 8
Little is known about more recent temporal trends in IVT use by sex, race, ethnicity, age, and hospital location/teaching status. Additionally, to our knowledge, differences in IVT by insurance type have not been studied in the United States. Therefore, the aim of the study was to fill these gaps by evaluating recent temporal trends in IVT among individuals with AIS, stratified by age, race, ethnicity, sex, primary insurance, hospital teaching status, and urban/rural location using data from the National Inpatient Sample (NIS) from 2002 to 2015. We hypothesized an overall increase in IVT and reduction in inequities over the study period.
Methods
Population for Study
The data that support the findings of this study are available from the corresponding author upon reasonable request. Data were obtained from the NIS, which was developed as part of the Healthcare Cost and Utilization Project. Before 2012, the survey was designed to approximate a stratified 20% sample of all US community hospitals (nonfederal, short‐term, general, and specialty hospitals) serving adults in the United States. From 2012, the sampling strategy transitioned to 20% of patient discharges from all US community hospitals excluding rehabilitation and long‐term acute care hospitals. The sampling strategy selected hospitals within states that have state inpatient databases according to defined strata on the basis of ownership, bed size, teaching status, urban/rural location, and region. 12 All discharges from sampled hospitals for the calendar year were then selected for inclusion into the NIS. To allow extrapolation for national estimates, both hospital and discharge weights are provided. Detailed information on the design of the NIS is available at http://www.hcup‐us.ahrq.gov.
The NIS captures discharge‐level information on primary and secondary diagnoses and procedures, discharge vital status, and demographics on several million discharges per year. Data elements that could directly or indirectly identify individuals are excluded. The unit of analysis is the discharge rather than the individual; all discharges are therefore considered independent. A unique anonymous hospital identifier allows for linkage of discharge data to an NIS data set with hospital characteristics. To protect subject confidentiality, NIS data provide only hospital‐specific identifiable information (eg hospital rurality but not the rurality of patient residence).
We included all patients with a primary or secondary discharge diagnosis of stroke (International Classification of Diseases, Ninth Revision, Clinical Modification [ICD‐9‐CM] diagnosis codes 433.01, 433.11, 433.21, 433.31, 433.81, 433.91, 434.01, 434.91, and 436) at the time of hospital admission, from January 2002 through September 2015. IVT administration was determined using ICD‐9 procedure code 99.10. In selecting the optimal study period, we took into consideration that the ICD underwent the Tenth Revision in the NIS in September 2015, and there have been practical concerns with converting ICD‐9 to ICD‐10. 13
We excluded patients with a diagnosis of acute myocardial infarction, pulmonary embolism, malignancy (solid tumor without metastasis, lymphoma, metastatic cancer), transferred to the index hospital from another hospital, elective admissions, cases with missing race or ethnicity or sex, and enrollment in a clinical trial (ICD‐9‐CM code V70.7). Please refer to Tables S1–S3 for the full list of ICD‐9 codes.
Sociodemographic, Clinical, and Hospital Factors
Individuals were categorized into the following age groups: <18 years, 18 to 44 years, 45 to 64 years, 65 to 84 years, and ≥85 years. This commonly used method of categorizing age in the stroke literature is also commonly used in stroke literature. 14 They were also categorized by sex (female, male, missing), race or ethnicity (White, Black, Hispanic, Asian or Pacific Islander, Native American, other, missing), primary payer (Medicare, Medicaid, private, self‐pay, no charge, other pay, missing), and hospital location/teaching status (urban teaching, urban nonteaching, rural, missing). Race or ethnicity was determined from two Healthcare Cost and Utilization Project administrative data elements of race and ethnicity. If the source supplied race and ethnicity in separate data elements, then ethnicity took precedence over race. Records with missing race or ethnicity were placed into an independent category of “Missing Race” and were included in the analysis. Risk of death was determined by the Risk of Mortality Subclass Category. 15 Presence of the following comorbid conditions was assessed: hypertension, dyslipidemia, alcohol abuse, obesity, smoking history, coronary artery disease, atrial fibrillation, and Charlson comorbidity index 16 (which consists of 17 comorbidities; Table S3). All missing data for each variable were recategorized into the “missing” category for the statistical modeling. For example, for sex, we included 3 categories: 0=“male” 1=“female” 99=“missing sex.”
Statistical Analysis
National trends were estimated following Healthcare Cost and Utilization Project methodological standards (which adopted a design change in 2012), with appropriate trend weights. The observed yearly national IVT use from 2002 to quarter 3 of 2015 was estimated using proc surveyfreq in SAS (SAS Institute, Cary, NC). For the following demographic, comorbidities, and hospital factors, we conducted national estimations by year, as well as by IVT usage status: sex, age, race, ethnicity, national quartile of household income by zip code, third‐party payer, hospital region/teaching status, coronary artery disease, atrial fibrillation or flutter, hypertension, dyslipidemia, obesity, smoking, alcohol use, Charlson comorbidity index, and Risk of Mortality Subclass. Any factors with an observed association with both year and with IVT use in univariate analysis or trend analysis meaningfully in either clinical or epidemiological ways were considered as confounders that could impact the temporal trend effects of IVT. To systematically compare temporal trends, we divided the study period 2002 to 2015 into two 7‐year periods: ‐ 2002 to 2008 (period 1) and 2009 to 2015 (period 2). The year 2008 was used for 2 reasons: first, it was the midpoint of the study period; and, second, evidence supporting the use of IVT in the 3‐ to 4.5‐hour time frame from symptom onset was published in 2008. 1 , 10 , 11 By dichotomizing the time periods, we can better evaluate if sociodemographic and hospital characteristics affected clinical practice after these publications.
The temporal trend effect in IVT was tested using survey‐weighted logistic regression models, adjusting for sex, age, race, ethnicity, national quartile of household income by zip code, insurance, hospital region, hospital location/teaching status, hypertension, diabetes, dyslipidemia, obesity, coronary artery disease, peripheral artery disease, atrial fibrillation, congestive heart failure, Charlson comorbidity index, smoking history, and alcohol history. In addition to the linear temporal trend, we compared the first and second 7‐year periods (period 1 versus period 2) adjusting for the same covariates. For temporal trends in subgroups, we used the survey‐weighted logistic regression procedure with subgroup categories in the DOMAIN statement (https://www.hcupus.ahrq.gov/reports/methods/2003_02.jsp#sas) to request statistics for the subpopulation. All data analyses were conducted using SAS version 9.4. The study was considered exempt from institutional review board approval given the use of deidentified information. We followed the Strengthening the Reporting of Observational Studies in Epidemiology reporting guideline. 17
Results
Among patients admitted with a diagnosis of AIS (weighted n=6 694 081), approximately half were aged 65 to 84 years (50.5%), just under a quarter were aged 45 to 64 years (24.0%), and 21.5% were aged ≥85 years of age (Table 1). More than half of the study population were women (53.9%). The racial and ethnic distribution was as follows: White (58.9%), Black (14.5%), Hispanic (6.6%), Asian or Pacific Islander (2.2%), and other (2.1%). Nearly two thirds of patients had comorbid hypertension (61.4%), and approximately 1 in 4 had diabetes (26.6%), coronary artery disease (23.9%), or atrial fibrillation (22.4%). Medicare was the most common insurance type (70.3%), followed by private (16.8%) and Medicaid (6.7%). The distribution by geography was as follows: South (41.0%), Midwest (22.0%), Northeast (18.5%), and West (18.5%).
Table 1.
Patient and Hospital Characteristics of Overall Cohort (Weighted N=6 694 081, Unweighted N=1 568 655)
| Weighted N | % (Mean±SE) | |
|---|---|---|
| Age, y | ||
| <18 | 17 097 | 0.3±0.01 |
| 18–44 | 254 399 | 3.8±0.03 |
| 45–64 | 1 606 396 | 24.0±0.09 |
| 65–84 | 3 379 649 | 50.5±0.07 |
| ≥85 | 1 436 540 | 21.5±0.07 |
| Sex | ||
| Women | 3 606 177 | 53.9±0.06 |
| Men | 3 086 823 | 46.1±0.06 |
| Missing | 1081 | 0.02±0 |
| Race or ethnicity | ||
| White | 3 942 986 | 58.9±0.4 |
| Black | 971 841 | 14.5±0.2 |
| Hispanic | 441 458 | 6.6±0.2 |
| Asian or Pacific islander | 149 256 | 2.2±0.06 |
| Native American | 22 736 | 0.3±0.02 |
| Other | 138 349 | 2.1±0.08 |
| Missing | 1 027 454 | 15.4±0.4 |
| Comorbidities | ||
| Hypertension | 4 107 033 | 61.4±0.08 |
| Diabetes | 1 783 535 | 26.6±0.07 |
| Dyslipidemia | 2 740 402 | 40.9±0.2 |
| Coronary artery disease | 1 601 515 | 23.9±0.08 |
| Atrial fibrillation | 1 501 288 | 22.4±0.07 |
| Congestive heart failure | 1 043 455 | 15.6±0.06 |
| Peripheral artery disease | 60 065 | 0.9±0.01 |
| Obesity | 451 209 | 6.7±0.04 |
| Smoking | 575 040 | 8.6±0.07 |
| Alcohol abuse | 150 854 | 2.3±0.02 |
| Charlson comorbidity index | ||
| 0 | 5 160 840 | 77.1±0.06 |
| 1 | 1 013 298 | 15.1±0.05 |
| 2 | 361 693 | 5.4±0.03 |
| 3+ | 158 250 | 2.4±0.02 |
| Risk of death subclass | ||
| Minor | 1 619 730 | 24.2±0.09 |
| Moderate | 2 845 438 | 42.5±0.1 |
| Major | 1 365 900 | 20.4±0.06 |
| Extreme | 814 571 | 12.2±0.06 |
| Missing | 47 737 | 0.7±0.1 |
| Insurance | ||
| Medicare | 4 702 599 | 70.3±0.1 |
| Medicaid | 451 058 | 6.7±0.07 |
| Private (including HMO) | 1 122 618 | 16.8±0.1 |
| Self‐pay | 257 539 | 3.9±0.05 |
| No charge | 25 637 | 0.4±0.02 |
| Other pay | 124 216 | 1.9±0.04 |
| Missing | 10 414 | 0.2±0.01 |
| Household income | ||
| <$45 000 | 1 835 301 | 27.4±0.3 |
| $45 000–$60 000 | 1 681 387 | 25.1±0.2 |
| $60 000–$80 000 | 1 570 078 | 23.5±0.2 |
| >$80 000 | 1 464 540 | 21.9±0.3 |
| Missing | 142 775 | 2.1±0.05 |
| Hospital location/teaching status | ||
| Rural | 870 369 | 13.0±0.2 |
| Urban nonteaching | 2 844 987 | 42.5±0.3 |
| Urban teaching | 2 953 365 | 44.1±0.4 |
| Geographic region | ||
| Northeast | 1 237 316 | 18.5±0.3 |
| Midwest | 1 472 593 | 22.0±0.3 |
| South | 2 745 210 | 41.0±0.4 |
| West | 1 238 961 | 18.5±0.3 |
HMO indicates health maintenance organization.
The overall use of IVT for AIS increased from 1.0% in 2002 to 6.8% in 2015, with an overall adjusted annual relative ratio, of 1.15 (95% CI, 1.14–1.16). Individuals aged 18 to 44 years had the highest rate of IVT during the entire period starting in 2003 (Figure 1). Figure 2A through 2E delineates dichotomized comparisons of IVT use for AIS between period 1 versus period 2 by age, sex, race, ethnicity, insurance, and hospital location/teaching status. Adults aged ≥18 years had an increase in IVT over time, with those aged ≥85 years having the most pronounced increase (adjusted annual relative ratio, 1.18 [95% CI, 1.17–1.19]; period 2 versus period 1: adjusted odds ratio [aOR], 3.66 [95% CI, 3.3–4.07]; Table 2). However, compared with those aged 18 to 44 years, those who were aged ≥85 years were still markedly less likely to receive IVT in both period 1 (aOR, 0.23 [95% CI, 0.21–0.26]) and period 2 (aOR, 0.36 [95% CI, 0.34–0.38]; Table 3). IVT underuse existed, but to a lesser extent, in those aged 45 to 64 and 65 to 84 years in period 1, with aORs of 0.64 (95% CI, 0.59–0.7) and 0.42 (95% CI, 0.38–0.45) when compared with individuals aged 18 to 44 years (Table 3). The disparity in the older age groups marginally improved in period 2, with an aOR of 0.69 (95% CI 0.65–0.72) and 0.47 (95% CI 0.45–0.50), respectively. Minors (age<18 years) had the second lowest rate of IVT in period 1 and the lowest in period 2 (Table 2). They were the only age group without a significant increase in IVT use over time (adjusted annual relative ratio, 0.95 [95% CI, 0.88–1.03]; period 2 versus period 1: aOR, 0.94 [95% CI, 0.49–1.77]; Table 2).
Figure 1. Proportion of patients with AIS who received IVT by age from 2002 to 2015 (unadjusted).
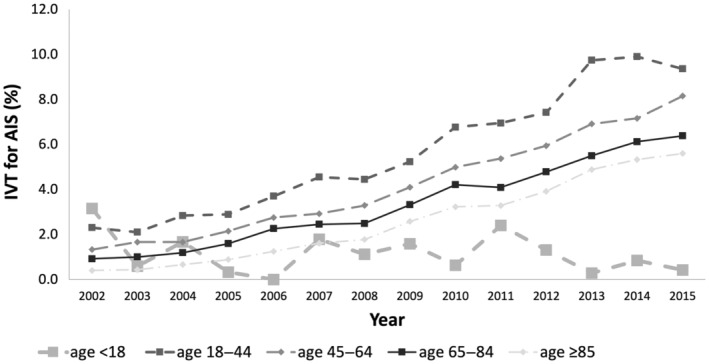
AIS indicates acute ischemic stroke; and IVT, intravenous thrombolysis.
Figure 2. Dichotomized comparison of IVT use by age, sex, race/ethnicity, insurance, and hospital location/teaching status.
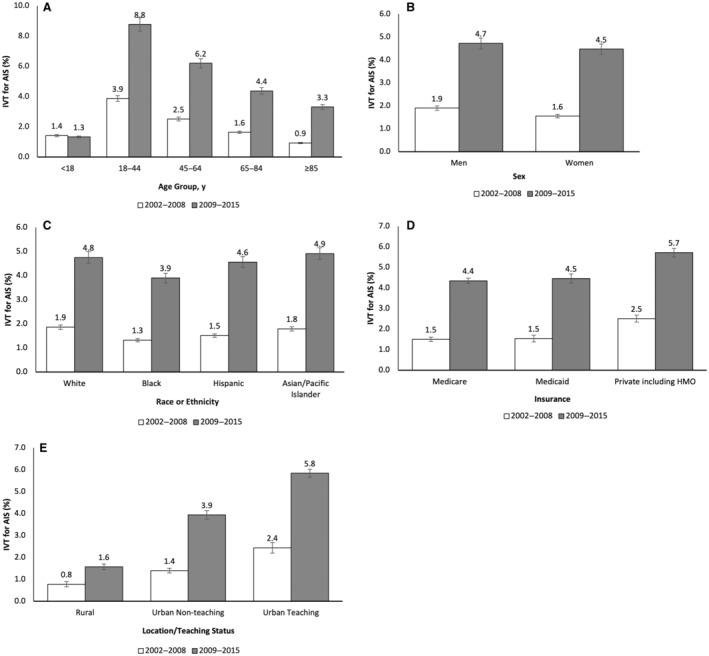
A, Dichotomized comparison of IVT use between period 1 vs period 2 by age. B, Dichotomized comparison of IVT use between period 1 vs period 2 by sex. C, Dichotomized comparison of IVT use between period 1 vs period 2 by race or ethnicity. D, Dichotomized comparison of IVT use between period 1 vs period 2 by insurance. E, Dichotomized comparison of IVT use between period 1 vs period 2 by hospital location/teaching status. *Adjusted for female sex, age, race, ethnicity, national quartile of household income by zip code, insurance, hospital region, hospital location/teaching status, hypertension, diabetes, dyslipidemia, obesity, coronary artery disease, peripheral artery disease, atrial fibrillation, congestive heart failure, Charlson comorbidity index, smoking history, and alcohol history. AIS indicates acute ischemic stroke; HMO, health maintenance organization; and IVT, intravenous thrombolysis.
Table 2.
Rate of IVT From 2002 to 2015 by Age Groups, Race or Ethnicity, Sex, Insurance, and Hospital Location/Teaching Status
| Rate of IVT use, % (95% CI) | aOR* (95% CI) | aARR† (95% CI) | ||
|---|---|---|---|---|
| Period 1 (2002–2008) | Period 2 (2009–2015) | Period 2 vs period 1 (2009–2015 vs 2002–2008) | 2002–2015 | |
| Age, y | ||||
| <18 | 1.42 (0.72–2.11) | 1.33 (0.81–1.84) | 0.94 (0.49–1.77) | 0.95 (0.88–1.03) |
| 18–44 | 3.87 (3.51–4.23) | 8.77 (8.36–9.19) | 2.39 (2.14–2.67) | 1.13 (1.11–1.14) |
| 45–64 | 2.51 (2.34–2.69) | 6.2 (6.01–6.39) | 2.56 (2.37–2.77) | 1.14 (1.13–1.15) |
| 65–84 | 1.64 (1.53–1.75) | 4.37 (4.23–4.5) | 2.74 (2.53–2.95) | 1.14 (1.13–1.15) |
| ≥85 | 0.93 (0.84–1.01) | 3.31 (3.17–3.44) | 3.66 (3.3–4.07) | 1.18 (1.17–1.19) |
| Sex | ||||
| Women | 1.55 (1.44–1.66) | 4.47 (4.33–4.6) | 2.98 (2.75–3.23) | 1.16 (1.15–1.17) |
| Men | 1.9 (1.78–2.02) | 4.72 (4.57–4.86) | 2.56 (2.38–2.76) | 1.14 (1.13–1.15) |
| Race or ethnicity | ||||
| White | 1.86 (1.71–2) | 4.75 (4.62–4.88) | 2.63 (2.42–2.86) | 1.14 (1.13–1.15) |
| Black | 1.32 (1.15–1.49) | 3.9 (3.73–4.07) | 3.03 (2.65–3.48) | 1.16 (1.14–1.18) |
| Hispanic | 1.51 (1.27–1.74) | 4.56 (4.31–4.81) | 3.13 (2.66–3.69) | 1.17 (1.15–1.19) |
| Asian or Pacific Islander | 1.79 (1.4–2.17) | 4.91 (4.54–5.27) | 2.84 (2.28–3.52) | 1.15 (1.13–1.18) |
| Other | 1.69 (1.41–1.96) | 5.17 (4.82–5.52) | 3.18 (2.65–3.81) | 1.15 (1.13–1.18) |
| Insurance | ||||
| Medicare | 1.5 (1.39–1.6) | 4.35 (4.21–4.48) | 2.99 (2.76–3.24) | 1.15 (1.14–1.16) |
| Medicaid | 1.54 (1.38–1.7) | 4.46 (4.23–4.68) | 2.97 (2.65–3.33) | 1.15 (1.13–1.16) |
| Private (including HMO) | 2.51 (2.34–2.68) | 5.72 (5.51–5.92) | 2.36 (2.18–2.55) | 1.13 (1.12–1.14) |
| Other pay | 1.96 (1.75–2.16) | 4.69 (4.45–4.93) | 2.47 (2.19–2.77) | 1.14 (1.12–1.16) |
| Hospital location/teaching status | ||||
| Rural | 0.78 (0.66–0.9) | 1.57 (1.43–1.7) | 2.02 (1.72–2.38) | 1.11 (1.09–1.13) |
| Urban nonteaching | 1.40 (1.29–1.5) | 3.94 (3.74–4.14) | 2.90 (2.66–3.16) | 1.17 (1.16–1.18) |
| Urban teaching | 2.44 (2.19–2.68) | 5.84 (5.66–6.02) | 2.48 (2.23–2.76) | 1.13 (1.12–1.15) |
aARR indicates adjusted annual relative ratio; aOR, adjusted odds ratio; HMO, health maintenance organization; and IVT, intravenous thrombolysis.
Adjusted odds ratio of receiving IVT comparing 2009 to 2015 vs 2002 to 2008. Adjusted for female sex, age, race, ethnicity, national quartile of household income by zip code, insurance, hospital region, hospital location/teaching status, hypertension, diabetes, dyslipidemia, obesity, coronary artery disease, peripheral artery disease, and atrial fibrillation.
Slope of log linear of IVT administration from 2002 to 2015. Adjusted for female sex, age, race, ethnicity, national quartile of household income by zip code, insurance, hospital region, hospital location/teaching status, hypertension, diabetes, dyslipidemia, obesity, coronary artery disease, peripheral artery disease, atrial fibrillation.
Table 3.
Comparison of the Rate of IVT Use Within Age, Race or Ethnicity, Sex, Insurance, and Hospital Location/Teaching Status, in 2002 to 2008 and 2009 to 2015
| aOR* for IVT use (95% CI) | ||
|---|---|---|
| Period 1 (2002–2008) | Period 2 (2009–2015) | |
| Age, y | ||
| <18 | 0.36 (0.21–0.59) | 0.14 (0.09–0.21) |
| 18–44 | Reference | Reference |
| 45–64 | 0.64 (0.59–0.70) | 0.69 (0.65–0.72) |
| 65–84 | 0.42 (0.38–0.45) | 0.47 (0.45–0.50) |
| ≥85 | 0.23 (0.21–0.26) | 0.36 (0.34–0.38) |
| Sex | ||
| Women | 0.81 (0.78–0.84) | 0.94 (0.92–0.97) |
| Men | Reference | Reference |
| Race or ethnicity | ||
| White | Reference | Reference |
| Black | 0.71 (0.63–0.79) | 0.81 (0.78–0.85) |
| Hispanic | 0.81 (0.69–0.94) | 0.96 (0.91–1.02) |
| Asian or Pacific Islander | 0.96 (0.78–1.19) | 1.04 (0.96–1.12) |
| Other | 0.91 (0.77–1.07) | 1.09 (1.02–1.18) |
| Insurance | ||
| Medicare | 0.59 (0.56–0.62) | 0.75 (0.72–0.77) |
| Medicaid | 0.61 (0.55–0.67) | 0.77 (0.73–0.81) |
| Private (including HMO) | Reference | Reference |
| Other pay | 0.78 (0.70–0.85) | 0.81 (0.77–0.85) |
| Hospital location/teaching status | ||
| Rural | Reference | Reference |
| Urban nonteaching | 1.80 (1.52–2.12) | 2.58 (2.33–2.85) |
| Urban teaching | 3.17 (2.65–3.80) | 3.90 (3.55–4.28) |
aOR indicates adjusted odds ratio; HMO, health maintenance organization; and IVT, intravenous thrombolysis.
Adjusted odds ratio of receiving IVT comparing 2009–2015 vs 2002–2008. Adjusted for female sex, age, race, ethnicity, national quartile of household income by zip code, insurance, hospital region, hospital location/teaching status, hypertension, diabetes, dyslipidemia, obesity, coronary artery disease, peripheral artery disease, atrial fibrillation.
Women were less likely than men to receive IVT in period 1 (aOR, 0.81 [95% CI, 0.78–0.84]; Table 3); this inequity narrowed such that women remained slightly less likely than men to receive IVT in period 2 (aOR, 0.94 [95% CI, 0.92–0.97]; Table 3). Compared with period 1, women in period 2 were about 3 times more likely to receive IVT (aOR, 2.98 [95% CI, 2.75–3.23]; Table 2).
Across all races and ethnicities, IVT rates increased over time (Table 2). Individuals were more likely to receive IVT in period 2 versus period 1 (White population: aOR, 2.63 [95% CI, 2.42–2.86]; Black population: aOR, 3.03 [95% CI, 2.65–3.48]; Hispanic population: aOR, 3.13 [95% CI, 2.66–3.69]; Asian or Pacific Islander population: aOR, 2.84 [95% CI, 2.28–3.52]; other race or ethnicity: aOR, 3.18 [95% CI, 2.65–3.81]; Table 2). In period 1, Hispanic individuals were less likely than their non‐Hispanic White counterparts to receive IVT (aOR, 0.81 [95% CI, 0.69–0.94]; Table 3), but the inequity resolved in period 2 (aOR, 0.96 [95% CI, 0.91–1.02]; Table 3). Inequities in IVT for Black compared with White individuals with stroke improved without resolving. In period 1, compared with White individuals, Black individuals were less likely to receive IVT (period 1: aOR, 0.71 [95% CI, 0.63–0.79]; period 2: aOR, 0.81 [95% CI, 0.78–0.85]; Table 3).
The use of IVT increased over time for Medicare beneficiaries. Compared with period 1, those with Medicare were 3 times more likely to receive IVT in period 2 (aOR, 2.99 [95% CI, 2.76–3.24]; Table 2). In period 1, compared with those who were privately insured, individuals with Medicare were less likely to receive IVT, even accounting for age (aOR, 0.59 [95% CI, 0.56–0.62]; Table 3). This disparity improved but persisted in period 2 (aOR, 0.75 [95% CI, 0.72–0.77]; Table 3). Those with Medicaid insurance had a similar trend of improvement of IVT rates over time (period 2 versus period 1: aOR, 2.97 [95% CI, 2.65–3.33]; Table 2). They were less likely to receive IVT than their counterparts with private insurance, but this inequity was reduced over time (period 1: aOR, 0.61 [95% CI, 0.55–0.67]; period 2: aOR, 0.77 [95% CI, 0.73–0.81]; Table 3).
Compared with those treated at rural hospitals, individuals treated at urban nonteaching and urban teaching hospitals were more likely to receive IVT in period 1 (urban nonteaching versus rural: aOR, 1.80 [95% CI, 1.52–2.12]; urban teaching versus rural: aOR, 3.17 [95% CI, 2.65–3.80]; Table 3). Over time, IVT use increased in both rural and urban hospitals, but at a higher rate in urban hospitals, thus increasing the disparities in period 2 (urban nonteaching versus rural: aOR, 2.58 [95% CI, 2.33–2.85]; urban teaching versus rural: aOR, 3.90 [95% CI, 3.55–4.28]; Table 3), with period 2 versus period 1 aORs of 2.90 (95% CI, 2.66–3.16) and 2.48 (95% CI, 2.23–2.76) for urban nonteaching and urban teaching hospitals, respectively (Table 2).
Discussion
This is the first study to assess temporal trends in IVT in the United States by numerous key sociodemographic and geographic characteristics, including race, ethnicity, sex, age, insurance, hospital teaching status, and geographic location. This study confirms steadily increasing IVT use across all ages in adults, with the fastest growth in those aged >85 years. The sex inequity in IVT improved to near complete resolution in the second half of the study period. Inequities in IVT for Hispanic individuals resolved. Marked inequities in IVT remain for Black individuals despite improvements over time. Individuals with Medicare and Medicaid insurance remained less likely to receive IVT compared with privately insured individuals, despite modest improvements over time. The inequities by geographic location continued to worsen, such that those admitted to rural hospitals were nearly 3 times less likely to receive IVT compared with those admitted to urban nonteaching hospitals and nearly 4 times less likely to receive IVT compared with those admitted to urban teaching hospitals, a finding consistent with recently published data. 9
Individuals aged ≥85 years with AIS had the steepest relative growth in IVT. This corroborates a previous study examining trends from 2005 to 2010, 3 where individuals aged ≥85 years showed the most rapid increase in IVT, mostly in urban and high‐volume hospitals. Similarly, a study using Get With The Guidelines–Stroke data 18 and a recent study in Austria 19 from their national Stroke Unit Registry noted a similarly dramatic increase in patients aged >85 years and >80 years. Despite the increase in IVT, its absolute rates of use remained low in this age group. It is unclear whether this is due to patients presenting outside the therapeutic window, inability to determine last known well time in those who live alone, concerns about adverse events, or contraindications due to comorbidities. The underuse of IVT in individuals aged <18 is likely due to limited evidence of efficacy in this age group, lack of Food and Drug Administration approval, atypical presentations, and lower index of suspicion for stroke.
This is the first study to show resolution of disparities in IVT for Hispanic individuals. However, race inequities remain. This study corroborates a previous NIS study that showed that Black individuals were less likely to receive IVT than White individuals. 7 , 8 A previous study using the NIS database in 2004 to 2010 noted underadministration in Black patients regardless of presentation to primary stroke centers. 8 Potential reasons for the marked disparity for Black individuals could include provider implicit bias or discrimination 20 or longer time to presentation from factors such as poor access to care, 21 , 22 medical mistrust, 23 and differences in stroke preparedness (ie, the ability to recognize signs and symptoms of stroke, knowledge to call 911, and action to call 911). 24 , 25 It could also be due to systematic differences in quality of care at hospitals where Black patients most often present. 7
This study is the first to show an improvement in sex disparities in IVT. It is widely recognized that women are less likely to receive IVT compared with men. Factors contributing to sex differences in thrombolytic rates for women include delays in presentation, 26 atypical presentations, 27 underlying system‐level factors, 7 inability to determine last known well time, and provider bias. 28 More research is needed to determine what has led to the reductions in sex differences, but more widespread use of stroke pathways may be a factor.
This study is the first to evaluate nationwide temporal trends in receipt of IVT by insurance type. The profound differences in IVT use by insurance type highlight the need to expand health care access and improve quality of care for those with government insurance. An example of an initiative that was successful in augmenting use of IVT was the Target: Stroke Quality Initiative, 29 which led to a quicker administration of IVT with better long‐term outcomes in Medicare beneficiaries.
This study confirms a persistent trend of worsening rural–urban disparities in IVT for AIS in the early 21st century. 4 , 6 , 9 This widening disparity occurred with the steady temporal growth in IVT use in urban teaching hospitals; use of IVT in rural hospitals fluctuated in young patients aged 19–44 years with AIS from 2001 to 2009. 6 A study from 2012 to 2017 demonstrated a persistent, steady gap in IVT use for rural populations. 9 The widening urban–rural gap could be explained by poor hospital and emergency medical services staffing, access to specialists, long distance to stroke centers, and stroke literacy. These issues could be mitigated by expansion of telestroke networks 30 and community outreach.
These sociodemographic and geographic inequities are likely due to individual, system, and societal factors 3 , 4 , 6 , 7 , 8 , 9 , 31 ; therefore, a multipronged approach is needed to address them. Barriers to elimination of inequities include (1) fundamental drivers of inequities, namely,, unequal distribution of wealth, education, and employment opportunities; (2) historical and ongoing structural and systemic racism, which have disproportionately burdened Black communities with poverty, food insecurity, housing instability, and other adverse social determinants of health, and led to the likelihood of Black individuals having poor access to care 22 , 32 or receiving care in underresourced, underperforming hospitals; (3) ineffective messaging around stroke symptoms in lower‐income, Black, and Hispanic populations 24 , 25 ; (4) provider‐level factors, such as unconscious bias, 33 racism, 34 and hesitancy to treat the elderly with IVT 3 ; (5) patient‐level factors, such as women being more likely to live alone 26 and delays in presentation 21 ; and (6) clinical factors such as atypical clinical presentations. 27
The study is limited by its cross‐sectional design and lack of patient‐level zip codes and stroke‐specific data such as hospital stroke center designation, last known well times, and stroke severity. Importantly, the national database does not provide the level of detail needed to determine IVT contraindications (eg, time since prior neurosurgery, head trauma, stroke, imaging findings, current anticoagulant use) and individualized considerations for IVT use (eg, personal/goals of care). The ascertained disparities in IVT could have been driven by differences in prevalence of these factors rather than race or ethnicity. Additionally, administrative data (eg, race, ethnicity, diagnosis) are prone to misclassification and coding errors. We excluded individuals who were transferred in, so we may have underestimated IVT rates. However, hospitals usually provide IVT before transfer, so we suspect these numbers are low. The strengths of this study include that it is nationally representative, with key hospital‐level factors, sociodemographic characteristics, and comorbidities.
Further studies are needed to develop an understanding of reasons underlying persistent inequities as well as recent improvements (eg, resolution in inequities faced by Hispanic individuals). It will be critical to elucidate the extent to which these inequities are caused by system‐, provider‐, society‐, and patient‐level factors. Developing a more nuanced understanding of the causes for persistent inequities in IVT will inform the development of effective interventions for reducing them.
Conclusions
From 2002 through 2015, IVT for AIS in the United States increased steadily in various strata, with some encouraging trends of rapidly growing use of IVT among individuals aged ≥85 years and a resolution of disparities for Hispanic individuals. Despite these encouraging trends, only 1 in 15 patients with AIS received IVT, and inequities remain for Black patients, women, those with Medicaid or Medicare insurance, and individuals admitted to rural hospitals. Further studies can help us better understand these trends and design interventions aimed at eliminating inequities in IVT for AIS.
Sources of Funding
Dr Joynt Maddox receives research support from the National Heart, Lung, and Blood Institute (R01HL143421 and R01HL164561), National Institute of Nursing Research (U01NR020555) National Institute on Aging (R01AG060935, R01AG063759, and R21AG065526), and National Center for Advancing Translational Sciences (UL1TR002345) and from Humana. Dr Towfighi receives research support from the National Institute of Neurological Disorders and Stroke (R01NS093870) and National Institute of Minority Health and Health Disparities (P50MD017366).
Disclosures
Dr Joynt Maddox serves on the Health Policy Advisory Council for the Centene Corporation (St. Louis, MO) and as an Associate Editor for the Journal of the American Medical Association (JAMA).
Supporting information
Data S1
This manuscript was sent to Monik C. Jiménez, SM, ScD, Associate Editor, for review by expert referees, editorial decision, and final disposition.
Preprint posted on MedRxiv October 10, 2023. doi: https://doi.org/10.1101/2023.10.09.23296783.
Supplemental Material is available at https://www.ahajournals.org/doi/suppl/10.1161/JAHA.123.033316
For Sources of Funding and Disclosures, see page 9.
References
- 1. Hacke W, Kaste M, Bluhmki E, Brozman M, Davalos A, Guidetti D, Larrue V, Lees KR, Medeghri Z, Machnig T, et al. Thrombolysis with alteplase 3 to 4.5 hours after acute ischemic stroke. N Engl J Med. 2008;359:1317–1329. doi: 10.1056/NEJMoa0804656 [DOI] [PubMed] [Google Scholar]
- 2. National Institute of Neurological D, Stroke rt PASSG . Tissue plasminogen activator for acute ischemic stroke. N Engl J Med. 1995;333:1581–1587. doi: 10.1056/NEJM199512143332401 [DOI] [PubMed] [Google Scholar]
- 3. George BP, Asemota AO, Dorsey ER, Haider AH, Smart BJ, Urrutia VC, Schneider EB. United States trends in thrombolysis for older adults with acute ischemic stroke. Clin Neurol Neurosurg. 2015;139:16–23. doi: 10.1016/j.clineuro.2015.08.031 [DOI] [PubMed] [Google Scholar]
- 4. Gonzales S, Mullen MT, Skolarus L, Thibault DP, Udoeyo U, Willis AW. Progressive rural‐urban disparity in acute stroke care. Neurology. 2017;88:441–448. doi: 10.1212/WNL.0000000000003562 [DOI] [PMC free article] [PubMed] [Google Scholar]
- 5. Joo H, Wang G, George MG. Use of intravenous tissue plasminogen activator and hospital costs for patients with acute ischaemic stroke aged 18‐64 years in the USA. Stroke Vasc Neurol. 2016;1:8–15. doi: 10.1136/svn-2015-000002 [DOI] [PMC free article] [PubMed] [Google Scholar]
- 6. Kansara A, Chaturvedi S, Bhattacharya P. Thrombolysis and outcome of young stroke patients over the last decade: insights from the Nationwide Inpatient Sample. J Stroke Cerebrovasc Dis. 2013;22:799–804. doi: 10.1016/j.jstrokecerebrovasdis.2012.05.002 [DOI] [PubMed] [Google Scholar]
- 7. Faigle R, Urrutia VC, Cooper LA, Gottesman RF. Individual and system contributions to race and sex disparities in thrombolysis use for stroke patients in the United States. Stroke. 2017;48:990–997. doi: 10.1161/STROKEAHA.116.015056 [DOI] [PMC free article] [PubMed] [Google Scholar]
- 8. Aparicio HJ, Carr BG, Kasner SE, Kallan MJ, Albright KC, Kleindorfer DO, Mullen MT. Racial disparities in intravenous recombinant tissue plasminogen activator use persist at primary stroke centers. J Am Heart Assoc. 2015;4:e001877. doi: 10.1161/JAHA.115.001877 [DOI] [PMC free article] [PubMed] [Google Scholar]
- 9. Hammond G, Luke AA, Elson L, Towfighi A, Joynt Maddox KE. Urban‐rural inequities in acute stroke care and in‐hospital mortality. Stroke. 2020;51:2131–2138. doi: 10.1161/STROKEAHA.120.029318 [DOI] [PubMed] [Google Scholar]
- 10. Wahlgren N, Ahmed N, Davalos A, Hacke W, Millan M, Muir K, Roine RO, Toni D, Lees KR; SITS investigators . Thrombolysis with alteplase 3‐4.5 h after acute ischaemic stroke (SITS‐ISTR): an observational study. Lancet. 2008;372:1303–1309. doi: 10.1016/S0140-6736(08)61339-2 [DOI] [PubMed] [Google Scholar]
- 11. Davis SM, Donnan GA, Parsons MW, Levi C, Butcher KS, Peeters A, Barber PA, Bladin C, De Silva DA, Byrnes G, et al. Effects of alteplase beyond 3 h after stroke in the Echoplanar Imaging Thrombolytic Evaluation Trial (EPITHET): a placebo‐controlled randomised trial. Lancet Neurol. 2008;7:299–309. doi: 10.1016/S1474-4422(08)70044-9 [DOI] [PubMed] [Google Scholar]
- 12. HCUP National Inpatient Sample (NIS) . Healthcare Cost and Utilization Project (HCUP). Agency for Healthcare Research and Quality. 2006‐2017. Accessed 03/01. www.hcup‐us.ahrq.gov/nisoverview.jsp.
- 13. Krive J, Patel M, Gehm L, Mackey M, Kulstad E, Li JJ, Lussier YA, Boyd AD. The complexity and challenges of the international classification of diseases, ninth revision, clinical modification to international classification of diseases, 10th revision, clinical modification transition in EDs. Am J Emerg Med. 2015;33:713–718. doi: 10.1016/j.ajem.2015.03.001 [DOI] [PMC free article] [PubMed] [Google Scholar]
- 14. Bako AT, Pan A, Potter T, Tannous J, Johnson C, Baig E, Meeks J, Woo D, Vahidy FS. Contemporary trends in the nationwide incidence of primary intracerebral hemorrhage. Stroke. 2022;53:e70–e74. doi: 10.1161/STROKEAHA.121.037332 [DOI] [PubMed] [Google Scholar]
- 15. McCormick PJ, Lin HM, Deiner SG, Levin MA. Validation of the all patient refined diagnosis related group (APR‐DRG) risk of mortality and severity of illness modifiers as a measure of perioperative risk. J Med Syst. 2018;42:81. doi: 10.1007/s10916-018-0936-3 [DOI] [PMC free article] [PubMed] [Google Scholar]
- 16. Deyo RA, Cherkin DC, Ciol MA. Adapting a clinical comorbidity index for use with ICD‐9‐CM administrative databases. J Clin Epidemiol. 1992;45:613–619. doi: 10.1016/0895-4356(92)90133-8 [DOI] [PubMed] [Google Scholar]
- 17. von Elm E, Altman DG, Egger M, Pocock SJ, Gotzsche PC, Vandenbroucke JP, Initiative S. The Strengthening the Reporting of Observational Studies in Epidemiology (STROBE) statement: guidelines for reporting observational studies. Ann Intern Med. 2007;147:573–577. doi: 10.7326/0003-4819-147-8-200710160-00010 [DOI] [PubMed] [Google Scholar]
- 18. Schwamm LH, Ali SF, Reeves MJ, Smith EE, Saver JL, Messe S, Bhatt DL, Grau‐Sepulveda MV, Peterson ED, Fonarow GC. Temporal trends in patient characteristics and treatment with intravenous thrombolysis among acute ischemic stroke patients at Get With The Guidelines‐Stroke hospitals. Circ Cardiovasc Qual Outcomes. 2013;6:543–549. doi: 10.1161/CIRCOUTCOMES.111.000303 [DOI] [PubMed] [Google Scholar]
- 19. Marko M, Posekany A, Szabo S, Scharer S, Kiechl S, Knoflach M, Serles W, Ferrari J, Lang W, Sommer P, et al. Trends of r‐tPA (recombinant tissue‐type plasminogen activator) treatment and treatment‐influencing factors in acute ischemic stroke. Stroke. 2020;51:1240–1247. doi: 10.1161/STROKEAHA.119.027921 [DOI] [PubMed] [Google Scholar]
- 20. Green AR, Carney DR, Pallin DJ, Ngo LH, Raymond KL, Iezzoni LI, Banaji MR. Implicit bias among physicians and its prediction of thrombolysis decisions for black and white patients. J Gen Intern Med. 2007;22:1231–1238. doi: 10.1007/s11606-007-0258-5 [DOI] [PMC free article] [PubMed] [Google Scholar]
- 21. Bradley EH, Herrin J, Wang Y, McNamara RL, Webster TR, Magid DJ, Blaney M, Peterson ED, Canto JG, Pollack CV Jr, et al. Racial and ethnic differences in time to acute reperfusion therapy for patients hospitalized with myocardial infarction. JAMA. 2004;292:1563–1572. doi: 10.1001/jama.292.13.1563 [DOI] [PubMed] [Google Scholar]
- 22. Skinner J, Chandra A, Staiger D, Lee J, McClellan M. Mortality after acute myocardial infarction in hospitals that disproportionately treat black patients. Circulation. 2005;112:2634–2641. doi: 10.1161/CIRCULATIONAHA.105.543231 [DOI] [PMC free article] [PubMed] [Google Scholar]
- 23. Armstrong K, Ravenell KL, McMurphy S, Putt M. Racial/ethnic differences in physician distrust in the United States. Am J Public Health. 2007;97:1283–1289. doi: 10.2105/AJPH.2005.080762 [DOI] [PMC free article] [PubMed] [Google Scholar]
- 24. Lisabeth LD, Kleindorfer D. Stroke literacy in high‐risk populations: a call for action. Neurology. 2009;73:1940–1941. doi: 10.1212/WNL.0b013e3181c51aa3 [DOI] [PubMed] [Google Scholar]
- 25. Towfighi A, Skolarus LE. Inequities in stroke preparedness in young adults: what do we know and where should we go? Stroke. 2020;51:3479–3481. doi: 10.1161/STROKEAHA.120.032612 [DOI] [PubMed] [Google Scholar]
- 26. Appelros P, Asberg S. Sex differences in stroke. Handb Clin Neurol. 2020;175:299–312. doi: 10.1016/B978-0-444-64123-6.00021-7 [DOI] [PubMed] [Google Scholar]
- 27. Labiche LA, Chan W, Saldin KR, Morgenstern LB. Sex and acute stroke presentation. Ann Emerg Med. 2002;40:453–460. doi: 10.1067/mem.2002.128682 [DOI] [PubMed] [Google Scholar]
- 28. Giralt D, Domingues‐Montanari S, Mendioroz M, Ortega L, Maisterra O, Perea‐Gainza M, Delgado P, Rosell A, Montaner J. The gender gap in stroke: a meta‐analysis. Acta Neurol Scand. 2012;125:83–90. doi: 10.1111/j.1600-0404.2011.01514.x [DOI] [PubMed] [Google Scholar]
- 29. Man S, Xian Y, Holmes DN, Matsouaka RA, Saver JL, Smith EE, Bhatt DL, Schwamm LH, Fonarow GC. Target: stroke was associated with faster intravenous thrombolysis and improved one‐year outcomes for acute ischemic stroke in Medicare beneficiaries. Circ Cardiovasc Qual Outcomes. 2020;13:e007150. doi: 10.1161/CIRCOUTCOMES.120.007150 [DOI] [PubMed] [Google Scholar]
- 30. Adcock AK, Choi J, Alvi M, Murray A, Seachrist E, Smith M, Findley S. Expanding acute stroke care in rural America: a model for statewide success. Telemed J E Health. 2020;26:865–871. doi: 10.1089/tmj.2019.0087 [DOI] [PMC free article] [PubMed] [Google Scholar]
- 31. Ramirez L, Kim‐Tenser MA, Sanossian N, Cen S, Wen G, He S, Mack WJ, Towfighi A. Trends in acute ischemic stroke hospitalizations in the United States. J Am Heart Assoc. 2016;5:5. doi: 10.1161/JAHA.116.003233 [DOI] [PMC free article] [PubMed] [Google Scholar]
- 32. Bach PB, Pham HH, Schrag D, Tate RC, Hargraves JL. Primary care physicians who treat blacks and whites. N Engl J Med. 2004;351:575–584. doi: 10.1056/NEJMsa040609 [DOI] [PubMed] [Google Scholar]
- 33. Hall WJ, Chapman MV, Lee KM, Merino YM, Thomas TW, Payne BK, Eng E, Day SH, Coyne‐Beasley T. Implicit racial/ethnic bias among health care professionals and its influence on health care outcomes: a systematic review. Am J Public Health. 2015;105:e60–e76. doi: 10.2105/AJPH.2015.302903 [DOI] [PMC free article] [PubMed] [Google Scholar]
- 34. Churchwell K, Elkind MSV, Benjamin RM, Carson AP, Chang EK, Lawrence W, Mills A, Odom TM, Rodriguez CJ, Rodriguez F, et al. Call to action: structural racism as a fundamental driver of health disparities: a presidential advisory from the American Heart Association. Circulation. 2020;142:e454–e468. doi: 10.1161/CIR.0000000000000936 [DOI] [PubMed] [Google Scholar]
Associated Data
This section collects any data citations, data availability statements, or supplementary materials included in this article.
Supplementary Materials
Data S1