

Abstract
Objective
We previously reported that high expression of the extracellular glutathione peroxidase GPX3 is associated with poor patient outcome in ovarian serous adenocarcinomas, and that GPX3 protects ovarian cancer cells from oxidative stress in culture. Here we tested if GPX3 is necessary for tumor establishment in vivo and to identify novel downstream mediators of GPX3’s pro-tumorigenic function.
Methods
GPX3 was knocked-down in ID8 ovarian cancer cells by shRNA to test the role of GPX3 in tumor establishment using a syngeneic IP xenograft model. RNA sequencing analysis was carried out in OVCAR3 cells following shRNA-mediated GPX3 knock-down to identify GPX3-dependent gene expression signatures.
Results
GPX3 knock-down abrogated clonogenicity and intraperitoneal tumor development in vivo, and the effects were dependent on the level of GPX3 knock-down. RNA sequencing showed that loss of GPX3 leads to decreased gene expression patterns related to pro-tumorigenic signaling pathways. Validation studies identified GDF15 as strongly dependent on GPX3. GDF15, a member of the TGF-β growth factor family, has known oncogenic and immune modulatory activities. Similarly, GPX3 expression positively correlated with pro-tumor immune cell signatures, including regulatory T-cell and macrophage infiltration, and displayed significant correlation with PD-L1 expression.
Conclusions
We show for the first time that tumor produced GPX3 is necessary for ovarian cancer growth in vivo and that it regulates expression of GDF15. The immune profile associated with GPX3 expression in serous ovarian tumors suggests that GPX3 may be an alternate marker of ovarian tumors susceptible to immune check-point inhibitors.
Introduction
Ovarian cancer remains the most deadly gynecological malignancy and fifth-leading cause of cancer-related deaths in women in the United States (1). The five-year survival rate for patients with advanced stage epithelial ovarian cancer remains below 30%, with the development of chemoresistance and high rates of recurrence contributing to these outcomes. PARP inhibitors have been added to standard of care based on homologous recombination deficiency status of high grade serous ovarian cancers, with encouraging results, yet development of resistance to newer therapies, and the lack of response to immunotherapy are continuing challenges associated with treatment.
Cancer cells upregulate their antioxidant enzyme expression to adapt to oxidative stress associated with metastatic progression (2). Cells are equipped with a sophisticated antioxidant enzyme system to ensure maintenance of cellular redox homeostasis, which includes glutathione peroxidases. While assessing if expression of antioxidant enzymes in serous adenocarcinomas from TCGA is associated with patient outcome, we found that high expression of Glutathione peroxidase 3 (GPX3) is most strongly associated with negative outcome among all antioxidant enzymes examined (3). GPX3 is an extracellular selenocysteine-containing protein that catalyzes the reduction of hydroperoxides, including hydrogen peroxide (H2O2) and soluble lipid hydroperoxides in the presence of glutathione. Systemically, GPX3 is produced by the kidneys and is the predominant glutathione peroxidase in plasma. Initially, studies reported that many cancer patients display decreased plasma glutathione peroxidase activity, which is associated with selenium deficiency, suggesting that decreases in plasma GPX3 are negatively associated with patient outcome, including ovarian cancer patients (4, 5). However, more recent studies have started to demonstrate that tumor-produced GPX3 is associated with chemoresistance and tumor progression in several cancer types (reviewed in (5)). Similar to our previous findings in ovarian cancer (3), studies have found that GPX3 expression is predictive of poor outcome and associated with chemoresistance in other cancers (6, 7). We demonstrated that GPX3 is advantageous to tumor cell clonogenicity and anchorage-independent survival, and that GPX3 protects ovarian cancer cells from exogenous sources of oxidative stress, including co-culture in patient derived ascites fluid (3). However, it remains unknown if tumor produced GPX3 is necessary for in vivo tumor growth and if GPX3 expression contributes to changes in the tumor transcriptome. In the present work we set out to determine the role of GPX3 on in vivo tumor progression using a syngeneic xenograft model and to study its function using an unbiased RNA sequencing approach, which identified GDF15 as a novel GPX3 target gene in ovarian cancer.
Materials & Methods
Cell culture and generation of GPX3 knock-down cell lines
Luciferase-expressing mouse ovarian cancer ID8-Luc2 cells were maintained in high glucose DMEM (Corning, #10-017-CV), 4% FBS (Avantor Seradigm,#1500-500), 5 mg/mL insulin (MilliporeSigma, #I0516), 5 mg/mL transferrin (MilliporeSigma, #T8158), 5 ng/mL sodium selenite (MilliporeSigma, #S5261) and 100 units/mL penicillin-streptomycin solution (Gibco, #15140122). Human ovarian cancer NIH:OVCAR3 (OVCAR3) cells were purchased from ATCC (#HTB-161) and maintained in RPMI 1640 medium (Gibco, #11875) supplemented with 10% FBS and 0.01 mg/ml bovine insulin (MilliporeSigma, #I0516). OVCAR4 (MilliporeSigma) were cultured in RPMI 1640 medium supplemented with 10% FBS, 0.25 U/mL insulin and 2mM glutamine. OVCA433 cells (kindly provided by Dr. Susan K. Murphy, Duke University), were cultured in RPMI 1640 medium (Corning,#10-040-CV) supplemented with 10% FBS. All cell lines were maintained in 5% CO2 at 37°C. Cells are routinely tested for mycoplasma and authenticated using STR sequencing.
To generate stable GPX3 knock-down cells, lentivirus was packaged in 293FT cells using the ViraPower Kit (Invitrogen), according to manufacturer’s instructions. Two shRNA were used to generate virus and infect OVCAR3 cells or ID8 cells, respectively (3) (Sigma-Aldrich shRNA library; Mouse(M)-shGPX3-39, TRCN0000076539: GCAGGCAAATATATCCTCTTT; M-shGPX3-41, TRCN0000076541: AGAGCAGAAATTCTACACTTT; Human(H)-shGPX3-76, TRCN0000008676: GCCTCCAAATATTAGTAACTA; H-shGPX3-78, TRCN0000008678: GTGGAGGCTTTGTCCCTAATT). Controls were Addgene #1864 scrambled shRNAcontrol or an empty backbone pLKO.1 vector (Addgene #8453).
For transient siRNA-mediated GPX3 knock-down cells were seeded to 6 cm dishes at 60–80% confluency. The next day, the non-targeting control (Dharmacon, #D-001810-10-05) or human GPX3 siRNA (Dharmacon, #L-006485-00-0005) were delivered to cells using Lipofectamine RNAiMAX (Invitrogen, #13778150). After 24 hours, transfected cells were transferred to 10cm dishes and incubated for 72 hours. The cells were harvested for RNA isolation and semi-quantitative real-time RT-PCR.
In vivo syngeneic model of ovarian cancer
In vivo experiments were approved by the Penn State College of Medicine’s Institutional Animal Care and Use Committee and conformed to the Guide for the Care and Use of Laboratory Animals. 12 to 16 week old C57BL/6J mice were obtained from Jackson Laboratory and randomly assigned into 3 groups to be injected intraperitoneally (IP) with 1×10⁶ ID8 cells stably expressing either pLKO.1 (n=12), or shRNAs targeting GPX3 shGPX3-39 (n=6), or shGPX3-41 (n=8) resuspended in 0.2 mL sterile phosphate-buffered saline (PBS). Results represent cumulative data from 2 experiments (Exp1: Control n=6, shGPX3-39 n=6, shGPX3-41 n=3; Exp2: Control n=6, shGPX3-41 n=5). Mice were imaged using an IVIS Lumina III In Vivo Imaging System (IVIS; PerkinElmer). Mice were injected IP with 10 μL/g of body weight of 15 mg/mL in vivo grade filter sterilized D-Luciferin (luciferin; PerkinElmer), anesthetized with 2–3% isoflurane and imaged 10 minutes later in an IVIS imaging chamber under 2–3% isoflurane. Mice were weighed and imaged 1–2 times a week until reaching endpoint (ascites burden). Mice were euthanized by CO2 asphyxiation followed by cervical dislocation. After euthanasia, abdominal ascites were collected and volumes measured. The omentum was removed, weighed, and imaged using the IVIS in 2 mL PBS and 150 μg/mL luciferin. Tumor samples of the omentum were placed in TRIzol Reagent (Invitrogen,15596018) and frozen at −80°C for RNA analysis.
RNA isolation and semi-quantitative real-time RT-PCR
Total RNA was extracted using the Qiagen RNeasy Mini Kit (Qiagen) or Direct-zol RNA Miniprep kit (Zymo Research, R2052). First strand synthesis was performed using the iScript cDNA Synthesis Kit (Bio-Rad) or qScript cDNA Synthesis Kit (Quantabio, 95047), according to manufacturer’s instructions. For mouse tissues, total RNA was isolated from omental tumors after tissues were collected and homogenized in TRIzol Reagent (Invitrogen,15596018). Semi-quantitative real-time RT-PCR was carried out using the Applied Biosystems 7500 Real Time PCR or Bio-Rad CFX Opus 96 Real-Time PCR System with PowerUp SYBR Green Master Mix (Applied Biosystems) or iTaq Universal SYBR Green Supermix (Bio-Rad). The following primers were used: Human(H)-18S-Sense(S): 5’-AGAAACGGCTACCACATCCA-3’; H-18S-anti-sense(AS): 5’-CACCAGACTTGCCCTCCA-3’; H-GAPDH-S: 5’-GAGTCAACGGATTTGGTCGT-3’; H-GAPDH-AS: 5’-TTGATTTTGGAGGGATCTCG-3’; H-GPX3-S: 5’-GGGGATGTCAATGGAGAGAA-3’; H-GPX3-AS: 5’-TTCATGGGTTCCCAGAAGAG-3’; Mouse(M)-GAPDH-S#1 (Fig 1A): 5’-ATGTGTCCGTCGTGGATCTGAC-3’; M-GAPDH-AS#1 (Fig 1A): 5’-AGACAACCTGGTCCTCAGTGTAG-3’; M-GAPDH-S#2 (Fig 3–4): 5’-AGGTCGGTGTGAACGGATTTG-3’; M-GAPDH-AS#2 (Fig 3–4): 5’-GGGGTCGTTGATGGCAACA-3’; M-GPX3-S#2 (Fig 1A): 5’-AGGAGATGTGAACGGGGAGA-3’; M-GPX3-AS#2 (Fig 1A): 5’-GGGAGGGCAGGAGTTCTTCA-3’; M-GPX3-S#3 (Fig 3–4): 5’-GACATCCGCTGGAACTTTGA-3’; M-GPX3-AS#3 (Fig 3–4): 5’-CCATCTTGACGTTGCTGACT-3’; H-GDF15-S: 5’-GCAAGAACTCAGGACGGTGA-3’; H-GDF15-AS: 5’-TGGAGTCTTCGGAGTGCAAC-3’; M-FOXP3-S: 5’-GGCCCTTCTCCAGGACAGA-3’; M-FOXP3-AS: 5’-GCTGATCATGGCTGGGTTGT-3’; M-PD-1-S: 5’-TGGGGCCTAAGCCTATGTCT-3’; M-PD-1-AS: 5’-CTCCCAAGGGTGGCTTTAGG-3’; M-PD-L1-S: 5’-ACTTGCTACGGGCGTTTACT-3’; M-PD-L1-AS: 5’-CTCTCCCCCTGAAGTTGCTG-3’. Expression was analyzed using the ΔΔCt method with values normalized to housekeeping genes and change in transcript expression expressed relative to control cells. For mRNA analysis from tumors, mRNA levels were expressed relative to expression of one control tumor (mouse 1).
RNA-sequencing
OVCAR3 cells stably expressing pLKO.1-scramble control, shGPX3-76, or shGPX3-78 were seeded and incubated for 72 hrs. Total RNA was extracted from cells using Direct-zol RNA Miniprep kit (Zymo Research, R2052). mRNA was purified using poly-Toligo-attached magnetic beads and first strand cDNA synthesized using random hexamer primers, followed by second strand cDNA synthesis using dTTP, end repair, A-tailing, adapter ligation, size selection, amplification, and purification for non-directional library preparation (Novogene). RNA sequencing was carried out on Illumina NovaSeq 6000 (Novogene) and reads in fastq format processed through perl scripts (Novogene) to obtain clean reads for downstream analyses. Index of the reference genome was built and paired-end clean reads were aligned to the reference genome hg38 using Hisat2 v2.0.5. FeatureCounts v1.5.0-p3 was used to count the reads numbers mapped to each gene. Then FPKM of each gene was calculated based on the length of the gene and reads count mapped. Differential expression analysis between control and GPX3 knock-down samples was performed using the DESeq2R package (1.20.0). The resulting P-values were adjusted using the Benjamini and Hochberg’s approach for controlling the false discovery rate (FDR), and genes with an adjusted P-value <0.05 assigned as differentially expressed. Volcano plots were generated using VolcaNoseR software. Gene Set Enrichment Analysis (GSEA) was carried out on presorted DEGs (broadinstitute.org/gsea). Transcription factor analysis and small molecule query L1000CDS2 analysis (LINCS project) was performed using BioJupies (8). RNA sequencing data are accessible through NCBI GEO (GSE254035).
Clonogenicity assays
ID8 control and GPX3 knock-down cells were seeded in 12 well plates (100 cells per well) and cultured for 10 days under fully supplemented media. 0.05% crystal violet solution (MilliporeSigma, 229288) was used to stain colonies. Colonies were counted using Image J and data expressed as survival fractions.
Immunoblotting
Cells were harvested by scraping into RIPA buffer (ThermoScientific, 89901) containing protease and phosphatase inhibitors (ThermoScientific, 78443). Samples were sonicated (Qsonica) for a total of 5 mins and spun down for 10 mins at 13000 rpm, 4°C. Protein concentrations were measured using the Bradford protein assay (Bio-Rad, 5000006). 50 μg of whole cell lysate was used for SDS-PAGE and transferred to PVDF membranes (Thermo Scientific, PI88520). Membranes were blocked with 5% non-fat milk (Bio-Rad,1706404) in TBS containing 0.1% Tween20 (MilliporeSigma, 900-64-5) for 30 mins, and incubated with primary antibodies at 4°C, overnight (GPX3, R&DSystems #AF4199; GDF15, R&DSystems #AF957; Vinculin Sigma-Aldrich #V9131). After washing with TBST (10 mins, 3 times), the membranes were probed with HRP-conjugated secondary antibodies (anti-rabbit Cytiva#NA934; anti-mouse Cytiva #NA931; anti-goat Santa Cruz Biotechnology #sc-2354) at room temperature for 1 hour, and developed using SuperSignal™ West Femto (Thermo Scientifi, 34096). The signals were captured by ChemiDoc XRS+ Imaging (Bio-Rad).
For analysis of extracellular GPX3 and GDF15 cells were seeded the previous day and media changed to serum-free and phenol red-free media (Gibco, 11835). Media was collected after 72 hrs, cell debris removed by centrifugation and media concentrated using Amicon Ultra Centrifugal Filters (MilliporeSigma, UFC901024), spinning for 2 hrs at 4000 rpm, 4°C. 30 μg of protein samples were used for immunoblotting with nitrocellulose membranes (Amersham Protran, 10600001) as above, and equal loading demonstrated by Ponceau S staining (MilliporeSigma, P7170-1L).
Statistical analysis
Data are reported as mean ± SEM from at least three independent experiments. All statistical analyses were chosen based on experimental design, as indicated, and performed using GraphPad Prism 9 (GraphPad Software, San Diego, CA). p values < 0.05 were considered significant.
Results
GPX3 is important for in vivo peritoneal tumor spread in a syngeneic ovarian cancer model.
In previous work we demonstrated that GPX3 expression in TCGA ovarian serous adenocarcinoma specimens is associated with poor patient outcome, and that GPX3 is necessary for survival under oxidative stress, growth in patient ascites fluid and for anchorage-independent survival of OVCAR3 cancer cells (3). To expand on this work, we tested the importance of GPX3 on in vivo tumor progression using a syngeneic ovarian cancer xenograft model. Two independent shRNAs targeting GPX3 transcripts were expressed in ID8 mouse ovarian cancer cells and knock-down confirmed by semiquantitative real-time RT-PCR (Figure 1A). Similar to our previous findings in human OVCAR3 cells, GPX3 knockdown in ID8 cells also inhibited their clonogenicity (Figure 1B) (3). The effect on colony formation was dependent on the level of GPX3 knock-down, requiring at least 40% decrease in GPX3 mRNA expression to achieve significant effect on clonogenic survival (Figure 1B). C57BL/6J mice injected IP with control ID8 cells (pLKO.1) developed omental tumors and abdominal ascites faster than mice injected with either knockdown cell line (Figure 1C–F). Ascites burden was used as an endpoint determinant and median ascites free survival for mice injected with shGPX3-41 ID8 cells was 102.5 days compared to 85.6 days in control tumor cell injected mice (Figure 1E), with 9/12 control mice and 6/8 shGPX3-41 mice developing omental tumors and abdominal ascites (Figure 1D–I). Tumors were also detected on the diaphragm, peritoneal walls, gastrointestinal tract, and the right kidney (Supplemental Data Figure 1). As seen in clonogenicity studies, a dose-dependent effect of GPX3 knock-down was also observed in vivo. Injection of ID8 shGPX3-39 cells that display a more significant GPX3 knock-down resulted in significantly reduced tumor burden compared to the control group, with only 1/6 mice developing ascites (Figure 1D) and abdominal tumors at endpoint of the study (day 196, Figure 1E–I). The one mouse in the shGPX3-39 group that developed tumors displayed similar-sized omental tumors and ascites burden compared to the control group (Figure 1H, I). The above data suggest that tumor expressed GPX3 is necessary for optimal tumor dissemination in vivo.
Figure 1. Knock-down of GPX3 decreases tumor burden in a syngeneic mouse ovarian cancer tumor model.
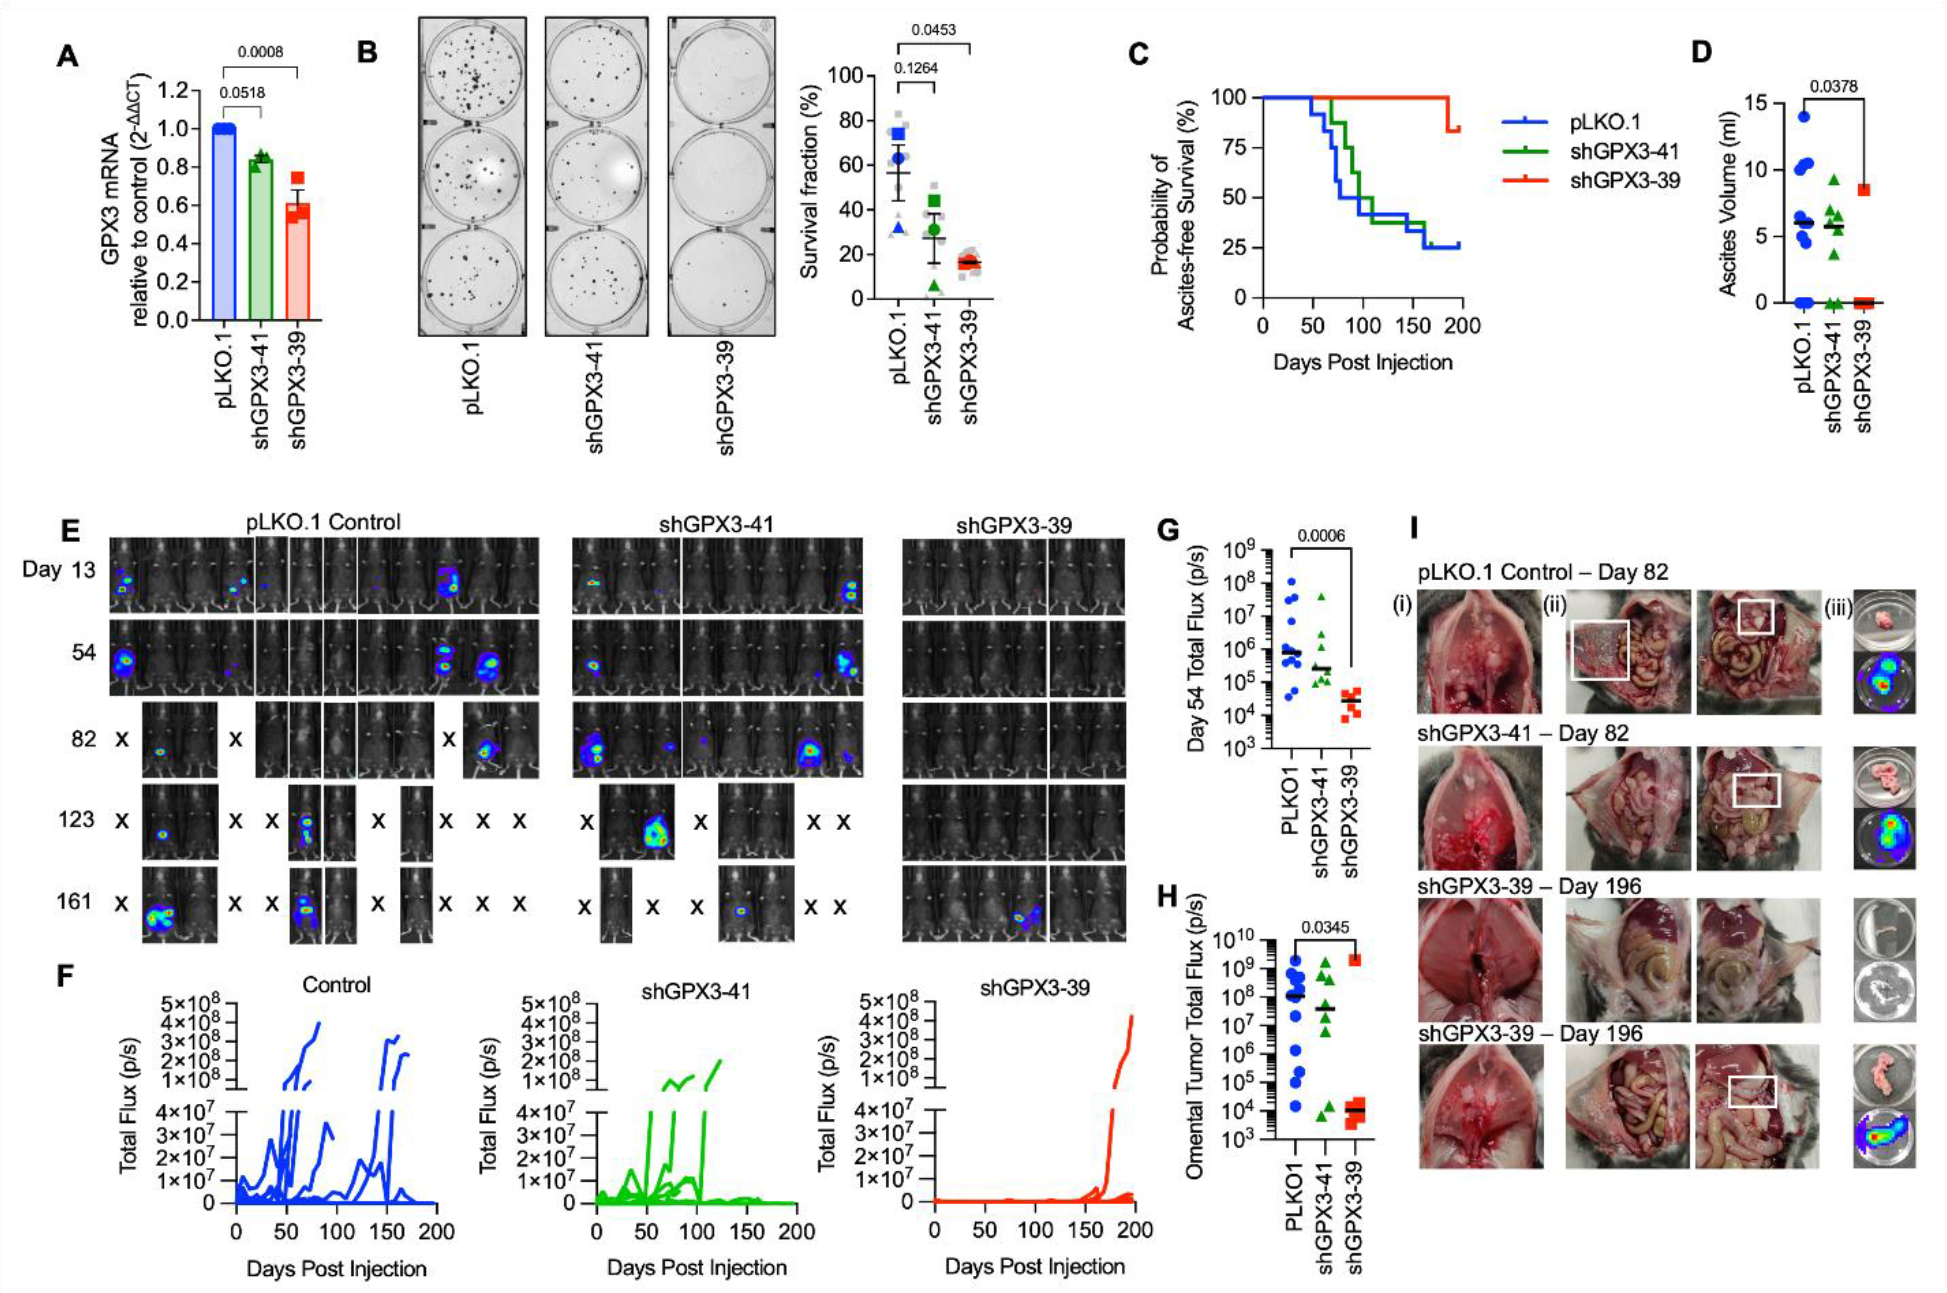
A. GPX3 was knocked down using 2 different shRNAs in mouse ID8 tumor cells. GPX3 expression assessed using sqRT-PCR (n=3 One-way ANOVA p=0.0013; Dunnett’s post-test).
B. GPX3 decreases clonogenicity of ID8 cells (n=3 biological replicates. Superplot shows underlying technical replicates, One-way ANOVA p=0.0607; Dunnett’s post-test).
C. ID8 tumor cells transduced with pLK0.1 control, shGPX3-41 or shGPX3-39 shRNAs were IP injected into immunocompetent C57BL/6J mice. GPX3 knock-down by shRNA-39 results in significant delay in the onset of ascites, which was used as endpoint for survival studies. Kaplan Meier curves show probability of ascites-free survival (pLK0.1 control n=12, shGPX3-41 n= 8, shGPX3-39 n=6; Log-rank Mantel-Cox test, P value = 0.0443).
D. Quantification of total ascites volume collected at necropsy (Kruskal-Wallis test).
E. Intraperitoneal tumor growth of ID8 tumor cells transfected with pLK0.1 control, shGPX3-41 or shGPX3-39 shRNAs in C57BL/6J mice was monitored using luminescence imaging
F. Quantification of individual mouse tumor luminescence signals over time (pLK0.1 control n=12, shGPX3-41 n= 8, shGPX3-39 n=6; Total Flux p/s).
G. Median tumor burden as assessed by luminescence on Day 54 (pLK0.1 control n=12, shGPX3-41 n= 8, shGPX3-39 n=6; Total Flux p/s; Kruskal-Wallis test).
H. Tumor luminescence of isolated omenta at necropsy (pLK0.1 control n=12, shGPX3-41 n= 8, shGPX3-39 n=6; Kruskal-Wallis test).
I. Tumor burden was detected on the diaphragm (i), peritoneal wall (ii) and omentum (iii). Representative images of mice at necropsy endpoint day 82 from pLK0.1control and shGPX3-41 groups are shown. A representative abdomen from the 5/6 mice that did not develop tumors, and the one of 6 mice in the shGPX3-39 group that developed tumors (lower panel) are shown from endpoint day 196.
Transcriptional changes in response to GPX3 knock-down.
To determine how GPX3 knock-down might be aiding tumor progression and affecting intrinsic gene expression changes, we carried out RNA sequencing on human OVCAR3 cells where GPX3 expression was stably knocked down using two independent shRNAs (Figure 2A, Figure 3A). Gene set enrichment analysis (GSEA) analysis revealed that GPX3 expression is associated with a number of cancer-associated gene expression signatures, in particular metabolic and biosynthesis genes, and their associated regulatory signaling pathways, including mTOR, PPAR and AMPK signaling (Figure 2B; Supplemental Figure 2). None of the upregulated gene expression pathways in response to GPX3 knock-down had an FDR <0.05. In agreement, small molecule gene expression signature analysis demonstrated that GPX3 knock-down most mimics the effects PI3K/mTOR inhibitors on gene expression (Figure 2C). Analysis of validated Transcription Factor binding data (ChEA, ENCODE) revealed that the gene signatures down regulated following GPX3 knock-down are targets of CEBPB (immune response, metabolism), ATF3 (stress response), SOX2 (stemness) and FOXA2 (metabolism; Figure 2D). These data suggest that GPX3 expression regulates pro-tumorigenic pathways involved in stress response and metabolism.
Figure 2. RNA sequencing demonstrates downregulation of pro-tumorigenic signaling pathways in response to GPX3 knock-down in OVCAR3 cells.
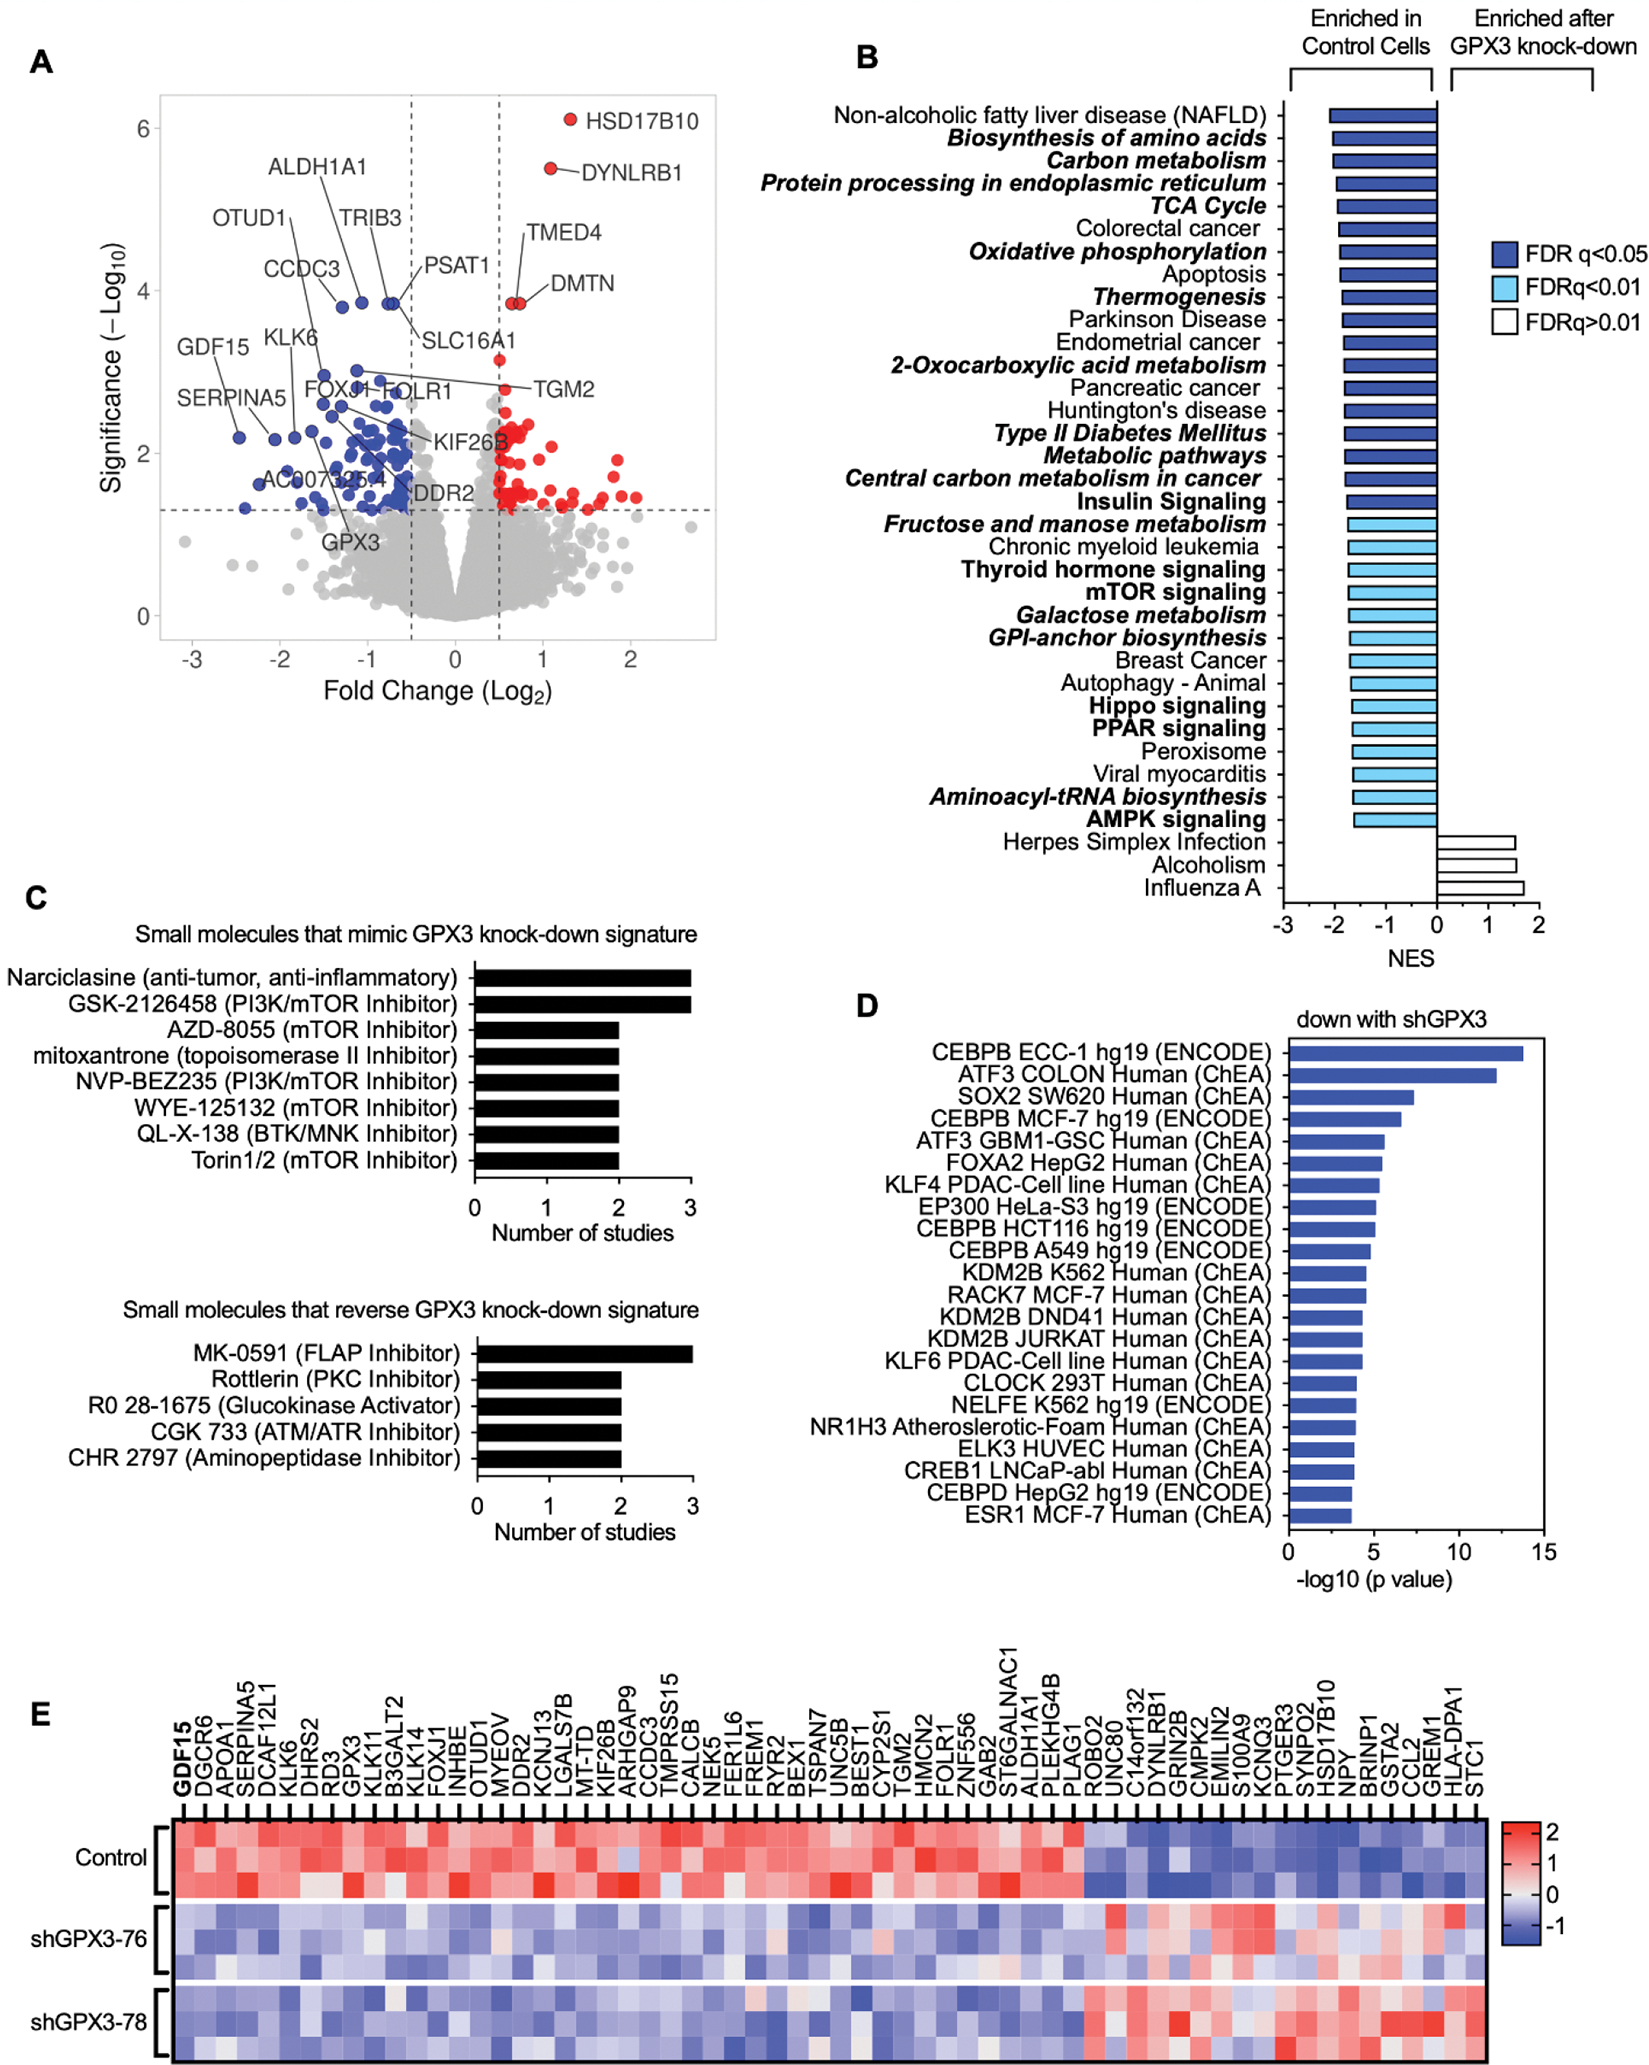
A. Volcano plot of differentially expressed genes (DEGs) following GPX3 knock-down using two different shRNAs (shRNA-76 & shRNA-78; n=3) relative to scramble shRNA control transduced OVCAR3 cells.
B. Gene set enrichment analysis of RNA sequencing data following GPX3 knock-down (KEGG) demonstrates enrichment of tumor associated metabolic pathways in control cells relative to GPX3-knock-down cells.
C. Small Molecule Query (L1000CDS2) was carried out to identify gene expression signatures that mimic or reverse gene expression changes following GPX3 knock-down.
D. Transcription factor enrichment analysis (ENCODE & ChEA) on RNAsequencing data following GPX3 knock-down.
E. Heat map of top differentially expressed protein coding genes (DEG) following GPX3 knock-down (z-scores; log 2-fold change >1, p adjust <0.05).
Of the 61 differentially expressed genes (DEGs) displaying a log 2-fold change >1 (p adjust <0.05; Figure 2E) the top protein coding gene downregulated following GPX3 knock-down was GDF15. GDF15 is a stress-responsive member of the TGF-β growth factor family, that has established roles in regulating metabolism, food intake and energy expenditure (9) (Figure 2E). Serum GDF15 levels are often elevated in cancer patients (10–13) and in a number of metabolic disorders, including non-alcoholic fatty liver disease (14), which was a top GSEA pathways identified to be dependent on GPX3 knock-down (Figure 2B).
GDF15 is regulated by GPX3.
Of relevance to ovarian cancer, GDF15 is elevated in serum from ovarian cancer patients (11), is highly expressed in ovarian tumor tissues (15), and is associated with chemoresistance (16, 17) and immune escape (18). Moreover, GDF15 induces p38, Erk1/2, Akt and NF-kB signaling in ovarian cancer cells (15, 19). Thus, we validated that GPX3 regulates GDF15 mRNA expression by sqRT-PCR in high grade serous cell lines OVCAR3, OVCAR4, and OVCA433 using multiple sRNA hairpins and siRNA (Figures 3A–C). We were unable to statistically assess if lack of tumor burden observed in ID8 cells transduced with the shGPX3-39 hairpin is due to decreased expression of GDF15 mRNA in vivo, due to the lack of sufficient amount of tumor tissue for analysis in this group (Figure 1). However, even in ID8 tumors with ~20% knock down of GPX3 with hairpin shGPX3-41, GDF15 mRNA expression in isolated omental tumors was lower than controls (Figure 3E). Further, GPX3 was necessary for intracellular and secreted extracellular GDF15 protein expression (Figure 3E&F). These data collectively demonstrate that GPX3 is an upstream regulator of the soluble growth factor GDF15.
Figure 3. Validation of GPX3-dependent GDF15 gene expression.
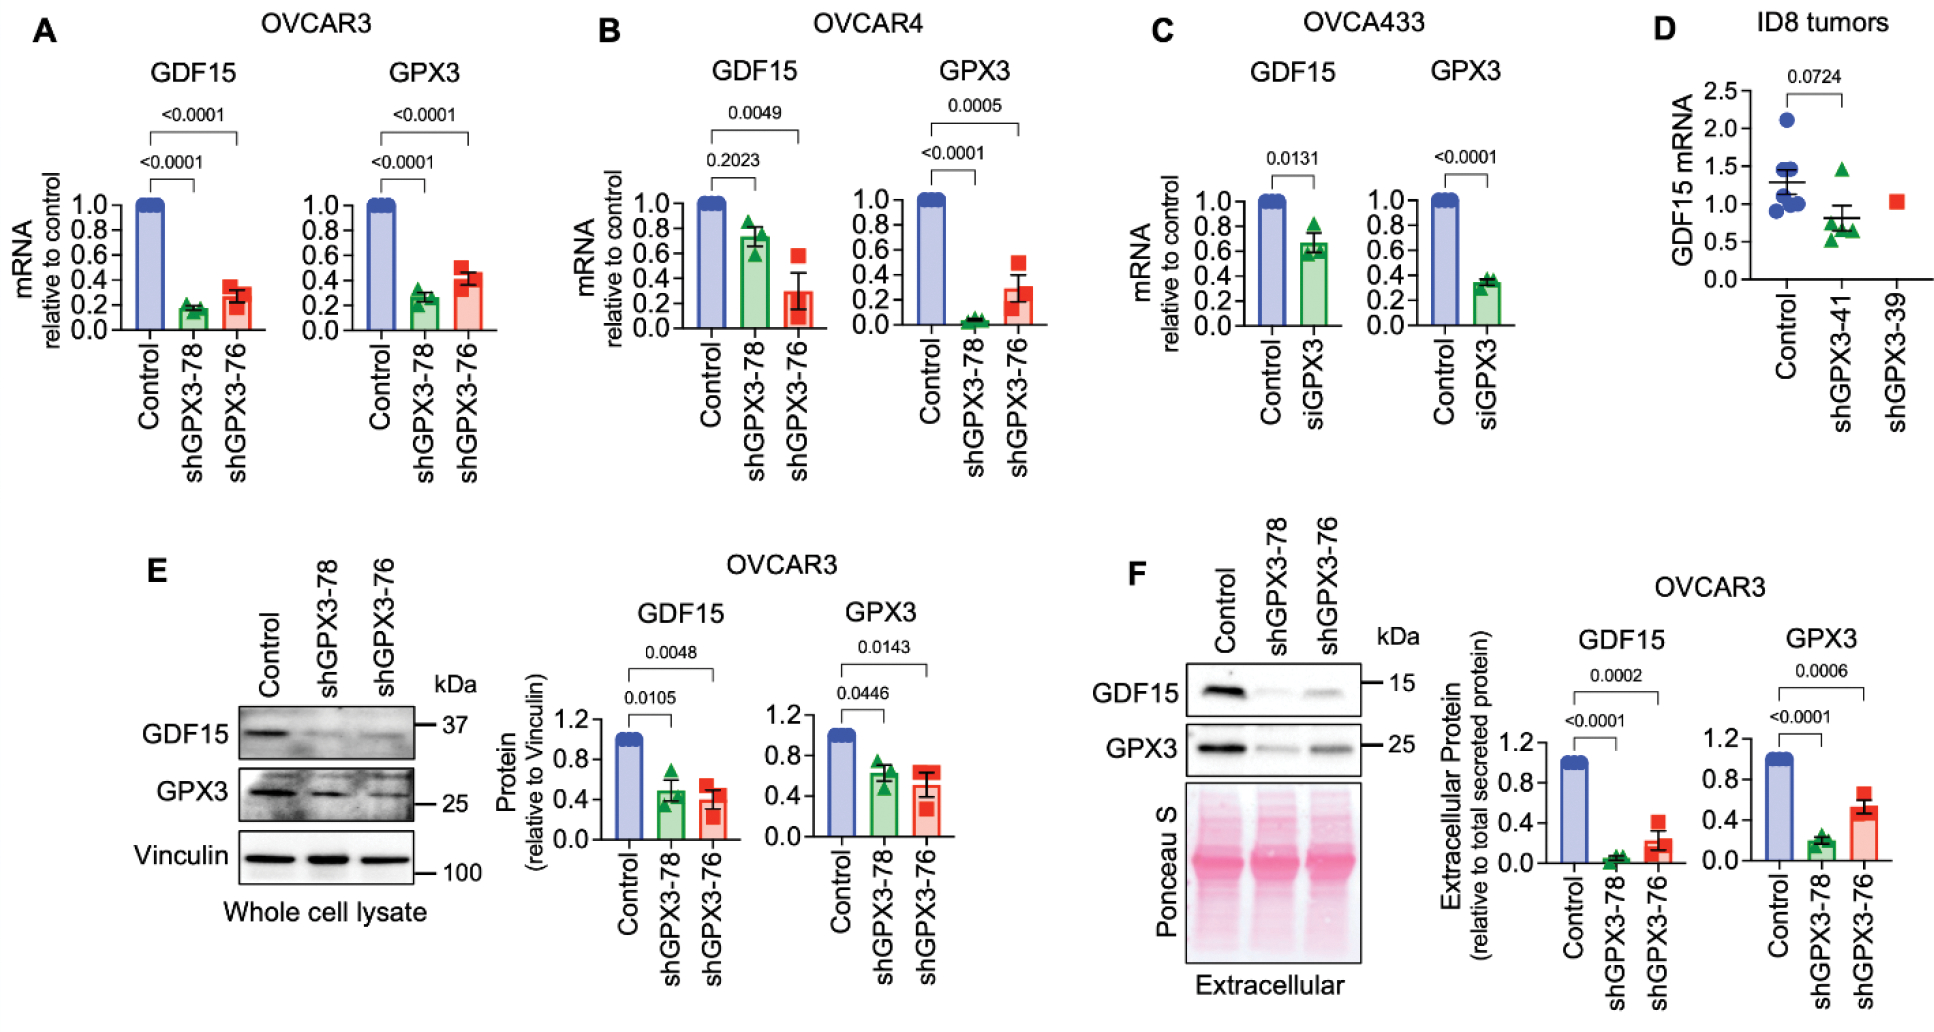
A. Stable shRNA mediated knock-down of GPX3 in OVCAR3 leads to decreased GDF15 mRNA expression (n=3, One Way ANOVA, Tukey’s post-test).
B. shRNA-mediated knock-down of GPX3 in OVCAR4 cells results in decreased GDF15 mRNA expression (n=3, One Way ANOVA, Tukey’s post-test).
C. Transient siRNA-mediated GPX3 knock-down in OVCA433 cells leads to decreased GDF15 mRNA expression (n=3, t-test).
D. GDF15 mRNA expression in tumors from ID8 cells (from Figure 1), assessed by semi-quantitative real time RT-PCR (Kruskal-Wallis test).
E. shRNA mediated knock-down of GPX3 in OVCAR3 cells decreases intracellular and
F. Extracellular GDF15 protein expression (n=3, One Way ANOVA, Tukey’s post-test).
GPX3 expression is positively associated with regulatory T-cell and macrophage signatures in ovarian cancer specimens, and significantly correlates with PD-L1 expression.
Using two independent analyses to survey TCGA data for immune cell expression profiles, we also found that GPX3 mRNA expression was significantly associated with macrophages and regulatory T-cell (T-reg) and activated NK cells in ovarian cancer specimens (Figure 4A&B), suggesting that high GPX3 expression correlates with specific tumor immune cell infiltrates. Utilizing the immune cell gene expression signatures established by Tamborero et al. (20) we found significant positive association between GPX3 expression and macrophages, CD8+ T-cells and T-regs, and a negative association with T-helper cells (Figure 4A). Similarly, Cibersort analysis (Timer2.0 (21)) showed that T-regs, M2 macrophages and activated NK cells were positively associated with GPX3 mRNA expression (Figure 4B). Moreover, GPX3 expression in ovarian cancer specimens from TCGA significantly correlated with CD274 (PD-L1) and FOXP3 mRNA expression (Figure 4C). No correlation to PDCD1 (PD-1) expression was found. Moreover, we could demonstrate that FOXP3 and PD-L1 expression also strongly and significantly correlated to GPX3 mRNA expression in tumors derived from ID-8 cells (Figure 4D). These data suggest that GPX3 expression in ovarian tumors is potentially associated with “hot” immune signatures, T-reg infiltration and suppression of anti-tumor lymphocytes.
Figure 4. GPX3 expression is associated with immune cell infiltration and PD-L1 expression.
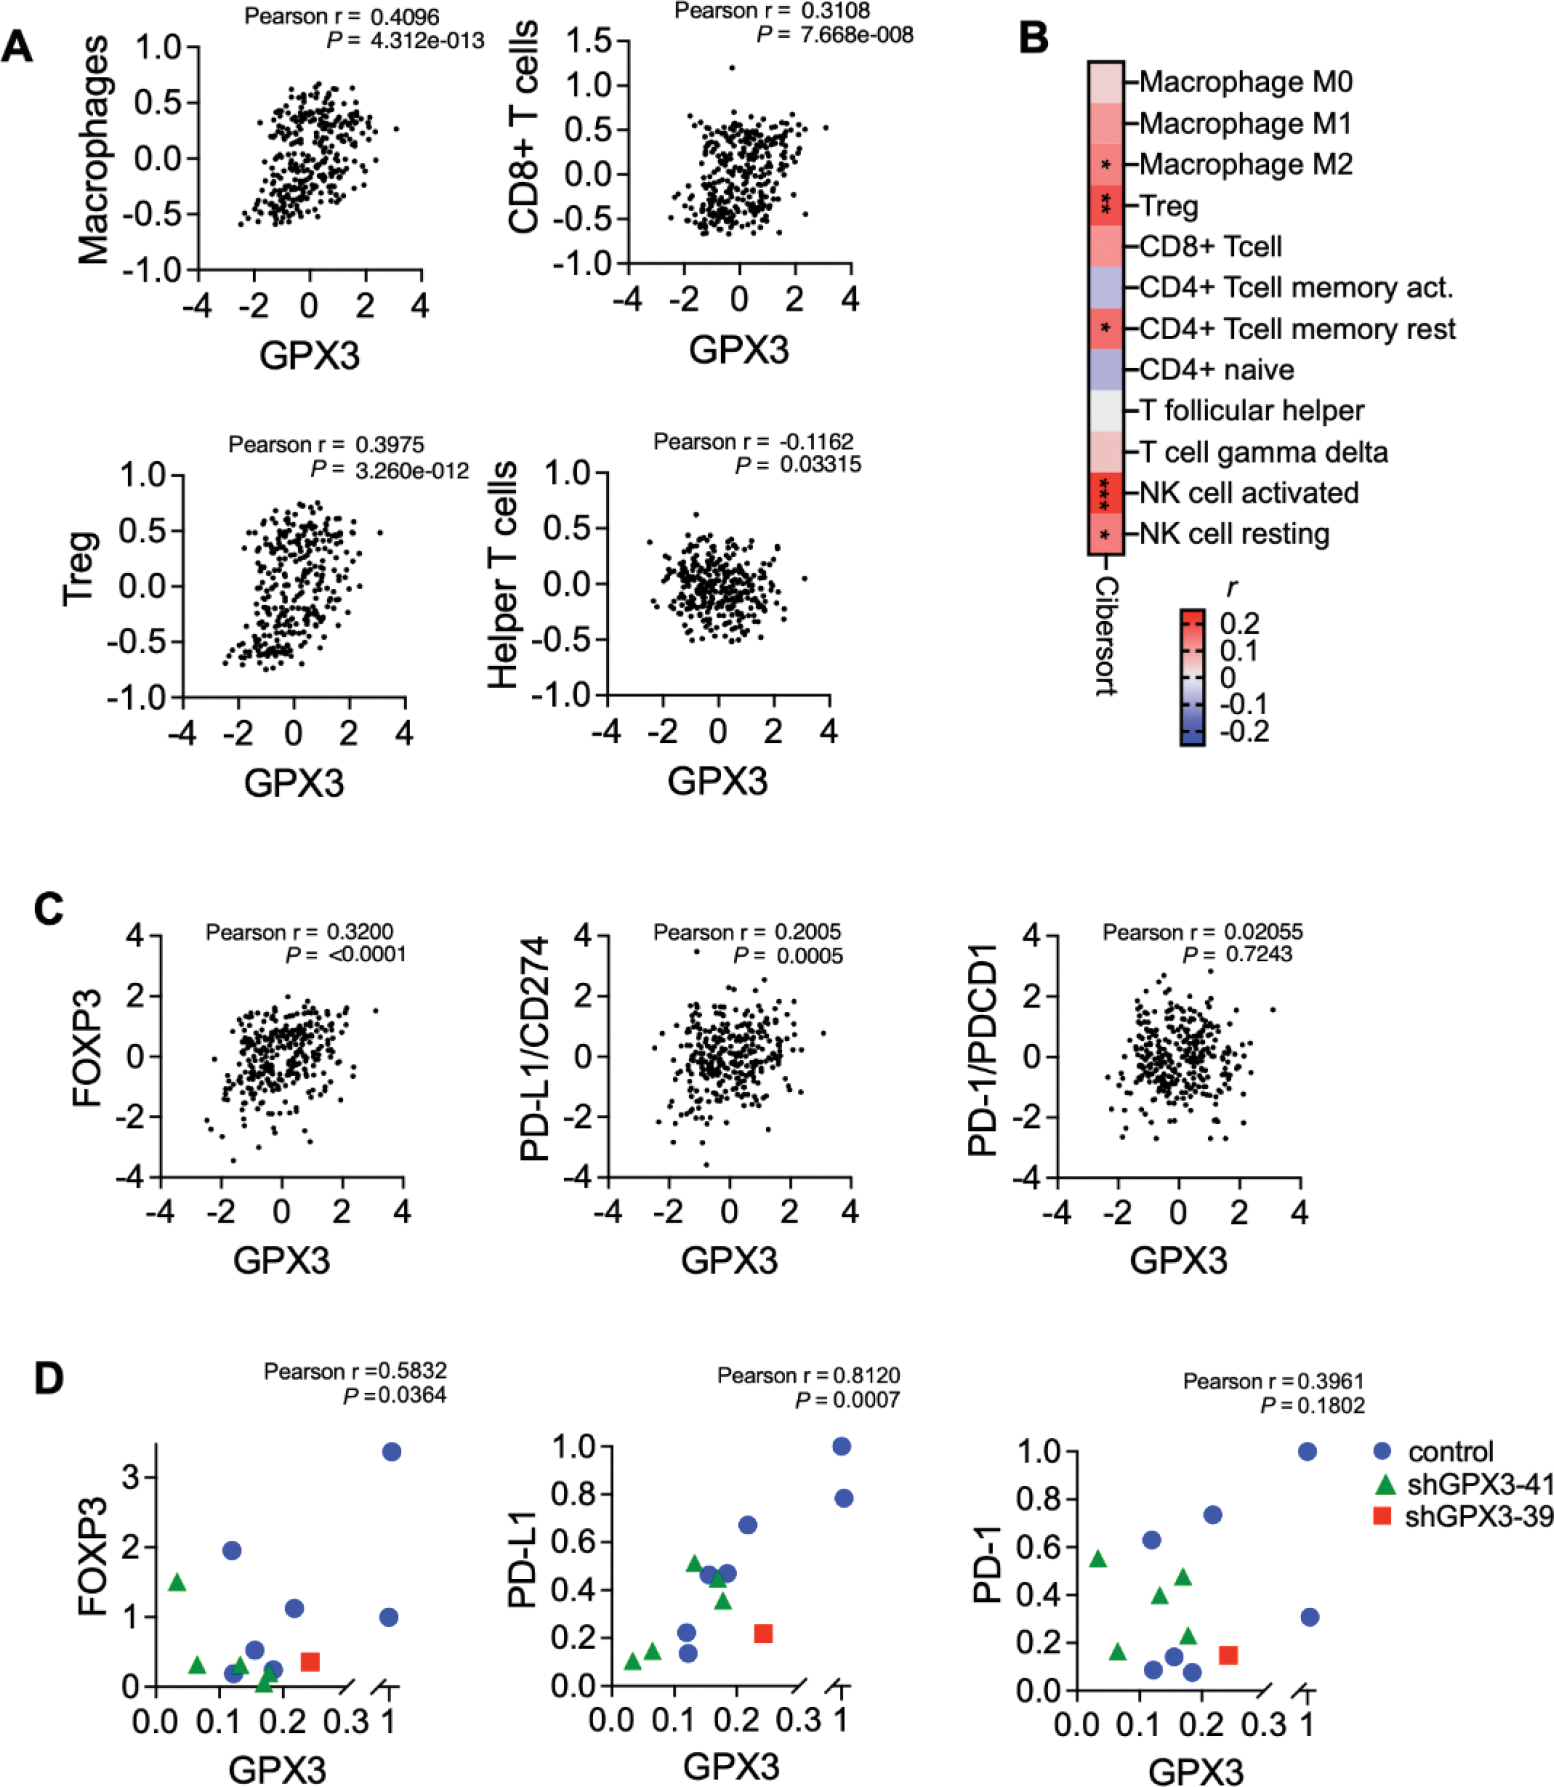
A. Immune cell gene expression signatures established by Tamborero et al. (16) were correlated to GPX3 expression (z-score) in TCGA serous ovarian cancer specimens. GPX3 expression has significant positive correlation to macrophages, CD8+ T-cells and T-regs, and significant negative correlation with T-helper cells (Pearson r).
B. Cibersort analysis of GPX3 expression to immune cell signatures in TCGA serous ovarian cancer specimens (Timer2.0, CIBERSORT-ABS, Pearson r, *P<0.05; **P<0.01; P<0.001).
C. Expression of GPX3 mRNA in TCGA serous ovarian cancer specimens positively correlates with FOXP3 and PD-L1 expression (z-scores, n=300 specimens from TCGA with RNAseq data).
D. Expression of GPX3 mRNA in ID8 tumors (from Figure 1) positively correlates with FOXP3 and PD-L1 expression.
Discussion
Here we further investigated the role of tumor cell produced GPX3 in ovarian cancer, demonstrating that GPX3 is necessary for in vivo tumor growth in a syngeneic immunocompetent model (Figure 1). High GPX3 expression in ovarian tumor specimens, including high grade serous and clear cell subtypes has been reported by us and others, and shown to be associated with poor patient outcome (3, 7, 22, 23). Moreover, similar to our observations that GPX3 expression is associated with CD8+ T-cell and macrophage infiltration, GPX3 expression correlates with immune cell infiltration and immune checkpoint marker expression in gastric cancer (24). In addition, GPX3 was identified as one of 7 DEGs predictive of poor patient survival in ovarian tumors with high immune and stromal scores (6). We find that GPX3 mRNA correlates strongly with T-reg/FoxP3 expression and the immune check point protein PD-L1. Interestingly, in lung adenocarcinoma, a cancer where high GPX3 expression is conversely predictive of better patient outcome, GPX3 expression was shown to be significantly correlated to PD-L1 expression and identified as a predictive marker of immune check point inhibitor (ICI) response (25).
Although we focused on manipulating GPX3 expression in tumor cells, it is possible that GPX3 in the extracellular tumor environment (TME) is also derived from tumor associated cells. As such, it was recently shown that alveolar type 2 epithelial cells near the tumor interface contribute to GPX3 expression and that this is necessary for metastatic colonization of the lung, by inhibiting CD4+ T cells and supporting T-reg cell proliferation (26). This correlates with our observations that high GPX3 expression in HGSOC correlates with enhanced PD-L1 expression and T-reg (FoxP3) infiltration signatures. In recent work it was found that GPX3 is strongly expressed in stromal enriched colorectal cancer where its expression promotes chemoresistance (27). Querying publicly available single cell RNAseq data (TISCH2.0) we find that GPX3 in HGSOC tumor samples is primarily expressed by metastatic cells and myofibroblasts. How tumor associated cells contribute to the extracellular GPX3 milieu and its consequence on ovarian cancer remain to be determined.
Our previous study demonstrated that GPX3 provides survival advantages to tumor cells when exposed to exogenous oxidative stress (3). We now demonstrate that GPX3 is also necessary for maintaining a transcriptional program associated with pro-tumorigenic and metabolic signaling pathways (Figure 2). We find that the expression of GDF15, a mitokine that has pro-proliferative and pro-metastatic functions, is strongly GPX3-dependent (Figure 3) (13). Tumor produced GDF15 is also linked to cachexia via its activation of the brain localized receptor GFRAL (GDNF Family Receptor Alpha Like) and interaction with RET to induce ERK and Akt signaling, which initiates appetite suppression (28). Since GFRAL expression is limited to the brain, it remains unclear which receptor is the primary target of GDF15 in tumor cells. Our RNAseq data demonstrate that many metabolic pathways are decreased following GPX3 knock-down, in particular fatty acid metabolism, amino acid synthesis and mitochondrial respiration, and it is possible that this is also linked to the metabolic function of GDF15, which requires further investigation.
Due to its increased expression in many tumors and serum of cancer patients, GDF15 has been studied as a potential tumor biomarker (11, 15). Interestingly, besides its intrinsic pro-tumorigenic role, which has been linked to induction of p38, Erk1/2, Akt and NF-kB signaling in ovarian cancer cells (15, 19), GDF15 has also been implicated with the regulation of inflammation and tumor immune escape (13). GDF15 was shown to inhibit the function of Dendritic cells (DC), leading to decreased DC dependent T-cell stimulation and lack of cytotoxic T-cell activation in a liver cancer model (29). In ovarian cancer, GDF15 is associated with higher DC infiltration, but lack of activated DCs (18). Moreover, GDF15 expression correlates positively with PD-1+ T-cells in plasma of lung cancer patients (30), and enhances T-cell exhaustion and increases T-reg cell expansion via CD48 mediated FoxP3 stabilization in a hepatocellular carcinoma model (31). In gall bladder cancer, GDF15 has been shown to increase PD-L1 expression in a PI3K/Akt/Erk dependent manner to result in immune suppression (32). A recent study has shown that GDF15 suppresses responses to anti-PD1 immune check point therapy, as GDF-15 impairs T-cell endothelial adhesion and thus recruitment to the tumor, with T-reg recruitment being less affected (33). Thus, GPX3 and GDF15 appear to share similarities in their correlation to tumor immune cell signatures. Although we show that GPX3 is necessary for the expression of GDF15 by tumor cells it remains to be determined if GPX3 is the necessary upstream regulator of GDF15 in the context of tumor infiltrating lymphocytes.
Like many antioxidant enzymes, GPX3 has dichotomous functions in cancer. This dichotomous function is linked to its role as an antioxidant enzyme in protecting normal cells from oxidative damage that leads to oncogenesis, and aiding tumor cell survival during tumor progression. It is likely that part of the immune-modulatory function of GPX3 is associated with its antioxidant activity in the TME, making it a more permissive environment for T-reg expansion, for example. A limitation to our work is that further studies are required to elucidate the mechanisms by which GPX3 regulates GDF15 expression. GDF15 expression is often induced in pathological conditions including inflammatory diseases, during cardiac and renal failure and in cancer patients (9), and has been shown to be induced in response to stress, including hypoxia, mitochondrial dysfunction (34), engagement of the integrated stress response and pro-inflammatory cytokines (35), PPARγ agonists (36), and NSAIDS (37). Thus, it was somewhat surprising that loss of the antioxidant enzyme GPX3, and presumably an increase in resultant cellular stress, decreased GDF15 expression. However, pathway analysis of RNAseq data following GPX3 knock-down strongly correlate with regulatory pathways that have been implicated in GDF15 expression including unfolded protein response, PERK and ATF4/6 pathways (14). We did not challenge cells with exogenous sources of oxidative stress, nor did we observe significant enrichments in pathways associated with oxidative stress following GPX3 knock-down in our RNA sequencing analysis (Figure 2). It is thus possible that GPX3 has alternate functions besides scavenging damaging peroxide species such as H2O2. One potential alternative is that GPX3 acts to alter signaling lipid peroxide species in the TME that could contribute to the transcriptional changes downstream of GPX3. As such it is possible that GPX3 plays a role in the synthesis pathway of hydroxyeicosatetraenoic acid (HETEs) and oxoeicosatetraenoic acid (oxo-ETEs) derived from arachidonic acid, as the peroxidase responsible for the reduction of HpETE to HETE, which is subsequently converted to oxo-ETE (38). HETEs and oxo-ETEs are pro-proliferative in cancer cells and able to activate PPARγ (38), a transcription factor which is able to activate GDF15 expression (36).
In conclusion, we find that GPX3 is necessary for optimal in vivo tumor growth in a syngeneic ovarian cancer model and that expression of the pro-tumorigenic and immune modulatory growth factor GDF15 is dependent on GPX3 expression. The strong association of GPX3 expression with the immune checkpoint marker PD-L1, suggests that GPX3 expression could be predictive of immune check point inhibition response. Moreover, given that GPX3 and GDF15 are both extracellular proteins, their targeting in the TME could be a novel therapeutic opportunity.
Supplementary Material
Highlights.
GPX3 knock-down abrogates intraperitoneal tumor development in a syngeneic IP xenograft model of ovarian cancer.
GPX3 modulates pro-tumorigenic gene expression and regulates the TGF-β family member GDF15.
GPX3 expression correlates with regulatory T-cell and macrophage signatures, and PD-L1 expression in ovarian cancer.
Acknowledgements
The authors would like to thank Sara Shimko, Weihua Pan and Benjamin Yankasky for technical assistance. This work was supported by the U.S. National Institutes of Health grants R01CA242021 (N.H.) and R01CA230628 (N.H. & K.M.). Sierra White is supported by training grant T32HL110849.
Footnotes
Conflict of interest
The authors have no conflicts of interest.
Publisher's Disclaimer: This is a PDF file of an unedited manuscript that has been accepted for publication. As a service to our customers we are providing this early version of the manuscript. The manuscript will undergo copyediting, typesetting, and review of the resulting proof before it is published in its final form. Please note that during the production process errors may be discovered which could affect the content, and all legal disclaimers that apply to the journal pertain.
References
- 1.Siegel RL, Miller KD, Fuchs HE, and Jemal A (2022) Cancer statistics, 2022. CA Cancer J Clin 72, 7–33 [DOI] [PubMed] [Google Scholar]
- 2.Kim YS, Gupta Vallur P, Jones VM, Worley BL, Shimko S, Shin DH, Crawford LC, Chen CW, Aird KM, Abraham T, Shepherd TG, Warrick JI, Lee NY, Phaeton R, Mythreye K, and Hempel N (2020) Context-dependent activation of SIRT3 is necessary for anchorage-independent survival and metastasis of ovarian cancer cells. Oncogene 39, 1619–1633 [DOI] [PMC free article] [PubMed] [Google Scholar]
- 3.Worley BL, Kim YS, Mardini J, Zaman R, Leon KE, Vallur PG, Nduwumwami A, Warrick JI, Timmins PF, Kesterson JP, Phaeton R, Lee NY, Walter V, Endres L, Mythreye K, Aird KM, and Hempel N (2019) GPx3 supports ovarian cancer progression by manipulating the extracellular redox environment. Redox Biol 25, 101051. [DOI] [PMC free article] [PubMed] [Google Scholar]
- 4.Agnani D, Camacho-Vanegas O, Camacho C, Lele S, Odunsi K, Cohen S, Dottino P, and Martignetti JA (2011) Decreased levels of serum glutathione peroxidase 3 are associated with papillary serous ovarian cancer and disease progression. J Ovarian Res 4, 18. [DOI] [PMC free article] [PubMed] [Google Scholar]
- 5.Chang C, Worley BL, Phaeton R, and Hempel N (2020) Extracellular Glutathione Peroxidase GPx3 and Its Role in Cancer. Cancers (Basel) 12 [DOI] [PMC free article] [PubMed] [Google Scholar]
- 6.Xu Y, Xu Y, Wang C, Xia B, Mu Q, Luan S, and Fan J (2021) Mining TCGA database for gene expression in ovarian serous cystadenocarcinoma microenvironment. PeerJ 9, e11375. [DOI] [PMC free article] [PubMed] [Google Scholar]
- 7.Saga Y, Ohwada M, Suzuki M, Konno R, Kigawa J, Ueno S, and Mano H (2008) Glutathione peroxidase 3 is a candidate mechanism of anticancer drug resistance of ovarian clear cell adenocarcinoma. Oncol Rep 20, 1299–1303 [PubMed] [Google Scholar]
- 8.Torre D, Lachmann A, and Ma’ayan A (2018) BioJupies: Automated Generation of Interactive Notebooks for RNA-Seq Data Analysis in the Cloud. Cell Syst 7, 556–561 e553 [DOI] [PMC free article] [PubMed] [Google Scholar]
- 9.Siddiqui JA, Pothuraju R, Khan P, Sharma G, Muniyan S, Seshacharyulu P, Jain M, Nasser MW, and Batra SK (2022) Pathophysiological role of growth differentiation factor 15 (GDF15) in obesity, cancer, and cachexia. Cytokine Growth Factor Rev 64, 71–83 [DOI] [PMC free article] [PubMed] [Google Scholar]
- 10.Mehta RS, Song M, Bezawada N, Wu K, Garcia-Albeniz X, Morikawa T, Fuchs CS, Ogino S, Giovannucci EL, and Chan AT (2014) A prospective study of macrophage inhibitory cytokine-1 (MIC-1/GDF15) and risk of colorectal cancer. J Natl Cancer Inst 106, dju016. [DOI] [PMC free article] [PubMed] [Google Scholar]
- 11.Staff AC, Bock AJ, Becker C, Kempf T, Wollert KC, and Davidson B (2010) Growth differentiation factor-15 as a prognostic biomarker in ovarian cancer. Gynecol Oncol 118, 237–243 [DOI] [PubMed] [Google Scholar]
- 12.Wang X, Li Y, Tian H, Qi J, Li M, Fu C, Wu F, Wang Y, Cheng D, Zhao W, Zhang C, Wang T, Rao J, and Zhang W (2014) Macrophage inhibitory cytokine 1 (MIC-1/GDF15) as a novel diagnostic serum biomarker in pancreatic ductal adenocarcinoma. BMC Cancer 14, 578. [DOI] [PMC free article] [PubMed] [Google Scholar]
- 13.Wischhusen J, Melero I, and Fridman WH (2020) Growth/Differentiation Factor-15 (GDF-15): From Biomarker to Novel Targetable Immune Checkpoint. Front Immunol 11, 951. [DOI] [PMC free article] [PubMed] [Google Scholar]
- 14.Xiao QA, He Q, Zeng J, and Xia X (2022) GDF-15, a future therapeutic target of glucolipid metabolic disorders and cardiovascular disease. Biomed Pharmacother 146, 112582. [DOI] [PubMed] [Google Scholar]
- 15.Griner SE, Joshi JP, and Nahta R (2013) Growth differentiation factor 15 stimulates rapamycin-sensitive ovarian cancer cell growth and invasion. Biochem Pharmacol 85, 46–58 [DOI] [PMC free article] [PubMed] [Google Scholar]
- 16.Meier JC, Haendler B, Seidel H, Groth P, Adams R, Ziegelbauer K, Kreft B, Beckmann G, Sommer A, and Kopitz C (2015) Knockdown of platinum-induced growth differentiation factor 15 abrogates p27-mediated tumor growth delay in the chemoresistant ovarian cancer model A2780cis. Cancer Med 4, 253–267 [DOI] [PMC free article] [PubMed] [Google Scholar]
- 17.Zhao D, Wang X, and Zhang W (2018) GDF15 predict platinum response during first-line chemotherapy and can act as a complementary diagnostic serum biomarker with CA125 in epithelial ovarian cancer. BMC Cancer 18, 328. [DOI] [PMC free article] [PubMed] [Google Scholar]
- 18.Gao Y, Xu Y, Zhao S, Qian L, Song T, Zheng J, Zhang J, and Chen B (2021) Growth differentiation factor-15 promotes immune escape of ovarian cancer via targeting CD44 in dendritic cells. Exp Cell Res 402, 112522. [DOI] [PubMed] [Google Scholar]
- 19.Kim KH, Park SH, Do KH, Kim J, Choi KU, and Moon Y (2016) NSAID-activated gene 1 mediates pro-inflammatory signaling activation and paclitaxel chemoresistance in type I human epithelial ovarian cancer stem-like cells. Oncotarget 7, 72148–72166 [DOI] [PMC free article] [PubMed] [Google Scholar]
- 20.Tamborero D, Rubio-Perez C, Muinos F, Sabarinathan R, Piulats JM, Muntasell A, Dienstmann R, Lopez-Bigas N, and Gonzalez-Perez A (2018) A Pan-cancer Landscape of Interactions between Solid Tumors and Infiltrating Immune Cell Populations. Clin Cancer Res 24, 3717–3728 [DOI] [PubMed] [Google Scholar]
- 21.Li T, Fu J, Zeng Z, Cohen D, Li J, Chen Q, Li B, and Liu XS (2020) TIMER2.0 for analysis of tumor-infiltrating immune cells. Nucleic Acids Res 48, W509–W514 [DOI] [PMC free article] [PubMed] [Google Scholar]
- 22.Hough CD, Cho KR, Zonderman AB, Schwartz DR, and Morin PJ (2001) Coordinately up-regulated genes in ovarian cancer. Cancer Res 61, 3869–3876 [PubMed] [Google Scholar]
- 23.Lee HJ, Do JH, Bae S, Yang S, Zhang X, Lee A, Choi YJ, Park DC, and Ahn WS (2011) Immunohistochemical evidence for the over-expression of Glutathione peroxidase 3 in clear cell type ovarian adenocarcinoma. Med Oncol 28 Suppl 1, S522–527 [DOI] [PubMed] [Google Scholar]
- 24.He Q, Chen N, Wang X, Li P, Liu L, Rong Z, Liu W, Jiang K, and Zhao J (2023) Prognostic value and immunological roles of GPX3 in gastric cancer. Int J Med Sci 20, 1399–1416 [DOI] [PMC free article] [PubMed] [Google Scholar]
- 25.Wu Y, Lin L, and Liu X (2020) Identification of PDL1-Related Biomarkers to Select Lung Adenocarcinoma Patients for PD1/PDL1 Inhibitors. Dis Markers 2020, 7291586. [DOI] [PMC free article] [PubMed] [Google Scholar]
- 26.Wang Z, Zhu J, Liu Y, Wang Z, Cao X, and Gu Y (2022) Tumor-polarized GPX3(+) AT2 lung epithelial cells promote premetastatic niche formation. Proc Natl Acad Sci U S A 119, e2201899119. [DOI] [PMC free article] [PubMed] [Google Scholar]
- 27.Zhou R, Wen Z, Liao Y, Wu J, Xi S, Zeng D, Sun H, Wu J, Shi M, Bin J, Liao Y, and Liao W (2022) Evaluation of stromal cell infiltration in the tumor microenvironment enable prediction of treatment sensitivity and prognosis in colon cancer. Comput Struct Biotechnol J 20, 2153–2168 [DOI] [PMC free article] [PubMed] [Google Scholar]
- 28.Ahmed DS, Isnard S, Lin J, Routy B, and Routy JP (2021) GDF15/GFRAL Pathway as a Metabolic Signature for Cachexia in Patients with Cancer. J Cancer 12, 1125–1132 [DOI] [PMC free article] [PubMed] [Google Scholar]
- 29.Zhou Z, Li W, Song Y, Wang L, Zhang K, Yang J, Zhang W, Su H, and Zhang Y (2013) Growth differentiation factor-15 suppresses maturation and function of dendritic cells and inhibits tumor-specific immune response. PLoS One 8, e78618. [DOI] [PMC free article] [PubMed] [Google Scholar]
- 30.Hong G, Sun P, Chung C, Park D, Lee SI, Kim N, Lee SE, Lee JE, Kang YE, and Kang DH (2023) Plasma GDF15 levels associated with circulating immune cells predict the efficacy of PD-1/PD-L1 inhibitor treatment and prognosis in patients with advanced non-small cell lung cancer. J Cancer Res Clin Oncol 149, 159–171 [DOI] [PMC free article] [PubMed] [Google Scholar]
- 31.Wang Z, He L, Li W, Xu C, Zhang J, Wang D, Dou K, Zhuang R, Jin B, Zhang W, Hao Q, Zhang K, Zhang W, Wang S, Gao Y, Gu J, Shang L, Tan Z, Su H, Zhang Y, Zhang C, and Li M (2021) GDF15 induces immunosuppression via CD48 on regulatory T cells in hepatocellular carcinoma. J Immunother Cancer 9 [DOI] [PMC free article] [PubMed] [Google Scholar]
- 32.Wang Z, Wang S, Jia Z, Hu Y, Cao D, Yang M, Liu L, Gao L, Qiu S, Yan W, Li Y, Luo J, Geng Y, Zhang J, Li Z, Wang X, Li M, Shao R, and Liu Y (2023) YKL-40 derived from infiltrating macrophages cooperates with GDF15 to establish an immune suppressive microenvironment in gallbladder cancer. Cancer Lett 563, 216184. [DOI] [PubMed] [Google Scholar]
- 33.Haake M, Haack B, Schafer T, Harter PN, Mattavelli G, Eiring P, Vashist N, Wedekink F, Genssler S, Fischer B, Dahlhoff J, Mokhtari F, Kuzkina A, Welters MJP, Benz TM, Sorger L, Thiemann V, Almanzar G, Selle M, Thein K, Spath J, Gonzalez MC, Reitinger C, Ipsen-Escobedo A, Wistuba-Hamprecht K, Eichler K, Filipski K, Zeiner PS, Beschorner R, Goedemans R, Gogolla FH, Hackl H, Rooswinkel RW, Thiem A, Roche PR, Joshi H, Puhringer D, Wockel A, Diessner JE, Rudiger M, Leo E, Cheng PF, Levesque MP, Goebeler M, Sauer M, Nimmerjahn F, Schuberth-Wagner C, von Felten S, Mittelbronn M, Mehling M, Beilhack A, van der Burg SH, Riedel A, Weide B, Dummer R, and Wischhusen J (2023) Tumor-derived GDF-15 blocks LFA-1 dependent T cell recruitment and suppresses responses to anti-PD-1 treatment. Nat Commun 14, 4253. [DOI] [PMC free article] [PubMed] [Google Scholar]
- 34.Fujita Y, Taniguchi Y, Shinkai S, Tanaka M, and Ito M (2016) Secreted growth differentiation factor 15 as a potential biomarker for mitochondrial dysfunctions in aging and age-related disorders. Geriatr Gerontol Int 16 Suppl 1, 17–29 [DOI] [PubMed] [Google Scholar]
- 35.Bottner M, Suter-Crazzolara C, Schober A, and Unsicker K (1999) Expression of a novel member of the TGF-beta superfamily, growth/differentiation factor-15/macrophage-inhibiting cytokine-1 (GDF-15/MIC-1) in adult rat tissues. Cell Tissue Res 297, 103–110 [DOI] [PubMed] [Google Scholar]
- 36.Baek SJ, Kim JS, Nixon JB, DiAugustine RP, and Eling TE (2004) Expression of NAG-1, a transforming growth factor-beta superfamily member, by troglitazone requires the early growth response gene EGR-1. J Biol Chem 279, 6883–6892 [DOI] [PubMed] [Google Scholar]
- 37.Baek SJ, Kim KS, Nixon JB, Wilson LC, and Eling TE (2001) Cyclooxygenase inhibitors regulate the expression of a TGF-beta superfamily member that has proapoptotic and antitumorigenic activities. Mol Pharmacol 59, 901–908 [PubMed] [Google Scholar]
- 38.Powell WS, and Rokach J (2015) Biosynthesis, biological effects, and receptors of hydroxyeicosatetraenoic acids (HETEs) and oxoeicosatetraenoic acids (oxo-ETEs) derived from arachidonic acid. Biochim Biophys Acta 1851, 340–355 [DOI] [PMC free article] [PubMed] [Google Scholar]
Associated Data
This section collects any data citations, data availability statements, or supplementary materials included in this article.