Abstract
Bilin-binding fluorescent proteins like UnaG–bilirubin are noncovalent ligand-dependent reporters for oxygen-free microscopy but are restricted to blue and far-red fluorescence. Here we describe a high-throughput screening approach to provide a new UnaG–ligand pair that can be excited in the 532 nm green excitation microscopy channel. We identified a novel orange UnaG–ligand pair that maximally emits at 581 nm. Whereas the benzothiazole-based ligand itself is nominally fluorescent, the compound binds UnaG with high affinity (Kd = 3 nM) to induce a 2.5-fold fluorescence intensity enhancement and a 10 nm red shift. We demonstrated this pair in the anaerobic fluorescence microscopy of the prevalent gut bacterium Bacteroides thetaiotaomicron and in Escherichia coli. This UnaG–ligand pair can also be coupled to IFP2.0-biliverdin to differentiate cells in mixed-species two-color imaging. Our results demonstrate the versatility of the UnaG ligand-binding pocket and extend the ability to image cells at longer wavelengths in anoxic environments.
Graphical Abstract
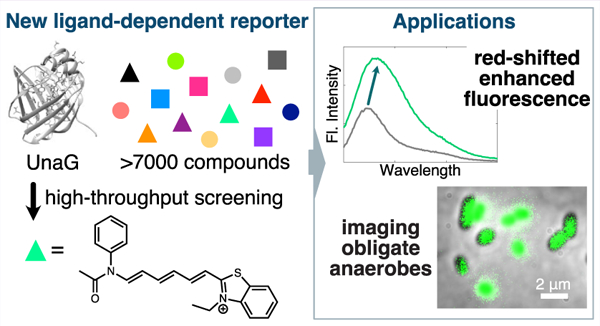
Advances in fluorescence microscopy have yielded techniques such as multicolor imaging, single-molecule tracking, and super-resolution microscopy.1 All of these advances were aided by the development of diverse small-molecule dyes and fluorescent proteins (FPs).2 FPs are among the most commonly used tools to label proteins and cells of interest and have been engineered to fluoresce over a wide range of wavelengths for use in imaging.3 However, popular FPs derived from green fluorescent protein (GFP) and DsRed require an oxidative post-translational modification to fluoresce,4,5 which precludes the use of common FPs to probe oxygen-sensitive samples such as the medically relevant polymicrobial communities in the gut microbiome.6 On the contrary, ligand-dependent FPs are promising tools that have already been demonstrated in obligate bacterial anaerobes.6,7 Ligand-dependent FPs confer oxygen-independent labeling because fluorescence depends only on the molecular structure of the fluorophore and, if the ligand is fluorogenic,8 upon the ligand binding to the protein.
Several approaches have addressed the limitations of GFP-like FPs for labeling anaerobic bacteria. These approaches include flavin-mononucleotide (FMN)-based FPs (FbFPs) or LOV (light-, oxygen-, or voltage-sensing) FPs,9–11 which are constrained to blue emission12 and covalent self-labeling systems like HaloTag,13 which rely on organic dye ligands14,15 that are not always cell-permeable in prokaryotes and require multiple washing steps that may not be compatible with the continuous imaging of live-cell samples. Both FbFPs16,17 and HaloTag7,18,19 have been used to label anaerobic bacteria with varying degrees of implementation ease due to the aforementioned limitations. Another ligand-dependent reporter, Y-FAST,20 and its derivatives,21 utilize synthetically tailored fluorogenic ligands for bright fluorescence without the need for washing before imaging and have also been demonstrated in anaerobic systems.22,23
Bilin-binding fluorescent proteins (BBFPs) reconcile the advantages of FbFPs and self-labeling tags for oxygen-independent fluorescent labeling. BBFPs bind bilirubin (br) or biliverdin (bv), which are fluorogenic ligands that can be used to label intra- and extracellular targets.24 BFFPs include the green UnaG25 and the far-red IFP2.0,26 and we recently demonstrated these probes in Bacteroides thetaiotaomicron (B. theta) and Bacteroides ovatus (B. ovatus) for anaerobic live-cell mixed-species imaging.24 UnaG–br was also recently demonstrated as a dark-to-green photoswitchable FP for super-resolution imaging,27 which further extends its versatility as an imaging tool. Despite these advantages, the attainable BBFP colors are limited by their ligands: UnaG with br is green and IFP2.0/mIFP28 /smURFP29 with bv is red.
RESULTS AND DISCUSSION
Using a high-throughput and small-molecule approach, we devised a screening method to identify new fluorogenic ligands to create new UnaG–ligand pairs that were red-shifted relative to the original UnaG–br complex (GFP channels, 488 nm excitation) (Figure 1). To diversify the pool of potential UnaG–binding ligands, we searched within a structurally heterogeneous library. In the primary screening step, 7680 compounds were loaded into individual wells in 384-well plates containing UnaG protein and were illuminated at three excitation wavelengths (485, 540, and 580 nm) for fluorescence end-point readings at 520, 570, and 610 nm, respectively (Figure 1a). The latter two channels were chosen due to their wide availability in most microscopy setups. For each fluorescence channel, compounds were considered hits if their fluorescence signal was greater than 3 SD above the negative control included on each plate (Figure S1).
Figure 1.
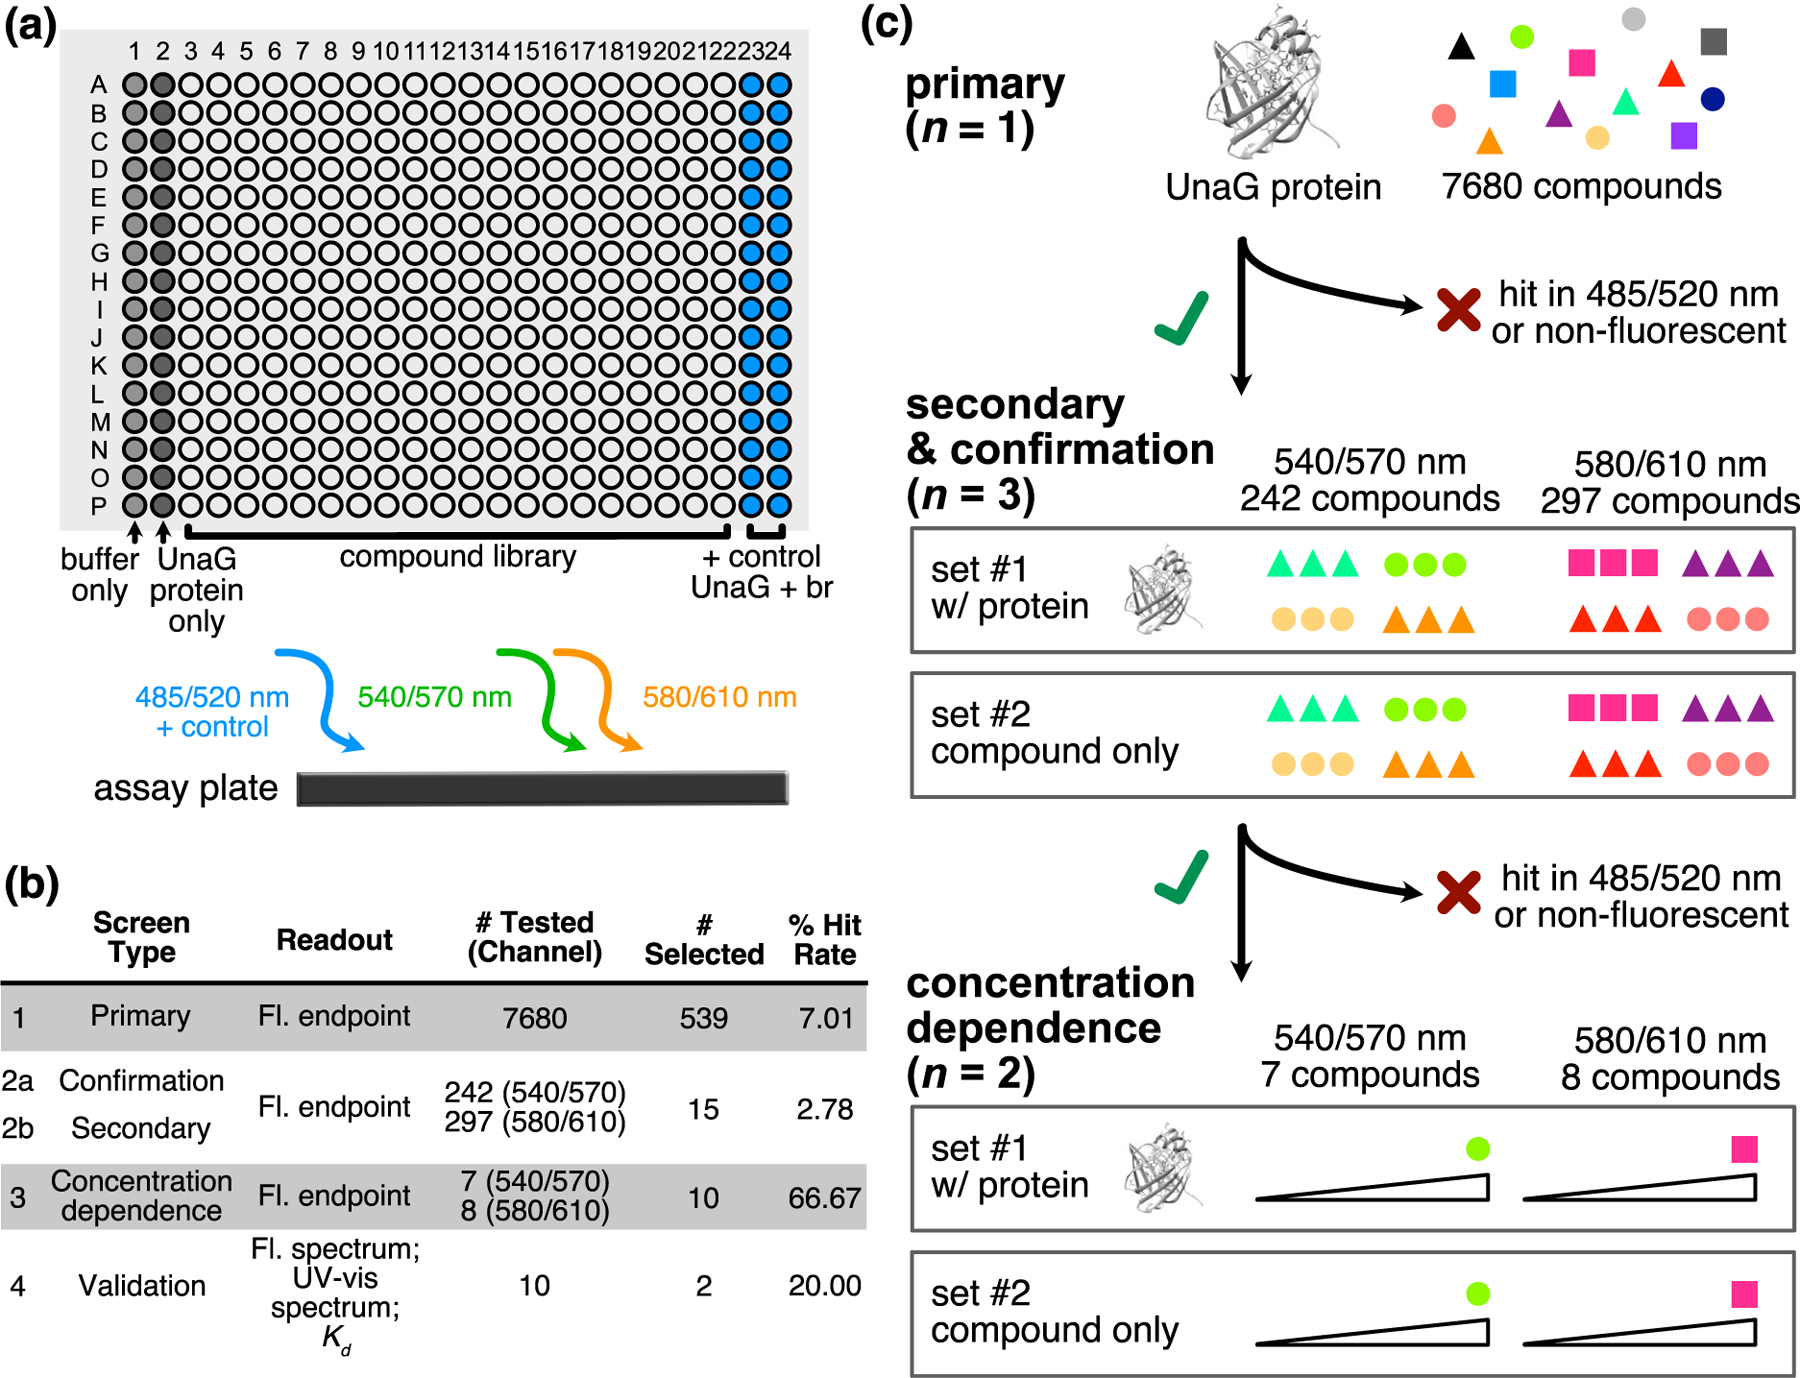
Screening methodology for identifying new, red-shifted ligand–UnaG pairs. (a) Schematic of primary HTS assay. Compounds were incubated with UnaG protein in 384-well black-walled plates before fluorescence intensity end-point reads using three optics modules. Columns 1 and 2 were reserved for negative controls, and columns 23 and 24 were reserved for positive controls of UnaG and bilirubin (br) for the 485/520 nm module. (b) Summary of HTS campaign. (c) Workflow logic used to cull hit lists from the three optics modules.
Because this screening methodology was a nonstandard high-throughput screening (HTS) protocol, Z′ scores30,31 could not be calculated for the entire primary assay given that a positive control could only be established for the 485/520 nm optics module using UnaG–br. The Z′ score for the primary assay 485/520 nm channel was low (0.27), reflecting significant variability in the signal magnitude in positive control wells. However, very little variability was observed between negative controls in each channel (Figure S1), which allowed us to draw a low activity cutoff for identifying primary hits.
The workflow required counter-selections at each screening step (Figure 1c). In the primary screen, UnaG–ligand pairs that showed fluorescence in either the 540/570 or 580/610 nm modules but not in the 485/520 nm module were considered preliminary hits (Figure 1b, 539 compounds with 7.01% hit rate). These preliminary hits were evaluated in triplicate in confirmation screens with UnaG (n = 3). Secondary screens with compounds alone were plated in triplicate (n = 3) and were measured in parallel. This counter-screening was necessary to select for compounds with fluorescence that is enhanced by UnaG rather than compounds with high intrinsic fluorescence. A concentration-dependent screen confirmed that the detected fluorescence signal was due to ligands binding UnaG rather than nonspecific fluorescence emission. In total, we identified 15 promising compounds for imaging, seven of which were fluorescent in the 540/570 nm channel and eight that were fluorescent in the 580/610 nm channel. Interestingly, the structures of the selected compounds, while highly π-conjugated, were not structurally similar to popular commercial organic dyes such as the AlexaFluor dyes (Figure S2).
We subsequently tested the 15 candidates (referred to by boldface numbers 1–15) by analysis of the compounds alone and when incubated in excess with UnaG using UV–vis absorbance and fluorescence emission (Figures S3 and S4). Furthermore, adding compounds to the media (2.5 μM) did not affect the growth kinetics of B. theta (Figure S5), indicating that these compounds were nontoxic and could be supplemented to media to label growing cells.
Of the 15 confirmed hit compounds, 2 and 4 were most promising for further investigation due to the observed red-shifted emission and fluorescence enhancement upon binding UnaG (Figure 2). Spectral properties of the UnaG–2 and UnaG–4 pairs are reported (Figure 2j and Table S1). Both compounds are benzothiazoles with moieties that extend the π-conjugation of the molecule (Figure 2d,g) and are similar in size and planarity to the original br ligand (Figure 2a). The binding of 2 and 4 to UnaG does not significantly shift the UV–vis absorbance maximum, whereas the binding of br to UnaG shifts the absorbance maximum from 437 to 495 nm (Figure 2b,e,h). Incubating 2 with UnaG red-shifts the maximal emission by 10 nm (from 571 to 581 nm) under excitation at 532 nm and gives rise to a 2.5-fold fluorescence intensity enhancement (Figure 2c,f). Likewise, the incubation of 4 with UnaG red-shifts the emission maximum by 13 nm (from 582 to 595 nm) under excitation at 532 nm and produces a three-fold fluorescence intensity enhancement (Figure 2i). Although 532 nm is not the peak fluorescence excitation wavelength for either UnaG–2 or UnaG–4, this excitation wavelength produces detectable fluorescence emission (Figure S6). Excitation near the peak absorbance wavelengths, 450 or 405 nm for UnaG–2 and UnaG–4 complexes, respectively, results in dimmer or bluer fluorescence emission (Figure S7).
Figure 2.
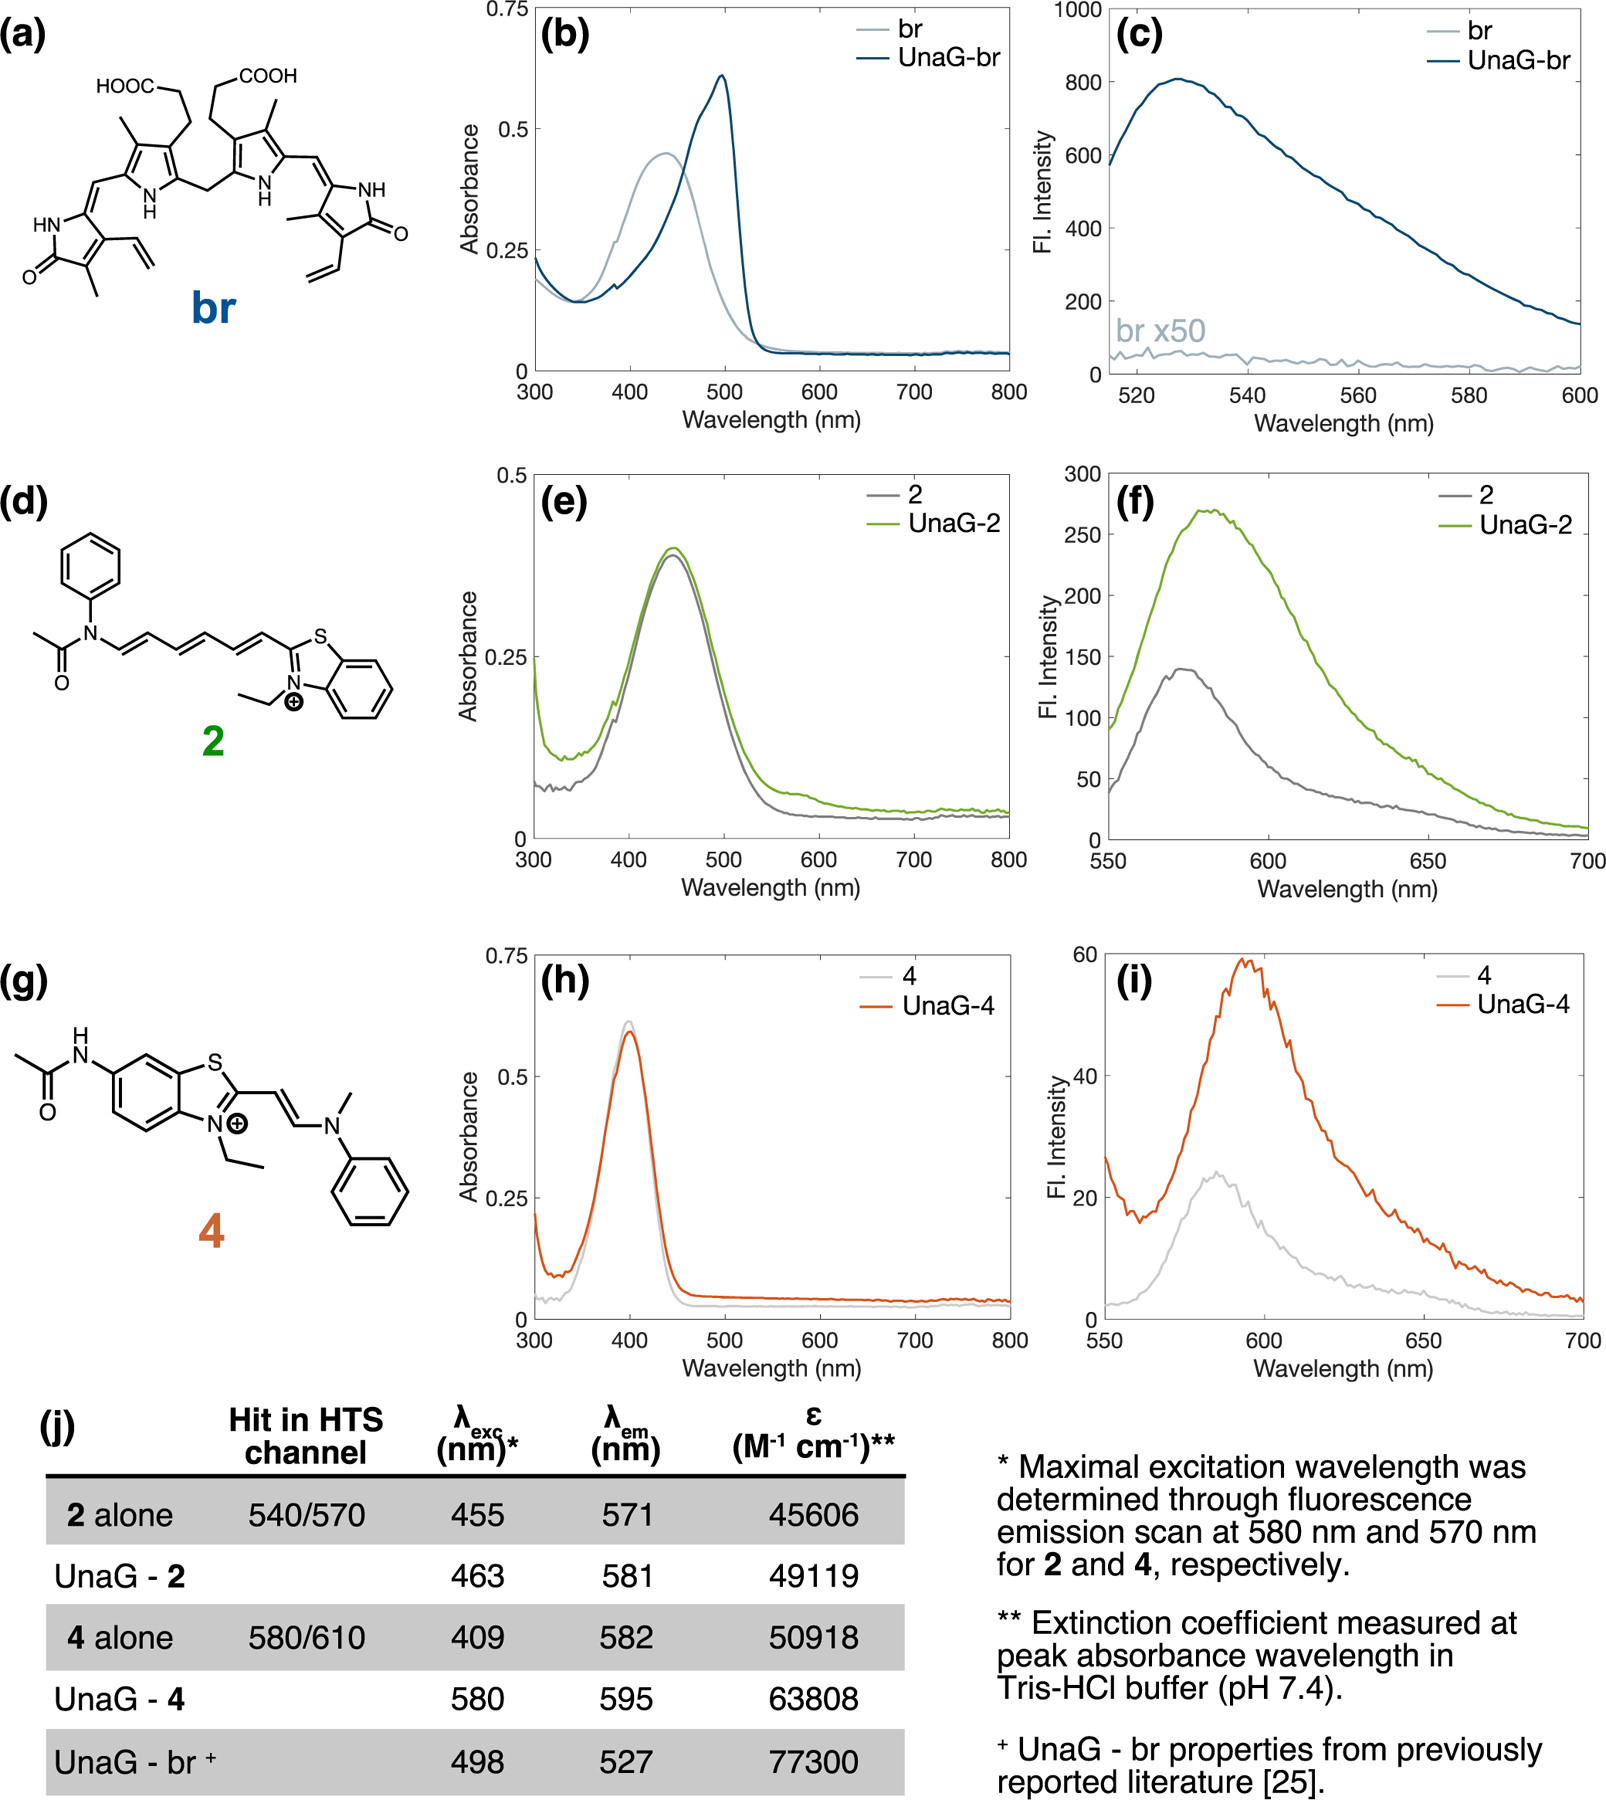
Spectral properties of UnaG–2 and UnaG–4. (a,d,g) Compound structures, (b,e,h) UV–vis absorbance spectra, and (c,f,i) fluorescence emission spectra of compounds only and compounds bound to UnaG. (a–c) UnaG and its original binding partner bilirubin (br), (d–f) UnaG and compound 2, and (g–i) UnaG and compound 4. Fluorescence emission spectra were taken at (c) 495 nm excitation and (f,i) 535 nm excitation. (j) Properties of confirmed hit compounds and compounds bound to UnaG.
We evaluated the affinity and specificity of 2 and 4 binding to UnaG with respect to the native br ligand in competitive fluorescence titrations (Figure 3 and Table S2). We determined Kd values of 3 and 10 nM for UnaG–2 and UnaG–4, respectively, indicating the suitable high-affinity binding of the new ligands to the protein in the same binding pocket utilized by br (Figure 3). An additional direct fluorescence titration of 2 and 4 in the presence of bis(trimethylsilyl)acetamide (BSA) showed no significant enhancement of the fluorescence signal (Figure S8). These results demonstrate that the red-shifted and brighter fluorescence emission of UnaG–2 and UnaG–4 are directly due to the ligand binding UnaG rather than to any other nonspecific protein intercalation.
Figure 3.
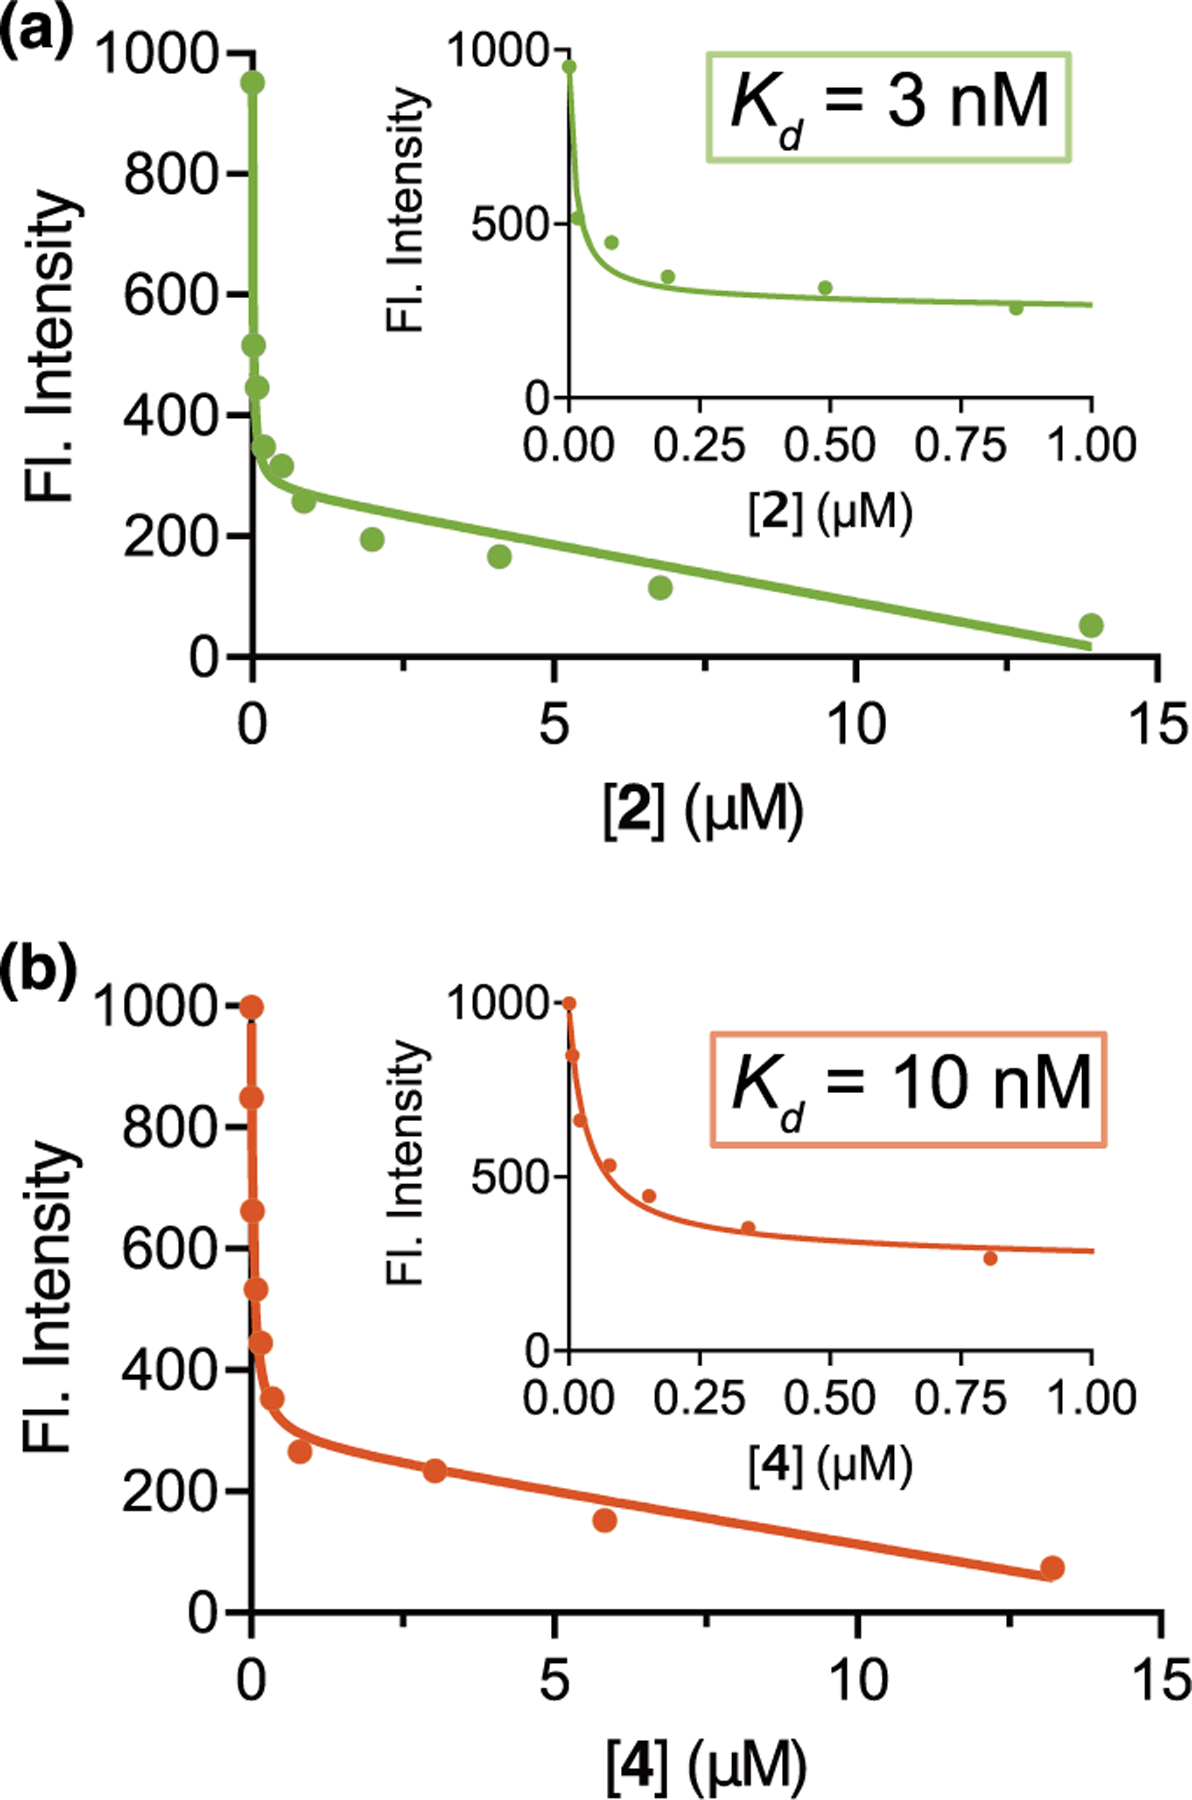
Competition titrations of (a) 2 and (b) 4 against UnaG–bilirubin (br). Increasing amounts of 2 and 4 were added to UnaG–br (50 and 25 nM for each titration, respectively), and the decreasing fluorescence emission intensity of the UnaG–br complex was recorded (495 nm excitation). A parallel set of titrations was performed using br and compounds 2 and 4 only for background subtractions. Insets: fits on a zoomed-in scale. Data shown are the mean of three technical replicates.
We implemented these new ligand pairs for the anaerobic imaging of commensal gut bacteria. Whereas the UnaG–4 fluorescence was not bright enough to be detected in cellular imaging (Figure S9), UnaG–2 fluorescence was detected in B. theta, both for cytosolic expression and for membrane expression of UnaG (UnaG+2 and SusG–UnaG+2, respectively, in Figure 4a). In the absence of UnaG, 2 did not appreciably label wild-type (wt) B. theta cells, indicating that it can be supplemented into live-cell imaging conditions without additional washing steps. In the SusG–UnaG B. theta strain, the additional accessibility of an outer-membrane-bound UnaG increased the fluorescence signal of labeled cells. We also demonstrated UnaG–2 labeling of E. coli under anaerobic imaging conditions. UnaG–2-labeled E. coli is significantly brighter than the puc19 control that did not express UnaG, and washing UnaG–2-labeled E. coli after labeling does not impact the fluorescence signal (Figure 4b). These imaging conditions indicate that the fluorescence intensity enhancement upon binding UnaG is sufficient such that 2 can be used similarly to a fluorogenic ligand such as br. The fluorescence images of cells labeled with UnaG–br or UnaG–2 are also distinguishable from one another, as fluorescence appears only in the 488 and 532 nm channels, respectively (Figure S10). This effective fluorogenicity enables the imaging of bacterial systems without requiring additional washing steps that are required of other labeling schemes such as immunostaining or HaloTag approaches.
Figure 4.
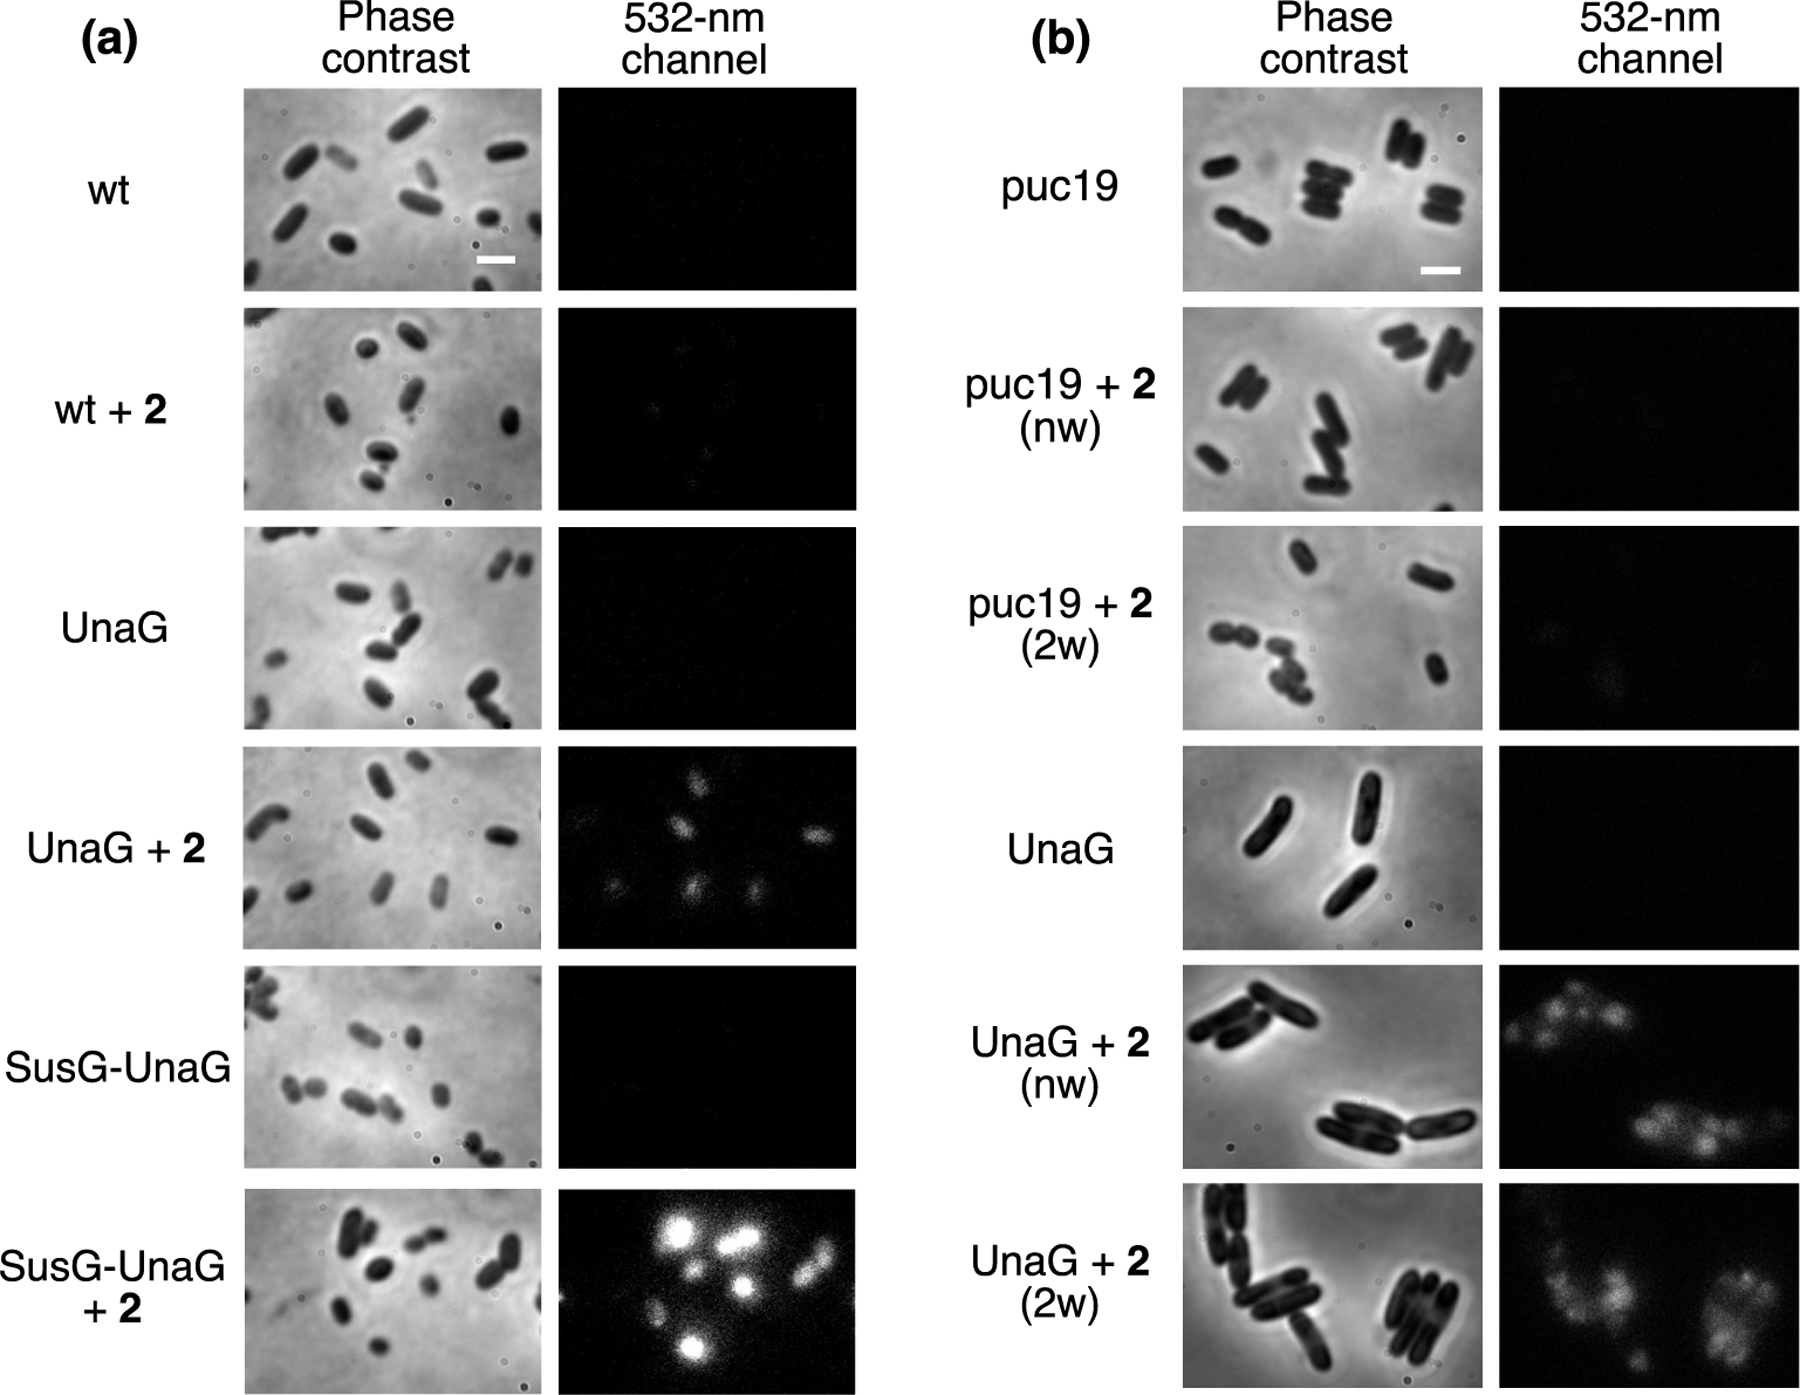
Phase-contrast and fluorescence imaging of (a) B. theta and (b) E. coli cells expressing UnaG. (a) B. theta expressing UnaG in the cytosol (UnaG) or on the outer membrane (SusG–UnaG) and incubated with 2 was compared with wild-type (wt) B. theta with 2. (b) E. coli cells expressing UnaG and incubated with 2 were imaged without washing (nw) or after two washes (2w), and they were compared with the puc19 control, which does not express UnaG. Cells were imaged with 532 nm illumination. Scale bars: 2 μm. All fluorescence images are on the same brightness scale.
Just as the bluer UnaG–br and the redder BBFP IFP2.0–bv can be used as two-color imaging FP pairs,24 UnaG–2 and IFP2.0–bv can also label different species in mixed anaerobic bacterial cultures. We imaged a mixed culture of UnaG-labeled B. ovatus and IFP2.0-labeled B. theta cells grown in bv and incubated with 2. The different species can be differentiated as they fluoresce in different color channels (532 nm excitation and 635 nm excitation, respectively) (Figure 5). Separately, we found that including 2 or bv in the labeling media provided exclusive labeling of UnaG and IFP2.0, respectively (Figure S11), demonstrating the specificity of each ligand-dependent FP for each color channel.
Figure 5.
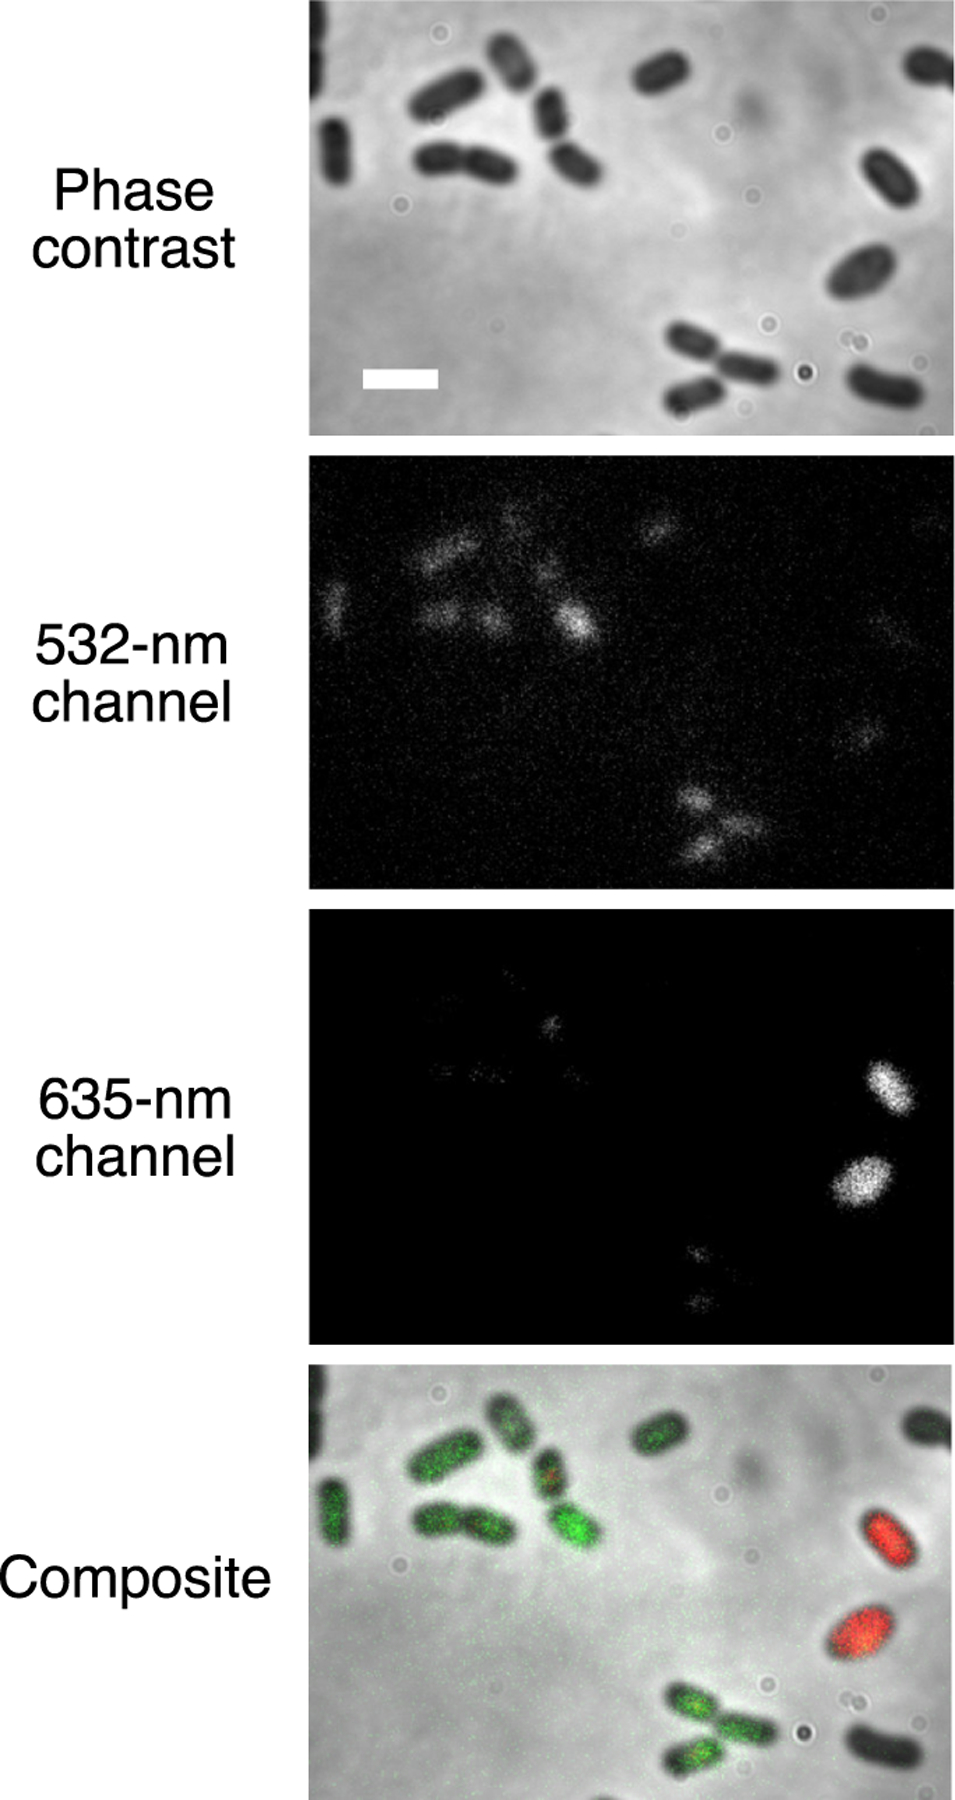
Phase-contrast and fluorescence images of a mixed culture of B. ovatus and B. theta expressing different BBFPs. B. ovatus expressing UnaG and labeled with 2 (green, 532 nm excitation) is distinguished from B. theta expressing IFP2.0 and labeled with biliverdin (red, 635 nm excitation) in separate color channels. Scale bar: 2 μm.
Overall, we developed a new orange-emitting UnaG–ligand pair that is suitable for anaerobic fluorescence microscopy and for probing oxygen-sensitive bacterial systems (Figures 4 and 5). Importantly, UnaG–2 diversifies the colors of the available UnaG–ligand pairs by adding a probe that fluoresces in the 532 nm excitation channel, commonly used for Cy3 dye and red fluorescent protein (RFP) imaging. In imaging B. theta, we observed UnaG–2 fluorescence for both cytoplasmic and outer-membrane labeling conditions, although the latter positioning increases the accessibility to yield brighter cells. Additionally, the UnaG–2 pair bleaches more slowly than UnaG–br due to the longer excitation wavelength (Figure S12). Anaerobic bacterial systems with high cellular background upon blue excitation are not suitable for labeling by the UnaG–br pair but could potentially be probed by the red-shifted UnaG–2 labeling system (Figure S13). Likewise, UnaG–2 can be coupled with IFP2.0–bv as complementary labeling pairs in two-color fluorescence microscopy using the 532 and 635 nm excitation channels, respectively (Figure 5). Because we have also demonstrated the utility of UnaG–2 in E. coli under anaerobic conditions (Figure 4b), we envision that studies of oxygen-sensitive mechanisms in this more common laboratory microbe will be further accessible via fluorescence-based investigations.
Although the brightness of the UnaG–2 pair is lower than that of UnaG–br, future improvements to the former can help boost the utility of the red-shifted pair. There may also be practical advantages to using UnaG–2 in the 532 nm microscopy channel over other BBFPs, such as the choice of other coupled labels (for minimal cross-talk between channels) or the availability of filters and excitation sources. Whereas the intrinsic fluorescence (autofluorescence) of bacterial cells can be used to probe cellular growth, endogenous flavins decrease the sensitivity and dynamic range for detecting robust signals from GFP and other green-emitting FPs.32 Relative to the green UnaG–br, creating a brighter red-shifted UnaG–2 pair will enable better signal-to-background measurements, as intrinsic cellular background decreases with increasing excitation wavelength.
Because of the nature of the compound library chosen for HTS, the confirmed hits found through our screening workflow are structurally diverse (Figure S2) yet dissimilar to classic families of organic fluorescent dyes like the xanthenes (fluorescein, rhodamine) and coumarins. Unsurprisingly, almost all of the hit compounds are extensively conjugated heterocyclic molecules, although most did not fluoresce sufficiently to carry on in spectral characterization during validation steps. We hypothesize that the high concentrations of compounds utilized in HTS contributed to the discrepancy: Fluorescence was detected in HTS but not detected during the validation experiments at the lower concentrations that were closer to experimental conditions suitable for imaging. Of note, the two best hits, 2 and 4, are derivatives of benzothiazole, which is a common heterocycle in medicinal chemistry and in studies of bioactive molecules33 and which is found in the fluorogenic label thioflavin T that is most commonly used in studies of protein aggregation. To our knowledge, this work describes the first application of a benzothiazole-based ligand in bacterial imaging and in oxygen-independent microscopy. Future improvements to 2 may take a more tailored synthetic approach to balance the improving membrane permeability while maintaining the molecular solubility through the strategic addition of additional hydrogen-bonding donors and acceptors.34
Because the UnaG–2 labeling system utilizes the wild-type UnaG protein, this system cannot be coupled to the native UnaG–br pair (blue, 488 nm excitation) for two-color imaging. However, our HTS methodology and hits reveal that the UnaG binding pocket is not exclusive to the original br ligand and can indeed bind other potentially fluorogenic molecules. Additional HTS may discover further molecules that bind UnaG and fluoresce in other microscopy channels, further diversifying UnaG into a wide palette of fluorescent colors. Likewise, additional HTS may reveal other exogenous or endogenous biomolecules that retain the cellular permeability and fluorogenicity of the native br ligand but also enable UnaG’s ligand-induced fluorescence in other microscopy channels. For more extensive multicolor setups, protein engineering will also be required to create exclusive pairs of UnaG variant–ligands such that each UnaG variant can recognize only one ligand.
Supplementary Material
ACKNOWLEDGMENTS
This work was supported by Army Research Office grant W911NF-18-1-0339 to J.S.B. and N.M.K. and by National Science Foundation grants Che1608553 and Che1904759 to E.N.G.M. H.E.C. was supported by the National Science Foundation Graduate Research Fellowship Program grant DGE-1256260. Research reported in this publication was supported by the Center for Chemical Genomics (CCG) at the University of Michigan Life Sciences Institute. We thank A. Robida for his assistance in high-throughput screening at CCG and his helpful discussions on screen optimization and A. Alt for input and ideas when initiating this project. We also thank E. Martens for access to the Biotek automated plate reader system and Z. Pfaffenberger for help with spectroscopy.
ABBREVIATIONS
- BBFP
bilin-binding fluorescent proteins
- br
bilirubin
- bv
biliverdin
- FbFP
flavin-based fluorescent protein
- FP
fluorescent protein
- GFP
green fluorescent protein
- HTS
high-throughput screening
- RFP
red fluorescent protein
Footnotes
ASSOCIATED CONTENT
Supporting Information
The Supporting Information is available free of charge at https://pubs.acs.org/doi/10.1021/acschembio.1c00391.
Experimental methods and materials, fluorescence spectra and characterization of the new UnaG–ligand pairs, structures and spectral characterization of the compounds found through high-throughput screening, growth curves with added ligand, equations for Kd calculations, and additional microscopy images of bacterial strains (PDF)
The authors declare no competing financial interest.
Contributor Information
Hannah E. Chia, Program in Chemical Biology, University of Michigan, Ann Arbor, Michigan 48109, United States
Karl J. Koebke, Department of Chemistry, University of Michigan, Ann Arbor, Michigan 48109, United States
Aathmaja A. Rangarajan, Department of Chemistry, University of Michigan, Ann Arbor, Michigan 48109, United States
Nicole M. Koropatkin, Department of Microbiology and Immunology, University of Michigan Medical School, Ann Arbor, Michigan 48109, United States
E. Neil G. Marsh, Program in Chemical Biology, Department of Chemistry, and Department of Biological Chemistry, University of Michigan, Ann Arbor, Michigan 48109, United States
Julie S. Biteen, Program in Chemical Biology and Department of Chemistry, University of Michigan, Ann Arbor, Michigan 48109, United States
REFERENCES
- 1.Tuson HH; Biteen JS Unveiling the Inner Workings of Live Bacteria Using Super-Resolution Microscopy. Anal. Chem. 2015, 87 (1), 42–63. [DOI] [PubMed] [Google Scholar]
- 2.Shcherbakova DM; Sengupta P; Lippincott-Schwartz J; Verkhusha VV Photocontrollable Fluorescent Proteins for Super-resolution Imaging. Annu. Rev. Biophys. 2014, 43, 303–329. [DOI] [PMC free article] [PubMed] [Google Scholar]
- 3.Rodriguez EA; Campbell RE; Lin JY; Lin MZ; Miyawaki A; Palmer AE; Shu X; Zhang J; Tsien RY The Growing and Glowing Toolbox of Fluorescent and Photoactive Proteins. Trends Biochem. Sci. 2017, 42 (2), 111–129. [DOI] [PMC free article] [PubMed] [Google Scholar]
- 4.Tsien RY The Green Fluorescent Protein. Annu. Rev. Biochem. 1998, 67 (1), 509–544. [DOI] [PubMed] [Google Scholar]
- 5.Subach FV; Verkhusha VV Chromophore Transformations in Red Fluorescent Proteins. Chem. Rev. 2012, 112 (7), 4308–4327. [DOI] [PMC free article] [PubMed] [Google Scholar]
- 6.Chia HE; Marsh ENG; Biteen JS Extending Fluorescence Microscopy into Anaerobic Environments. Curr. Opin. Chem. Biol. 2019, 51, 98–104. [DOI] [PubMed] [Google Scholar]
- 7.Karunatilaka KS; Cameron EA; Martens EC; Koropatkin NM; Biteen JS Superresolution Imaging Captures Carbohydrate Utilization Dynamics in Human Gut Symbionts. mBio 2014, 5 (6), e02172–14. [DOI] [PMC free article] [PubMed] [Google Scholar]
- 8.Péresse T; Gautier A Next-Generation Fluorogen-Based Reporters and Biosensors for Advanced Bioimaging. Int. J. Mol. Sci. 2019, 20 (24), 6142. [DOI] [PMC free article] [PubMed] [Google Scholar]
- 9.Drepper T; Eggert T; Circolone F; Heck A; Krauß U; Guterl J-K; Wendorff M; Losi A; Gärtner W; Jaeger K-E Reporter Proteins for in Vivo Fluorescence without Oxygen. Nat. Biotechnol. 2007, 25 (4), 443–445. [DOI] [PubMed] [Google Scholar]
- 10.Mukherjee A; Schroeder CM Flavin-Based Fluorescent Proteins: Emerging Paradigms in Biological Imaging. Curr. Opin. Biotechnol. 2015, 31, 16–23. [DOI] [PubMed] [Google Scholar]
- 11.Buckley AM; Petersen J; Roe AJ; Douce GR; Christie JM LOV-Based Reporters for Fluorescence Imaging. Curr. Opin. Chem. Biol. 2015, 27, 39–45. [DOI] [PubMed] [Google Scholar]
- 12.Losi A; Gardner KH; Möglich A Blue-Light Receptors for Optogenetics. Chem. Rev. 2018, 118 (21), 10659–10709. [DOI] [PMC free article] [PubMed] [Google Scholar]
- 13.Los GV; Encell LP; McDougall MG; Hartzell DD; Karassina N; Zimprich C; Wood MG; Learish R; Ohana RF; Urh M; Simpson D; Mendez J; Zimmerman K; Otto P; Vidugiris G; Zhu J; Darzins A; Klaubert DH; Bulleit RF; Wood KV HaloTag: A Novel Protein Labeling Technology for Cell Imaging and Protein Analysis. ACS Chem. Biol. 2008, 3 (6), 373–382. [DOI] [PubMed] [Google Scholar]
- 14.Grimm JB; Muthusamy AK; Liang Y; Brown TA; Lemon WC; Patel R; Lu R; Macklin JJ; Keller PJ; Ji N; Lavis LD A General Method to Fine-Tune Fluorophores for Live-Cell and in Vivo Imaging. Nat. Methods 2017, 14 (10), 987–994. [DOI] [PMC free article] [PubMed] [Google Scholar]
- 15.Lavis LD Teaching Old Dyes New Tricks: Biological Probes Built from Fluoresceins and Rhodamines. Annu. Rev. Biochem. 2017, 86 (1), 825–843. [DOI] [PubMed] [Google Scholar]
- 16.Buckley AM; Jukes C; Candlish D; Irvine JJ; Spencer J; Fagan RP; Roe AJ; Christie JM; Fairweather NF; Douce GR Lighting Up Clostridium Difficile: Reporting Gene Expression Using Fluorescent Lov Domains. Sci. Rep. 2016, 6, 23463. [DOI] [PMC free article] [PubMed] [Google Scholar]
- 17.Lobo LA; Smith CJ; Rocha ER Flavin Mononucleotide (FMN)-Based Fluorescent Protein (FbFP) as Reporter for Gene Expression in the Anaerobe Bacteroides Fragilis. FEMS Microbiol. Lett. 2011, 317 (1), 67–74. [DOI] [PMC free article] [PubMed] [Google Scholar]
- 18.Karunatilaka KS; Coupland BR; Cameron EA; Martens EC; Koropatkin NK; Biteen JS Proc. SPIE 2013, 8590, 85900K–7. [Google Scholar]
- 19.Tuson HH; Foley MH; Koropatkin NM; Biteen JS The Starch Utilization System Assembles around Stationary Starch-Binding Proteins. Biophys. J. 2018, 115 (2), 242–250. [DOI] [PMC free article] [PubMed] [Google Scholar]
- 20.Plamont M-A; Billon-Denis E; Maurin S; Gauron C; Pimenta FM; Specht CG; Shi J; Quérard J; Pan B; Rossignol J; Moncoq K; Morellet N; Volovitch M; Lescop E; Chen Y; Triller A; Vriz S; Le Saux T; Jullien L; Gautier A Small Fluorescence-Activating and Absorption-Shifting Tag for Tunable Protein Imaging in Vivo. Proc. Natl. Acad. Sci. U. S. A. 2016, 113 (3), 497–502. [DOI] [PMC free article] [PubMed] [Google Scholar]
- 21.Tebo AG; Moeyaert B; Thauvin M; Carlon-Andres I; Böken D; Volovitch M; Padilla-Parra S; Dedecker P; Vriz S; Gautier A Orthogonal Fluorescent Chemogenetic Reporters for Multicolor Imaging. Nat. Chem. Biol. 2021, 17 (1), 30–38. [DOI] [PMC free article] [PubMed] [Google Scholar]
- 22.Streett HE; Kalis KM; Papoutsakis ET A Strongly Fluorescing Anaerobic Reporter and Protein-Tagging System for Clostridium Organisms Based on the Fluorescence-Activating and Absorption-Shifting Tag Protein (FAST). Appl. Environ. Microbiol. 2019, 85 (14), e00622–19. [DOI] [PMC free article] [PubMed] [Google Scholar]
- 23.Monmeyran A; Thomen P; Jonquier̀e H; Sureau F; Li C; Plamont M-A; Douarche C; Casella J-F; Gautier A; Henry N The Inducible Chemical-Genetic Fluorescent Marker FAST Outper-forms Classical Fluorescent Proteins in the Quantitative Reporting of Bacterial Biofilm Dynamics. Sci. Rep. 2018, 8 (1), 1–11. [DOI] [PMC free article] [PubMed] [Google Scholar]
- 24.Chia HE; Zuo T; Koropatkin NM; Marsh ENG; Biteen JS Imaging Living Obligate Anaerobic Bacteria with Bilin-Binding Fluorescent Proteins. Current Research in Microbial Sciences 2020, 1, 1–6. [DOI] [PMC free article] [PubMed] [Google Scholar]
- 25.Kumagai A; Ando R; Miyatake H; Greimel P; Kobayashi T; Hirabayashi Y; Shimogori T; Miyawaki A A Bilirubin-Inducible Fluorescent Protein from Eel Muscle. Cell 2013, 153 (7), 1602–1611. [DOI] [PubMed] [Google Scholar]
- 26.Yu D; Gustafson WC; Han C; Lafaye C; Noirclerc-Savoye M; Ge W-P; Thayer DA; Huang H; Kornberg TB; Royant A; Jan LY; Jan YN; Weiss WA; Shu X An Improved Monomeric Infrared Fluorescent Protein for Neuronal and Tumour Brain Imaging. Nat. Commun. 2014, 5, 3626. [DOI] [PMC free article] [PubMed] [Google Scholar]
- 27.Kwon J; Park J-S; Kang M; Choi S; Park J; Kim GT; Lee C; Cha S; Rhee H-W; Shim S-H Bright Ligand-Activatable Fluorescent Protein for High-Quality Multicolor Live-Cell Super-Resolution Microscopy. Nat. Commun. 2020, 11 (1), 1–11. [DOI] [PMC free article] [PubMed] [Google Scholar]
- 28.Yu D; Baird MA; Allen JR; Howe ES; Klassen MP; Reade A; Makhijani K; Song Y; Liu S; Murthy Z; Zhang S-Q; Weiner OD; Kornberg TB; Jan Y-N; Davidson MW; Shu X A Naturally Monomeric Infrared Fluorescent Protein for Protein Labeling in Vivo. Nat. Methods 2015, 12 (8), 763–765. [DOI] [PMC free article] [PubMed] [Google Scholar]
- 29.Rodriguez EA; Tran GN; Gross LA; Crisp JL; Shu X; Lin JY; Tsien RY A Far-Red Fluorescent Protein Evolved from a Cyanobacterial Phycobiliprotein. Nat. Methods 2016, 13 (9), 763–769. [DOI] [PMC free article] [PubMed] [Google Scholar]
- 30.Zhang J-H; Chung TDY; Oldenburg KR A Simple Statistical Parameter for Use in Evaluation and Validation of High Throughput Screening Assays. J. Biomol. Screening 1999, 4 (2), 67–73. [DOI] [PubMed] [Google Scholar]
- 31.Jacob RT; Larsen MJ; Larsen SD; Kirchhoff PD; Sherman DH; Neubig RR MScreen: An Integrated Compound Management and High-Throughput Screening Data Storage and Analysis System. J. Biomol. Screening 2012, 17 (8), 1080–1087. [DOI] [PMC free article] [PubMed] [Google Scholar]
- 32.Mihalcescu I; Van-Melle Gateau M; Chelli B; Pinel C; Ravanat J-L Green Autofluorescence, a Double Edged Monitoring Tool for Bacterial Growth and Activity in Micro-Plates. Phys. Biol. 2015, 12 (6), 066016. [DOI] [PubMed] [Google Scholar]
- 33.Rouf A; Tanyeli C Bioactive Thiazole and Benzothiazole Derivatives. Eur. J. Med. Chem. 2015, 97, 911–927. [DOI] [PubMed] [Google Scholar]
- 34.Yang NJ; Hinner MJ Getting Across the Cell Membrane: An Overview for Small Molecules, Peptides, and Proteins. Methods Mol. Biol. 2015, 1266, 29–53. [DOI] [PMC free article] [PubMed] [Google Scholar]
Associated Data
This section collects any data citations, data availability statements, or supplementary materials included in this article.


