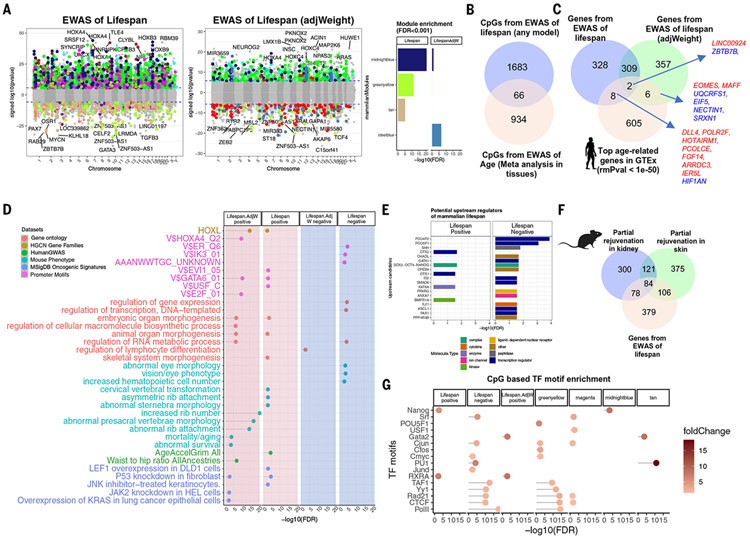
Fig. 5. EWAS of mammalian log-transformed maximum life span.
(A) CpG-specific association with maximum life span across n = 333 eutherian species. For EWAS, the mean methylation values of each CpG (per species) were regressed on log maximum life span. The right portion of the panel reports EWAS results after adjustment for average adult weight. Genome annotation indicates human hg19. Blue dotted line indicates Bonferroni-corrected two-sided P value < 1.8 × 10⁻⁶. The point colors indicate the corresponding modules. The bar plot indicates the top enriched (hypergeometric test, eutherian probes as background) modules for the top 1000 (500 negative CpGs, nominal P < 1.1 × 10⁻¹¹, FDR = 1 × 10⁻¹⁰; 500 negative and positive CpGs, nominal P < 1.5 × 10⁻²¹, FDR = 7.5 × 10⁻²⁰) significant CpGs for different EWASs. (B) Venn diagram of the overlaps between top hits from EWAS of maximum life span and meta-analysis of age [meta-analysis results are from (7); for additional analysis, see fig. S20]. (C) Venn diagram of the overlaps between the genes adjacent to the EWAS results and top age-related mRNA changes in human tissues (P < 1 × 10−50). (D) Gene set enrichment analysis of the genes proximal to CpGs associated with mammalian maximum life span. We only report enrichment terms that are significant after adjustment for multiple comparisons (hypergeometric FDR < 0.01) and contain at least five significant genes. The top three significant terms per column (EWAS) and enrichment database are shown. (E) Ingenuity potential upstream regulator analysis (40) of the differentially methylated genes related to mammalian maximum life span. Only significant (FDR < 0.05) regulators are represented in the bar plot. (F) Venn diagram of three gene lists. Gene list 1 is the top 646 genes adjacent to 1000 life span–related CpGs (500 positive and 500 negative). Gene lists 2 and 3 are based on CpGs that are differentially methylated (nominal Wald test P < 0.005, up to 500 positive and 500 negatively related CpGs) after OSKM overexpression in murine kidney (583 genes) and skin (686 genes) (39). We observed significant overlap between the gene lists (nominal Fisher’s exact P = 9.9 × 10⁻³⁰ for skin and life span; P = 4.5 × 10⁻²⁵ for kidney and life span). (G) Transcriptional factor motif enrichment analysis of life span modules and life span–related CpGs. The enrichment results for LifespanAdjWeight. negative were not significant. The overlap is assessed by a hypergeometric test for the CpGs within the motifs based on the human hg19 genome.

