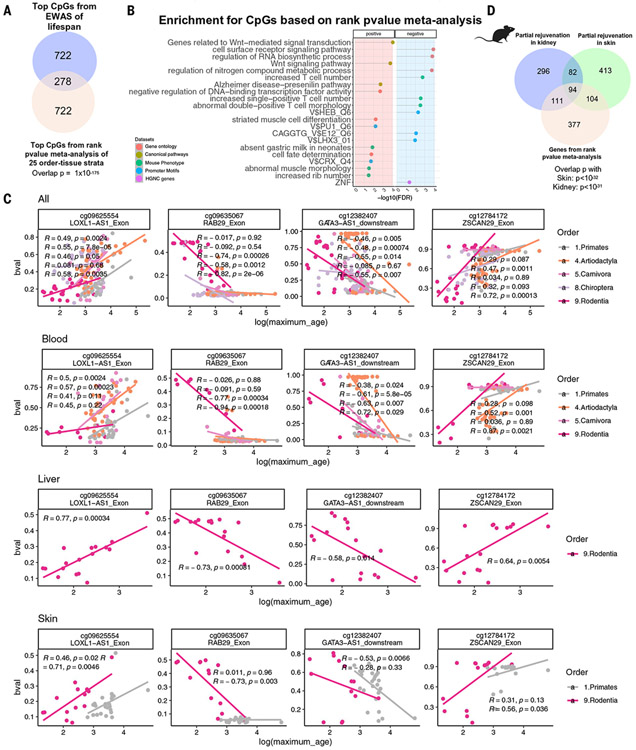
Fig. 6. CpGs linked to life span in various taxonomic orders and tissues.
Using the nonparametric rankPvalue method (33), we combined 25 EWAS of life span results from various taxonomic order or tissue type strata, calculating the significance of a CpG’s consistently high (or low) rank based on the 25 EWASs of log maximum life span (meta.lifespan and underlying EWAS results can be found in table S24 and data S19). (A) The overlap of top 1000 (500 per direction) meta.lifespan CpGs with EWAS of life span in all eutherians (nominal Fisher’s exact P = 1 × 10−175). (B) Scatter plots illustrating the top meta.lifespan CpGs categorized into different tissue-phylogenetic order strata. Each panel displays only the strata that exhibit significant relationships. Each dot represents a species colored by taxonomic order. Each row corresponds to a different selection of tissue type. “bval” denotes the beta value, measuring DNAm at a CpG site, with 0 indicating no methylation and 1 indicating full methylation. (C) Gene set enrichment analysis of the genes proximal to CpGs associated with mammalian maximum life span. We only report enrichment terms that are significant after adjustment for multiple comparisons (hypergeometric FDR < 0.01) and contain at least five significant genes. The top three significant terms per column (EWAS) and enrichment database are shown. (D) Venn diagram of three gene lists. Gene list 1 (the bottom circle) is the top 407 genes adjacent to 1000 meta.lifespan CpGs (500 positive and 500 negative). Gene lists 2 and 3 (the top circles) are based on CpGs that are differentially methylated (nominal Wald test P < 0.005, up to 500 positive and 500 negatively related CpGs) after OSKM overexpression in murine kidney (583 genes) and skin (686 genes) (39).

