

Abstract
Recent breakthroughs in neural network-based structure prediction methods, such as AlphaFold2 and RoseTTAFold, have dramatically improved the quality of computational protein structure prediction. These models also provide statistical confidence scores that can estimate uncertainties in the predicted structures, but it remains unclear to what extent these scores are related to the intrinsic conformational dynamics of proteins. Here, we compare AlphaFold2 prediction scores with explicit large-scale molecular dynamics simulations of 28 one- and two-domain proteins with varying degrees of flexibility. We demonstrate a strong correlation between the statistical prediction scores and the explicit motion derived from extensive atomistic molecular dynamics simulations and further derive an elastic network model based on the statistical scores of AlphFold2 (AF-ENM), which we benchmark in combination with coarse-grained molecular dynamics simulations. We show that our AF-ENM method reproduces the global protein dynamics with improved accuracy, providing a powerful way to derive effective molecular dynamics using neural network-based structure prediction models.
Introduction
AlphaFold21 and RoseTTAfold2 can infer protein structures based on sequence information with high accuracy. As a result, many projects have emerged that aim to improve the accessibility and usability of these structure prediction tools, most notably the AlphaFold Protein Structure Database,3 which currently provides predicted structures for over 200 million proteins,4 ColabFold,5 which combines fast homology search of MMseqs26 with AlphaFold2 and RoseTTAfold, and derivations to predict large protein complexes.7,8
AlphaFold uses the predicted local distance difference test (pLDDT) to estimate the accuracy of the predicted Cα positions (on a relative scale of 0–100) with experimental structures,1,9,10 but it remains unclear to what extent these measures can be linked to physical properties, such as protein dynamics. While low pLDDT scores have been associated with intrinsically disordered regions (IDRs),3,10−13 conditionally folded IDRs, i.e., protein regions that fold in the presence of a binding partner or post-translational modifications, can show high (>70–90) pLDDT scores. In this regard, AlphaFold2 often appears to favor the folded state,14 possibly as these are structurally overrepresented in the protein database. Highly dynamic protein conformations can also be identified by analyzing the combined pLDDT score, their solvent accessibility,15 and amino acid sequences that usually comprise a high proportion of charged and hydrophobic residues.14
AlphaFold2 also uses the predicted aligned error (PAE) as another metric to estimate positional errors for a given residue, i, between the predicted and experimental structures that are aligned relative to residue j (capped at 31.75 Å),1,3 an approach adapted from superposition-based metrics.16,17 PAE scores can be represented as a nonsymmetric matrix related to the model confidence for the relative position and orientation of different protein segments. It is thus possible that the PAE scores could be used to determine rigid cores and protein domains.11,18 Qualitative comparisons with atomistic molecular dynamics (aMD) simulations seem to confirm these observations.19 Recent studies have also explored other approaches to gain information about protein dynamics using the variation in the predicted structures with AlphaFold2,20 but a systematic strategy to infer protein dynamics from AlphaFold prediction scores is still lacking.
Here, we compare AlphaFold prediction scores for a set of 28 different single and two-domain proteins against aMD simulations, with the systems chosen to capture proteins with varying degrees of flexibility. Although aMD simulations provide an accurate basis for the structural characterization of the conformational space, the description of highly dynamical proteins, e.g., with intrinsically disordered regions (IDRs) or flexible domains, remains challenging and limited in system size and the timescales needed to capture the major conformational changes.21,22 To address this challenge, we propose a framework to convert the AlphaFold scores into elastic network models (ENMs).23−25 The core assumption behind an ENM is that the protein dynamics can be adequately described by fluctuation around an initial, native structure and can be used to propagate effective molecular dynamics of the system at a low computational cost.
ENMs are often used in combination with coarse-grained MD (cgMD) simulations. To sample the large-scale conformational dynamics of biomolecules with cgMD models, multiple heavy atoms are grouped into individual interaction centers or beads, reducing the system’s degrees of freedom and allowing for larger computational time- and size-scales. However, these approximations also lead to a reduction in accuracy, particularly for proteins, which is partially accounted for by the restraints from the ENMs.26 Among the various coarse-grained approaches, the MARTINI force field24,27−29 has proven to be highly versatile due to its balance between chemical specificity and performance.26,30 Initially developed for lipids,27 the MARTINI model was later extended to include parameters for proteins,24 DNA,31 RNA,32 carbohydrates,33 as well as many small molecules.34 The latest MARTINI3 version29 has expanded available bead types, resulting in more accurate and detailed representations of functional groups, although both former and current models still struggle to properly balance the challenging protein–protein and protein–solvent interactions. In this regard, increased protein–water (P–W) interactions can improve the agreement with experimental data.35−39 Due to the introduced approximations, the MARTINI model also encounters difficulties in preserving secondary and tertiary structure elements of proteins, which is why it is often combined with ENMs23−25 or Go̅-type models40,41 in which the harmonic bonds are substituted by Lennard-Jones interactions.
After establishing a link between protein dynamics by benchmarking data from around 62 μs of aMD simulations and the statistical AlphaFold scores (pLDDT, PAE), we develop here an AlphaFold-optimized ENM (AF-ENM) and show that it can be used in combination with MARTINI cgMD simulations to increasing their usability for dynamical proteins.
Results
Correlation between AlphaFold Scores and Protein Dynamics
To probe how the pLDDT and PAE scores correlate with the protein conformational dynamics, we performed aMD simulations of 28 different proteins (Figure 1, Table S1, Figures S1–S28). Each protein was simulated for 2 μs, except the single-domain proteins (protein 24–26), which were simulated for 1 μs. Moreover, we used a 10.5 μs SAXS-reweighted ensemble for the two-domain model of the highly flexible heat shock protein 90 (NTD-MD construct of Hsp90, protein 28) from a previous study,42 leading to benchmarking data set of 61.5 μs aMD simulation. The aMD simulations were performed using the a99SB-disp force field, as it accurately captures both folded and disordered protein states.43
Figure 1.

Structure of 28 proteins used to compare statistical scores of AlphaFold with dynamics derived from atomistic MD simulations. The proteins are colored based on their pLDDT scores, with pLDDT scores ≤60 (dark blue) and residues with a pLDDT ∼100 (white).
To evaluate the global protein dynamics, we used the standard deviation of Cα–Cα distance σd across the cgMD trajectory (with N frames)
 |
1 |
Combined, the σds of all distances Cα–Cα can be represented as a matrix similar to the PAE scores. To assess the degree of flexibility of individual residues, we used the average standard deviation of the Cα-distances to the n (nonbonded) nearest amino acids (σd,n)
| 2 |
Unlike the widely used root-mean-square-fluctuation (RMSF) metric, the σd,n does not depend on structural alignment and is therefore well suited for (highly flexible) multidomain proteins. Overall, groups of residues with higher σd,20 and σd values can be interpreted as regions with high conformational flexibility.
In Figure S29, we test the correlation between pLDDT and σd,n scores (as described below) using different n values and different linear and nonlinear correlation metrics. In this regard, we used the Pearson correlation coefficient (R) as a measure of linear correlation, Spearman’s rank correlation (ρ) to assess the monotonic relationship between two variables, the Kendall rank correlation (τ) to test the ordinal association, as well as mutual information (MI) correlation as a measure of the mutual dependency. To further test σd,n, we also compared correlations using all Cα atoms in a given sphere instead of considering only the n closest residues (Figure S29b,d). Overall, we find that using a specific number of nearest Cα atoms provides a higher correlation relative to a fixed sphere approach. The highest R is achieved with n = 13, while ρ and τ peak at 46 and MI correlation at 37, with ρ showing the highest values. We find that n = 20 gives a reasonable compromise between all correlation scores, with a minimal dependency on the number of atoms, as values ranging from 10 to 70 atoms yield similar results. In the following sections, we will solely refer to the linear correlation R as it is the most widely used correlation metric. However, we would note that the ρ values are slightly higher, indicating that the pLDDT vs σd,20 have a monotonic character, which is not fully captured by the linear correlation analysis.
A comparison between the PAE (in blue) and σd (in red) matrices, as well as the pLDDT and σd,20 scores, for the 28 systems, are shown in Figure 2, with a more detailed analysis of the individual proteins in Figures S1–S28. We note that high pLDDT scores correspond to low σd,20 values, with an overall correlation coefficient R of 0.65, with a 1 Å increase in the σd,20 corresponding to a 9-unit decrease of the pLDDT score. The overall linear regression across all tested proteins is
| 3 |
We observe that the R-values for the regressions of individual systems vary between 0.24 and 0.99, with a median value of 0.74 (Table S2). While the slopes vary from −1.3 to −21.7 (median of −10.3), the intercept range is between 94.1 and 106.3 (median of 101.3). Regions with low pLDDT scores generally correspond to high σd,20 values, particularly for disordered proteins regions, flexible loops, and linker regions. However, the relative heights of the peaks do not always align (e.g., Figure S4a). Our analysis thus suggests that the pLDDT scores can be used to identify more flexible regions within a given protein rather than comparing the absolute dynamics between different systems. Based on the regression between the PAE scores and σd metric across all systems, we find an R of 0.53, which is lower than for pLDDT—σd,20. Overall, a σd increase of 1 Å corresponds to a rise in PAE of 0.7 Å
| 4 |
The R-values for individual systems range from 0.25 to 0.92 (median 0.65), with intercepts within the 0.10 to 6.27 range (median 2.4) and the slopes between 0.38 and 4.83 (median 2.1), suggesting that the comparison of PAE values between the different systems have considerable uncertainties but rather good correlation with the explicit dynamics within the same system (Table S3). While the overall correlations are not necessarily high enough for a quantitative assessment of protein dynamics, we later show that a threshold-based approach can reliably differentiate between rigid and flexible regions and be used for constructing ENMs (see below).
Figure 2.

Overview of AlphaFold scores and protein dynamics metrics for all studied systems. A fully symmetric matrix indicates a perfect correlation between the AlphaFold and MD data. The figure is divided into 28 subfigures for each of the proteins shown in Figure 1. The top matrices show a comparison between (symmetrized) PAE matrices (blue) against the standard deviation of all Cα distances σd (red). The PAE scores range between 0.5 and 8.0, while the threshold for σd is set to <2.5 Å to enable better comparisons between the different systems. The bottom graphs compare the pLDDT scores (blue) and average standard deviation of the Cα-distances to the 20 closest amino acids σd,20 (red). See Figures S1–S28 for a detailed analysis of the individual systems.
Overall, the qualitative consistency of the pLDDT and PAE scores across all studied protein systems is striking. We notice that a PAE score of ∼8 Å appears to set a good threshold to visibly identify highly flexible regions as well as dynamically separated domains, corresponding to a σd of around 2.5 Å. For example, for protein systems 1, 2, 3, 21, and 27 (arginine repressor, WW domain-binding protein 4, nuclear factor of activated T-cells cytoplasmic 2, calmodulin, and linear diubiquitin), the PAE threshold correctly predicts the high inter-domain flexibility. AlphaFold also appropriately assesses the increased flexibility of N-terminal (system 7 and 16, sorcin and 30S ribosomal) and C-terminal tails (e.g., system 17, 20, 24, and 26 (cell division protein ZapA, riboflavin synthase, ubiquitin, and green fluorescent protein)), as well as dynamic linker regions (e.g., systems 2, 11, and 28 (WW domain-binding protein 4, chloride intracellular channel protein 1, and NTD-MD construct of Hsp90)). Generally, residues with lower pLDDT scores show higher PAE scores for residue pairs, suggesting that the PAE matrix also encodes the local dynamics, e.g., flexible loop regions. This close link between the scores might explain some of the observed discrepancies between PAE scores and the σd metric in systems 9, 22, and 23 (elongation factor Ts, peptidyl–prolyl cis–trans isomerase FKBP42, and DNA polymerase β). The differences could be attributable to the over- or underestimation of the conformational dynamics in a small linker section between two domains, with errors that could propagate and lead to significant changes in the PAE scores.
Based on a closer look at our largest and most complicated system within the data set, the NTD-MD construct of Hsp90 (protein 28, Figure S28), we observe an interplay of the abovementioned effects. This system is composed of an N-terminal domain (NTD) and a middle domain (MD), which are connected by a highly charged disordered linker (CL) region.44−48 In a previous study, we showed that conformational changes between compact and extended states are enabled by the dissociation of the NTD from the MD.42 Moreover, additional conformational dynamics is enabled by the flexible lid region in the NTD, which has well-established open and closed states and a potential unfolding of a β-sheet comprising β-strand 8 from the CL and β-strand 7 from the NTD,44,48 with partial unfolding leading to highly extended conformations.42 Thus, the Hsp90 NTD-MD model comprises a mixture of rigid domains, IDRs, and conditionally folded states. We indeed observe that the pLDDT scores and the σd,20 metrics for the Hsp90 construct within the individual regions are consistent with the flexibility derived from the aMD simulations. The exception is the β8-strand, where we notice a pLDDT score of >90 for one of the highly dynamic regions. This finding is consistent with the observation that AlphaFold generally predicts high pLDDT values for residues in conditionally folded areas.14 The PAE and σd scores between the NTD and MD domains are indeed significantly higher than those within each domain. For residues in the CL, both scores are also elevated, except for β-strand 8.
Thus, our analysis suggests that the pLDDT scores can be closely linked to local protein dynamics, whereas the PAE scores capture large-scale conformational flexibility, with both scores being closely related to each other. We also find that relatively small errors in the pLDDT scores easily propagate large mismatches between the PAE matrix and global protein dynamics.
Using AlphaFold Scores to Construct Elastic Network Models
To utilize the AlphaFold scores in explicit molecular dynamics simulations, we propose a framework to convert the statistical pLDDT and PAE scores into an elastic network model (ENM).23−25 An ENM can be constructed by adding harmonic potentials between, e.g., Cα atoms of the protein backbone of residues i and j according to
| 5 |
where Ven is the total potential energy of the elastic network (en), rc is the cutoff radius, and ken is the force constant for the harmonic bond. The ENM additionally relies on reference distances r0ij inferred from an initial reference structure, although this approach becomes inaccurate for proteins with multiple prominent conformational states. In the simplest formulation, a generic constant is used for all kens. ENMs can also be generated based on short-timescale aMD simulations (in the order of tens of ns) in which both the number as well as the strength of bonds are optimized.49−51 However, many processes, such as the dissociation events and large-scale conformational changes, lie outside the short sampling timescales, making this approach less well suited for highly dynamical systems.49 Here, we propose an alternative strategy to adapt bonds and force constant based on AlphaFold scores.
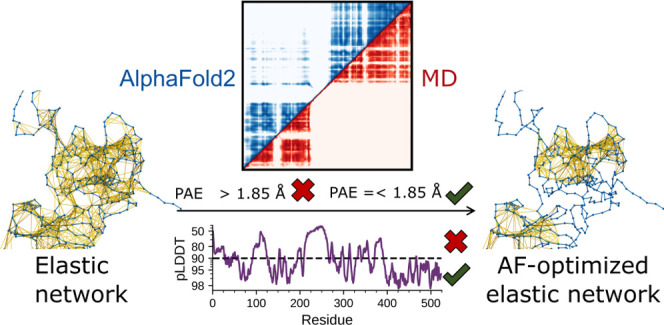
For our AlphaFold-optimized elastic network model (AF-ENM), we suggest scaling the force constants based on the PAE scores. To this end, we assume that the distance distribution between the Cα atoms corresponds to a normal distribution, with the predicted aligned error as the standard deviation. The distance distribution P for a given distance between residues i and j can therefore be defined as
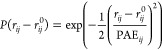 |
6 |
Since the PAE matrix is generally not symmetrical, we use the average value between residue PAEij and PAEji. The relative free energy ΔG(r) can be calculated from the distance distribution
| 7 |
By combining eqs 6 and 7, the force constant ken for the bond between residues i and j can be defined as
| 8 |
where kB is the Boltzmann constant and T is the temperature.
ENMs are typically derived based on a single structure, but this can result in a significant underestimation of the global conformational dynamics. If multiple structures are available, it often remains unclear which of them (if any) would be suited to construct the ENM. For example, linear diubiquitin (Ub2, Figure S27) has different potential initial structures (Figure 3a). Ub2 is a highly flexible two-domain protein,38,52 in which the C-terminus of a proximal ubiquitin is linked to the N-terminus of a distal ubiquitin subunit. Different experimental structures have resolved Ub2 in both compact (PDB ID: 3AXC(53) and 4ZQS(52)) and open (PDB ID: 2W9N(54)) states, with Figure 3a also showing Ub2 as predicted by AlphaFold2.1 Depending on the initial conformations, the ENMs between the individual Ub-domains are vastly different, with the compact state (PDB ID: 4ZQS) having multiple bonds between the subunits, whereas the open model (PDB ID: 2W9N) shows no contacts.
Figure 3.

Construction of an elastic network model (ENM) based on AlphaFold for (a) diubiquitin (Ub2) ENMs with different starting structures. The protein is colored according to the residue number (from blue to yellow). The bonds and ENM (cutoff distance of 0.9 nm) between all Cα atoms are shown. (b) σd,20 vs pLDDT scatter plots combined across all systems shown in Figure 1. (c) Sensitivity and specificity for the pLDDT/σd,20 relations. The blue curves show the probability that a σd,20 value is below a cutoff value (represented by different transparency levels) when the corresponding pLDDT score is above a threshold value (x-axis). The red curves show the probability that σd,20 is above a cutoff value for residues with a pLDDT score below a threshold value. (d) Sensitivity and specificity for the σd/PAE relationship. The blue curves show the probability that a PAE score (x-axis) is below a threshold value and is associated with a σd below a threshold value (represented by different transparency levels). The red curves show the probability that a PAE and associated σd are above threshold values (true negative test). (e) Probability that an AF predicted distance deviates by more than 20% from the average distance estimated by aMD under different selection criteria. (f) Ratio of aMD-derived distances that differ by more than 20% from the AlphaFold predicted structure.
To account for this bias, we propose to use the AlphaFold scores to remove network bonds with high expected fluctuation (Figure 3). To this end, we used the pLDDT scores to identify residues of the rigid protein cores (low σd,20) and flexible/disordered regions (high σd,20) that we further used to construct an optimized AF-ENM. We identify a threshold that balances the probability of finding a pLDDT score above a specific value, corresponding to a low σd,20 (sensitivity or true positive rate) with the likelihood that the pLDDT score is below the threshold associated with a high σd,20 value (specificity or true negative rate). The specificity and sensitivity show an inverse relationship (Figure 3c). We observe an excellent balance between them for a pLDDT threshold of 90, demonstrating a true positive rate of 86.5% and a true negative rate of 80.1% at a σd,20 threshold of 2 Å as compared to 63.7 and 92.2% for a pLDDT threshold of 95, and 95.2 and 66.6% for a pLDDT threshold of 80.
While the pLDDT scores correlate with the local dynamics, the PAE scores are also good indicators of the global dynamics. We therefore use the PAEs to avoid over-constraining the conformational dynamics between two rigid regions in our AF-ENM. Similar to the dependency between pLDDT scores and σd,20, we obtain a good balance between the sensitivity and specificity of the PAE/σd relationship (Figure 3d), as indicated by the likelihood that a low PAE score corresponds to a low σd (sensitivity or true positive test) relative to the probability that a high PAE value corresponds to a high σd (specificity or true negative test). As for the pLDDT σd,20 relationship, we observe that the true positive and negative rates have an inverse relationship. Since the addition of a bond that spuriously restricts the dynamics is far more problematic than the absence of bonds in a rigid structure, we suggest that high sensitivity is more important than high specificity within the AF-ENM model. In this regard, we find that a PAE threshold of 2 Å provides a specificity of 98.8% and a sensitivity of 30.8%, compared to 99.8 and 14.0% for a PAE threshold of 1.5 Å, and 86.6 and 70.1% for a PAE threshold of 4 Å.
Finally, we also probed the effect of different rc on our AF-ENMs. We find that the Cα–Cα distances correlate with PAE values (Figure S30), with the likelihood of including a given bond in the AF-ENM strongly depending on the Cα–Cα distances (Figure 3e). By only using a pLDDT threshold of 90, the acceptance rate is around 82% for Cα–Cα distances between 8 and 10 Å and 73% for Cα–Cα distances between 18 and 20 Å (Figure 3e). In contrast, when a PAE threshold of 2.0 Å is added, these values decrease to 74 and 24%, while a PAE threshold of 1.5 Å leads to 56 and 1.4%. To assess the extent to which the accepted bonds are representative of the structural ensemble, we examined the probability of the discrepancy of Cα–Cα distances from AlphaFold and aMD simulations by more than 20% (Figure 3f). We observe that the deviation probability for a cutoff radius of 10 Å changes from 8.1 to 3.2% by including only distances with a pLDDT >90 and PAE <2 Å.
Based on these results, we used the following framework to construct AF-ENMs for MARTINI3 cgMD simulations: starting from an initial structure, we only considered residues with pLDDT scores >90 that are separated by at least two residues since the angle and bonded interactions account for their dynamics. Moreover, to balance sensitivity and specificity, we used a cutoff radius of 9 Å, with force constants determined by the PAE scores based on eq 8. For the AF-ENM cgMD simulations, we only consider bonds with k > 75 kJ/(mol·nm2), corresponding to a PAE threshold of 1.85 Å.
Testing the AF-ENM Together with Martini3
To test the AF-ENM approach, we compared MARTINI3 cgMD simulations with a standard ENM using a generic ken (500 kJ/(mol·nm2)), which is commonly used in MARTINI simulations,23,55 and the AF-ENM with a generic ken and PAE-scaled ken for three single-domain (protein 24–26, ubiquitin, lysozyme C, green fluorescent protein) and two proteins with two domains (protein 27 and 28, linear diubiquitin, NTD-MD construct of Hsp90) against aMD simulations. To estimate the difference in global dynamics, we performed principal component analysis (PCA) on the aMD trajectories (Cα only) to extract the two components with the highest variance.56,57 These components represent the proteins’ modes of motion with the most extensive conformational changes. We then project the backbone beads of the cgMD trajectories onto these modes and compare the resulting distributions with the multivariate Kullback–Leibler (KL) divergence58,59 (Figures S31–S35 and Table S4). A lower KL divergence corresponds to a higher similarity of two distributions and, therefore, a higher agreement between the global dynamics described by aMD and cgMD simulations.
Overall, we find that using AF-ENM instead of standard ENM leads to lower KL divergence (Table S4), with fairly low divergence between generic ken and PAE-scaled ken. The difference is particularly pronounced for systems with higher conformational dynamics. For small rigid ubiquitin (Figure S31), we observe a KL divergence of 1.1 for the cgMD simulation with ENM compared to 1.8 with AF-ENM. In the case of lysozyme C (Figure S32), which has more flexible loop regions, we observe a reduction in KL divergence from 4.5 to 1.4. We also compared the experimental B-factors against the RMSF obtained by MD simulations60 and found an overall small improvement using AF-ENM as compared to the generic ENM (Table S5). GFP with the flexible N-terminal helix (Figure S33) shows a KL divergence of 11.0 and 4.8 for ENM and AF-ENM, a similar reduction as for the larger and flexible NTD and MD domains (Figure S35), where we notice a decrease from 11.9 to 1.2 and from 9.0 to 4.8. This is also consistent if comparing two domains, where we observe a KL divergence of 9.4 and 5.9 for linear diubiquitin (Figure S35) and 10.5 and 4.4 for the combined NTD-MD construct (Figure S35). The improvement is primarily connected to the reduction in bonds used in the ENM, as we observe similar KL divergences if we double the force constants for our AF-ENM simulations or use a generic, shared ken (500 kJ/(mol·nm2)) (Table S4).
The advantage of using the AF-ENM with MARTINI3 cgMD simulations is particularly evident when combined with increased protein–water (P–W) interactions.35−39 In Figure 4, we compare the radius of gyration (Rg) distributions of our aMD ensembles with the cgMD simulations for linear Ub2 and the Hsp90 NTD-MD construct. Using a standard elastic network leads to an overly constrained and compact conformation, which fails to reproduce the experimental Rg value obtained from small-angle X-ray scattering (SAXS) experiments or the Rg distribution from aMD simulations. For Ub2, we observe an average Rg of 17.6 Å in our ENM simulation compared to 20.3 Å experimentally.38 At the same time, for the Hsp90 construct, the corresponding values are 30.2 and 34.5 Å.42 Using our AF-ENM increases conformational freedom and leads to broader Rg distributions centered around similar values compared to the ENM simulations (17.7 Å for Ub2 and 29.7 Å for NTD-MD construct). However, the increase in P–W interaction in combination with the AF-ENM simulations resulted in higher ratios of open conformations, which are in better agreement with aMD ensembles and experimental data, with average Rg values of 19.9 and 33.8 Å for Ub2 and the Hsp90 construct, respectively. Overall, combining the AF-ENM framework can improve the quality of the protein discerption in cgMD simulations relative to standard ENM. We find that the removal of the elastic network bonds between flexible regions is the main cause of the improvement while adding a PAE-based scaling of ken provides only a secondary, much smaller improvement.
Figure 4.

Comparison between aMD and cgMD simulations for linear Ub2 (protein 27) and the NTD-MD construct of Hsp90 (protein 28). (a, c) Radius of gyration (Rg) distributions obtained by aMD and cgMD simulations for (a) linear Ub2 and (c) the Hsp90 construct. (b, d) Comparison of the conformational space occupied by (b) linear Ub2 and (d) the Hsp90 construct. The purple areas show the occupied space in the aMD simulations by the proximal ubiquitin relative to (b) the distal one and (d) the N-domain relative to the M domain of Hsp90. The blue areas show the occupied space in the cgMD simulations with ENF, the green areas correspond to the cgMD simulations with AF-ENM, while the yellow areas relate to the cgMD simulations with increased protein–water interactions.
Discussion
While AlphaFold is primarily used to predict protein structures, it is becoming increasingly clear that it can also be a valuable tool for inferring protein dynamics, as shown here (cf. also refs (11, 14, 15, 18, 19)). Here, we performed a comprehensive comparison of 28 different systems to link AlphaFold confidence scores to metrics obtained by atomistic molecular dynamics simulations. While the timescales of the aMD simulations are well suited to investigate the local fluctuation in the studied proteins, our simulations are not long enough to capture the full conformational ensemble of these systems, including possible unfolding and high barrier crossing events associated with different conformational states. Nevertheless, considering these limitations, we find that the pLDDT scores correlate with the local residual dynamics, while the PAE scores also provide insight into large-scale conformational dynamics. Although these scores are suited to unambiguously identify highly flexible and rigid protein regions and inter-domain interactions, accurately describing conditionally folded states remains challenging. We observe an overall strong correlation between prediction scores and the MD data, although the R-value varies widely between the individual systems. A substantial part of the structural uncertainty of AlphaFold is thus unlikely to arise only from the protein dynamics, with the difference in sequence depth between proteins and sub-regions causing additional uncertainty in pLDDT and PAE scores.
Our quantitative analysis allowed us to construct elastic networks based on these statistical scores (Figure 5) that can be effectively combined with cgMD simulations. For this, we take advantage of AlphaFold’s ability to identify flexible regions between rigid domains. We find that a pLDDT threshold of 90 is sufficient to reliably specify well-defined structural elements, which should be conserved by the network. A PAE threshold between 1.5 and 2.0 Å appears to be well suited to avoid overly restrictive bonds between rigid sections. Since the magnitude of the Cα–Cα distance fluctuation correlates with the PAE score, the PAE matrix can be used to scale the force constants of the individual bonds. Our approach allows us to optimize an ENM with easily accessible or available data without relying on, e.g., additional atomistic simulations.49−51
Figure 5.

Schematic summary of the AF-ENM generation.
In this study, we have tested the combination of the AF-ENM method with the MARTINI3 coarse-grained force field. The MARTINI model is widely used to study large-scale dynamics of complex systems due to its compatibility with a wide range of (bio-)molecules.26,61,62 However, the structure-based character and design of the MARTINI protein model may limit its application for the exploration of large-scale conformational changes in proteins, particularly if transitions in the secondary structure elements are involved. cgMD models and MARTINI3 are commonly employed together with an elastic network, which introduces a strong bias toward the starting conformation. Despite these limitations, the cgMD/MARTINI3 models are rather adaptable, with various approaches available to capture large-scale conformational changes of proteins and with applications even on highly complex intrinsically disordered proteins.39,41
Our AF-ENM model represents a significant improvement over the conventional elastic models commonly employed together with the MARTINI simulations, as the AlphaFold prediction scores allow us to identify flexible regions as well as dynamics between rigid domains. By implementing an elastic network only in the rigid domains/regions, we are able to preserve the structural integrity of tertiary and quaternary elements while minimizing restraint on large-scale protein dynamics. This approach may be particularly useful for studying complex membrane proteins, where the heterogeneous environment may impede the use of more accurate protein model or for the characterization of the extensive ensembles of flexible multidomain proteins. We also find that a further minor improvement in the MARTINI3-simulations can be achieved when the force constants are explicitly scaled based on the PAE matrix.
While we have here tested AF-ENM in combination with an ENM-dependent MARTIN3 coarse-grained force field,29 our approach could also increase the accuracy of other cgMD approaches, particularly of force fields that rely on sequence alignment data to create knowledge-based potentials (e.g., AWSEM-MD63). In this regard, homology and sequence information is used to determine native contacts or even energy functions.64 As the AlphaFold models are also based on sequence and homology data, the prediction scores might already encode this type of information. Furthermore, our AF-ENM method could be used with small modifications to analytically determine effective protein dynamics via normal mode analysis65 by primarily relying on the PAE scores to scale the force constants of the harmonic potentials. Although this approach would not be applicable to highly dynamic systems, it could nevertheless provide an improved description over conventional ENMs for rigid proteins. Similar to the AF-ENM framework, the AlphaFold scores could possibly be applied to derive Go̅-models,40,41 which have been used as an alternative for elastic networks in MARTINI simulations. Hereby, the harmonic potentials would be replaced by van der Waals interactions, whose strength and occurrence would be controlled based on pLDDT and PAE scores. This approach could overcome the observed limitations in conditionally folded structural elements, such as the β8-strand of Hsp90.42 The AF-ENM framework could thus open up new avenues to incorporate structural information into molecular dynamics simulations.
Material and Methods
MD Simulations
Atomistic molecular dynamics (aMD) simulations were performed for 28 proteins (Figure 1), as summarized in Table S1. The aMD simulations were performed with Gromacs66 using the a99SB-disp force field43 at T = 310 K, with a 2 fs timestep and with the protein models embedded in a water–ion environment with 100 mM NaCl. The temperature and pressure were controlled with the velocity rescaling thermostat67 and Parrinello–Rahman barostat.68 The two-domain proteins (1–23 and 27) were simulated for 2 μs, whereas the single-domain constructs (24–26) were simulated for 1 μs. For model 28, the NTD-MD construct of heat shock protein 90 (Hsp90), we used a 10.5 μs ensemble from our previous study,42 which was combined from 26 individual a99SB-disp simulations and reweighted with SAXS data based on a Bayesian/maximum entropy approach69 (see ref (42) for further details).
Coarse-grained MD (cgMD) simulations (Table S4) were created based on the atomistic models using the MARTINI3 coarse-grained force field.29 The cgMD models were embedded in a 100 mM NaCl solution. The simulations were performed at T = 310 K in an NPT ensemble with the velocity rescaling thermostat67 and Parrinello–Rahman barostat68 using Gromacs66 and 20 fs timesteps. The cgMD simulation was performed with different ENMs. As reference ENMs, we used a cutoff distance of 0.9 nm with 500 kJ/(mol·nm2). For our newly introduced AF-ENM approach, we used a shared ken (500 kJ/(mol·nm2), AF-ENM (const)), kens calculated with eq 8, and kens with twice as large values as calculated with eq 8 (AF-ENMx2). Additional simulations were performed with AF-ENM and an extra 6% increased protein–water (P–W) interaction (AF-ENM + 6%). For the single-domain systems, cgMD simulations were performed with the standard ENM, AF-ENM, AF-ENM (const), and AF-ENMx2 for 10 μs each. For linear Ub2 and the NTD-MD construct, we ran 20 μs simulations with the standard ENM, AF-ENM, AF-ENM (const), AF-ENM + 6%, and AF-ENM + 6% (const).
Acknowledgments
This project was supported by the Knut and Allice Wallenberg Foundation (2019.0043 and 2019.0251) and Cancerfonden (pj200968). The authors are thankful for the computing time provided by SuperMUC at the Leibniz Rechenzentrum (Project: pn98ha), and Swedish National Infrastructure for Computing (SNIC 2022/1-29, LUMI Project ID: 465000179).
Supporting Information Available
The Supporting Information is available free of charge at https://pubs.acs.org/doi/10.1021/acs.jctc.2c01027.
Detailed comparison between the AlphaFold statistical scores and molecular dynamics simulations of the individual system; comparisons between aMD and cgMD simulations (PDF)
The authors declare no competing financial interest.
Notes
The simulation trajectories can be found in Zenodo, 10.5281/zenodo.7212856.
Supplementary Material
References
- Jumper J.; Evans R.; Pritzel A.; Green T.; Figurnov M.; Ronneberger O.; Tunyasuvunakool K.; Bates R.; Zidek A.; Potapenko A.; et al. Highly accurate protein structure prediction with AlphaFold. Nature 2021, 596, 583–589. 10.1038/s41586-021-03819-2. [DOI] [PMC free article] [PubMed] [Google Scholar]
- Baek M.; DiMaio F.; Anishchenko I.; Dauparas J.; Ovchinnikov S.; Lee G. R.; Wang J.; Cong Q.; Kinch L. N.; Schaeffer R. D.; et al. Accurate prediction of protein structures and interactions using a three-track neural network. Science 2021, 373, 871–876. 10.1126/science.abj8754. [DOI] [PMC free article] [PubMed] [Google Scholar]
- Varadi M.; Anyango S.; Deshpande M.; Nair S.; Natassia C.; Yordanova G.; Yuan D.; Stroe O.; Wood G.; Laydon A.; et al. AlphaFold Protein Structure Database: massively expanding the structural coverage of protein-sequence space with high-accuracy models. Nucleic Acids Res. 2022, 50, D439–D444. 10.1093/nar/gkab1061. [DOI] [PMC free article] [PubMed] [Google Scholar]
- Callaway E. ‘The entire protein universe’: AI predicts shape of nearly every known protein. Nature 2022, 608, 15–16. 10.1038/d41586-022-02083-2. [DOI] [PubMed] [Google Scholar]
- Mirdita M.; Schütze K.; Moriwaki Y.; Heo L.; Ovchinnikov S.; Steinegger M. ColabFold - Making protein folding accessible to all. Nat. Methods 2022, 19, 679–682. 10.1038/s41592-022-01488-1. [DOI] [PMC free article] [PubMed] [Google Scholar]
- Steinegger M.; Soding J. MMseqs. 2 enables sensitive protein sequence searching for the analysis of massive data sets. Nat. Biotechnol. 2017, 35, 1026–1028. 10.1038/nbt.3988. [DOI] [PubMed] [Google Scholar]
- Evans R.; O’Neill M.; Pritzel A.; Antropova N.; Senior A.; Green T.; Žídek A.; Bates R.; Blackwell S.; Yim J.. et al. Protein complex prediction with AlphaFold-Multimer, 2022. 10.1101/2021.10.04.463034. [DOI]
- Bryant P.; Pozzati G.; Zhu W.; Shenoy A.; Kundrotas P.; Elofsson A. Predicting the structure of large protein complexes using AlphaFold and Monte Carlo tree search. Nat. Commun. 2022, 13, 6028 10.1038/s41467-022-33729-4. [DOI] [PMC free article] [PubMed] [Google Scholar]
- Mariani V.; Biasini M.; Barbato A.; Schwede T. lDDT: a local superposition-free score for comparing protein structures and models using distance difference tests. Bioinformatics 2013, 29, 2722–2728. 10.1093/bioinformatics/btt473. [DOI] [PMC free article] [PubMed] [Google Scholar]
- Tunyasuvunakool K.; Adler J.; Wu Z.; Green T.; Zielinski M.; Zidek A.; Bridgland A.; Cowie A.; Meyer C.; Laydon A.; et al. Highly accurate protein structure prediction for the human proteome. Nature 2021, 596, 590–596. 10.1038/s41586-021-03828-1. [DOI] [PMC free article] [PubMed] [Google Scholar]
- Akdel M.; Pires D. E. V.; Porta Pardo E.; Jänes J.; Zalevsky A. O.; Mészáros B.; Bryant P.; Good L. L.; Laskowski R. A.; Pozzati G.; et al. A structural biology community assessment of AlphaFold 2 applications. Nat. Struct. Mol. Biol. 2021, 29, 1056–1067. 10.1038/s41594-022-00849-w. [DOI] [PMC free article] [PubMed] [Google Scholar]
- Ruff K. M.; Pappu R. V. AlphaFold and Implications for Intrinsically Disordered Proteins. J. Mol. Biol. 2021, 433, 167208 10.1016/j.jmb.2021.167208. [DOI] [PubMed] [Google Scholar]
- Binder J. L.; Berendzen J.; Stevens A. O.; He Y.; Wang J.; Dokholyan N. V.; Oprea T. I. AlphaFold illuminates half of the dark human proteins. Curr. Opin. Struct. Biol. 2022, 74, 102372 10.1016/j.sbi.2022.102372. [DOI] [PMC free article] [PubMed] [Google Scholar]
- Alderson T. R.; Pritišanac I.; Moses A. M.; Forman-Kay J. D.. Systematic identification of conditionally folded intrinsically disordered regions by AlphaFold2, 2022. 10.1101/2022.02.18.481080. [DOI] [PMC free article] [PubMed]
- Piovesan D.; Monzon A. M.; Tosatto S. C. E. Intrinsic Protein Disorder, Conditional Folding and AlphaFold2. Protein Sci. 2022, 31, e4466 10.1002/pro.4466. [DOI] [PMC free article] [PubMed] [Google Scholar]
- Zhang Y.; Skolnick J. Scoring function for automated assessment of protein structure template quality. Proteins 2004, 57, 702–710. 10.1002/prot.20264. [DOI] [PubMed] [Google Scholar]
- Zemla A. LGA: A method for finding 3D similarities in protein structures. Nucleic Acids Res. 2003, 31, 3370–3374. 10.1093/nar/gkg571. [DOI] [PMC free article] [PubMed] [Google Scholar]
- Jendrusch M.; Korbel J. O.; Sadiq S. K.. AlphaDesign: A de novo protein design framework based on AlphaFold, 2021. 10.1101/2021.10.11.463937. [DOI]
- Fowler N. J.; Williamson M. P. The accuracy of protein structures in solution determined by AlphaFold and NMR. Structure 2022, 30, 925–933. 10.1016/j.str.2022.04.005. [DOI] [PMC free article] [PubMed] [Google Scholar]
- Del Alamo D.; Sala D.; McHaourab H. S.; Meiler J. Sampling alternative conformational states of transporters and receptors with AlphaFold2. eLife 2022, 11, e75751 10.7554/eLife.75751. [DOI] [PMC free article] [PubMed] [Google Scholar]
- Zuckerman D. M. Equilibrium sampling in biomolecular simulations. Annu. Rev. Biophys. 2011, 40, 41–62. 10.1146/annurev-biophys-042910-155255. [DOI] [PMC free article] [PubMed] [Google Scholar]
- Camilloni C.; Pietrucci F. Advanced simulation techniques for the thermodynamic and kinetic characterization of biological systems. Adv. Phys.: X 2018, 3, 1477531 10.1080/23746149.2018.1477531. [DOI] [Google Scholar]
- Periole X.; Cavalli M.; Marrink S. J.; Ceruso M. A. Combining an Elastic Network With a Coarse-Grained Molecular Force Field: Structure, Dynamics, and Intermolecular Recognition. J. Chem. Theory Comput. 2009, 5, 2531–2543. 10.1021/ct9002114. [DOI] [PubMed] [Google Scholar]
- Monticelli L.; Kandasamy S. K.; Periole X.; Larson R. G.; Tieleman D. P.; Marrink S. J. The MARTINI Coarse-Grained Force Field: Extension to Proteins. J. Chem. Theory Comput. 2008, 4, 819–834. 10.1021/ct700324x. [DOI] [PubMed] [Google Scholar]
- Tirion M. M. Large Amplitude Elastic Motions in Proteins from a Single-Parameter, Atomic Analysis. Phys. Rev. Lett. 1996, 77, 1905–1908. 10.1103/PhysRevLett.77.1905. [DOI] [PubMed] [Google Scholar]
- Kmiecik S.; Gront D.; Kolinski M.; Wieteska L.; Dawid A. E.; Kolinski A. Coarse-Grained Protein Models and Their Applications. Chem. Rev. 2016, 116, 7898–7936. 10.1021/acs.chemrev.6b00163. [DOI] [PubMed] [Google Scholar]
- Marrink S. J.; Risselada H. J.; Yefimov S.; Tieleman D. P.; de Vries A. H. The MARTINI force field: coarse grained model for biomolecular simulations. J. Phys. Chem. B 2007, 111, 7812–7824. 10.1021/jp071097f. [DOI] [PubMed] [Google Scholar]
- de Jong D. H.; Singh G.; Bennett W. F.; Arnarez C.; Wassenaar T. A.; Schafer L. V.; Periole X.; Tieleman D. P.; Marrink S. J. Improved Parameters for the Martini Coarse-Grained Protein Force Field. J. Chem. Theory Comput. 2013, 9, 687–697. 10.1021/ct300646g. [DOI] [PubMed] [Google Scholar]
- Souza P. C. T.; Alessandri R.; Barnoud J.; Thallmair S.; Faustino I.; Grunewald F.; Patmanidis I.; Abdizadeh H.; Bruininks B. M. H.; Wassenaar T. A.; et al. Martini 3: a general purpose force field for coarse-grained molecular dynamics. Nat. Methods 2021, 18, 382–388. 10.1038/s41592-021-01098-3. [DOI] [PMC free article] [PubMed] [Google Scholar]
- Marrink S. J.; Tieleman D. P. Perspective on the Martini model. Chem. Soc. Rev. 2013, 42, 6801–6822. 10.1039/c3cs60093a. [DOI] [PubMed] [Google Scholar]
- Uusitalo J. J.; Ingolfsson H. I.; Akhshi P.; Tieleman D. P.; Marrink S. J. Martini Coarse-Grained Force Field: Extension to DNA. J. Chem. Theory Comput. 2015, 11, 3932–3945. 10.1021/acs.jctc.5b00286. [DOI] [PubMed] [Google Scholar]
- Uusitalo J. J.; Ingolfsson H. I.; Marrink S. J.; Faustino I. Martini Coarse-Grained Force Field: Extension to RNA. Biophys. J. 2017, 113, 246–256. 10.1016/j.bpj.2017.05.043. [DOI] [PMC free article] [PubMed] [Google Scholar]
- López C. A.; Rzepiela A. J.; de Vries A. H.; Dijkhuizen L.; Hunenberger P. H.; Marrink S. J. Martini Coarse-Grained Force Field: Extension to Carbohydrates. J. Chem. Theory Comput. 2009, 5, 3195–3210. 10.1021/ct900313w. [DOI] [PubMed] [Google Scholar]
- Alessandri R.; Barnoud J.; Gertsen A.; Patmanidis I.; Vries A.; Telles de Souza P. C.; Marrink S. Martini 3 Coarse-Grained Force Field: Small Molecules. Adv. Theory Simul. 2021, 5, 2100391 10.1002/adts.202100391. [DOI] [Google Scholar]
- Stark A. C.; Andrews C. T.; Elcock A. H. Toward optimized potential functions for protein-protein interactions in aqueous solutions: osmotic second virial coefficient calculations using the MARTINI coarse-grained force field. J. Chem. Theory Comput. 2013, 9, 4176–4185. 10.1021/ct400008p. [DOI] [PMC free article] [PubMed] [Google Scholar]
- Javanainen M.; Martinez-Seara H.; Vattulainen I. Excessive aggregation of membrane proteins in the Martini model. PLoS One 2017, 12, e0187936 10.1371/journal.pone.0187936. [DOI] [PMC free article] [PubMed] [Google Scholar]
- Larsen A. H.; Wang Y.; Bottaro S.; Grudinin S.; Arleth L.; Lindorff-Larsen K. Combining molecular dynamics simulations with small-angle X-ray and neutron scattering data to study multi-domain proteins in solution. PLoS Comput. Biol. 2020, 16, e1007870 10.1371/journal.pcbi.1007870. [DOI] [PMC free article] [PubMed] [Google Scholar]
- Jussupow A.; Messias A. C.; Stehle R.; Geerlof A.; Solbak S. M. O.; Paissoni C.; Bach A.; Sattler M.; Camilloni C. The dynamics of linear polyubiquitin. Sci. Adv. 2020, 6, eabc3786 10.1126/sciadv.abc3786. [DOI] [PMC free article] [PubMed] [Google Scholar]
- Thomasen F. E.; Pesce F.; Roesgaard M. A.; Tesei G.; Lindorff-Larsen K. Improving Martini 3 for Disordered and Multidomain Proteins. J. Chem. Theory Comput. 2022, 18, 2033–2041. 10.1021/acs.jctc.1c01042. [DOI] [PubMed] [Google Scholar]
- Sułkowska J. I.; Cieplak M. Selection of optimal variants of Go-like models of proteins through studies of stretching. Biophys. J. 2008, 95, 3174–3191. 10.1529/biophysj.107.127233. [DOI] [PMC free article] [PubMed] [Google Scholar]
- Poma A. B.; Cieplak M.; Theodorakis P. E. Combining the MARTINI and Structure-Based Coarse-Grained Approaches for the Molecular Dynamics Studies of Conformational Transitions in Proteins. J. Chem. Theory Comput. 2017, 13, 1366–1374. 10.1021/acs.jctc.6b00986. [DOI] [PubMed] [Google Scholar]
- Jussupow A.; Lopez A.; Baumgart M.; Mader S. L.; Sattler M.; Kaila V. R. I. Extended conformational states dominate the Hsp90 chaperone dynamics. J. Biol. Chem. 2022, 298, 102101 10.1016/j.jbc.2022.102101. [DOI] [PMC free article] [PubMed] [Google Scholar]
- Robustelli P.; Piana S.; Shaw D. E. Developing a molecular dynamics force field for both folded and disordered protein states. Proc. Natl. Acad. Sci. U.S.A. 2018, 115, E4758–E4766. 10.1073/pnas.1800690115. [DOI] [PMC free article] [PubMed] [Google Scholar]
- Tsutsumi S.; Mollapour M.; Graf C.; Lee C. T.; Scroggins B. T.; Xu W.; Haslerova L.; Hessling M.; Konstantinova A. A.; Trepel J. B.; et al. Hsp90 charged-linker truncation reverses the functional consequences of weakened hydrophobic contacts in the N domain. Nat. Struct. Mol. Biol. 2009, 16, 1141–1147. 10.1038/nsmb.1682. [DOI] [PMC free article] [PubMed] [Google Scholar]
- Tsutsumi S.; Mollapour M.; Prodromou C.; Lee C. T.; Panaretou B.; Yoshida S.; Mayer M. P.; Neckers L. M. Charged linker sequence modulates eukaryotic heat shock protein 90 (Hsp90) chaperone activity. Proc. Natl. Acad. Sci. U.S.A. 2012, 109, 2937–2942. 10.1073/pnas.1114414109. [DOI] [PMC free article] [PubMed] [Google Scholar]
- Lorenz O. R.; Freiburger L.; Rutz D. A.; Krause M.; Zierer B. K.; Alvira S.; Cuellar J.; Valpuesta J. M.; Madl T.; Sattler M.; Buchner J. Modulation of the Hsp90 chaperone cycle by a stringent client protein. Mol. Cell 2014, 53, 941–953. 10.1016/j.molcel.2014.02.003. [DOI] [PubMed] [Google Scholar]
- Mader S. L.; Lopez A.; Lawatscheck J.; Luo Q.; Rutz D. A.; Gamiz-Hernandez A. P.; Sattler M.; Buchner J.; Kaila V. R. I. Conformational dynamics modulate the catalytic activity of the molecular chaperone Hsp90. Nat. Commun. 2020, 11, 1410 10.1038/s41467-020-15050-0. [DOI] [PMC free article] [PubMed] [Google Scholar]
- López A.; Elimelech A. R.; Klimm K.; Sattler M. The Charged Linker Modulates the Conformations and Molecular Interactions of Hsp90. ChemBioChem 2021, 22, 1084–1092. 10.1002/cbic.202000699. [DOI] [PMC free article] [PubMed] [Google Scholar]
- Kanada R.; Terayama K.; Tokuhisa A.; Matsumoto S.; Okuno Y. Enhanced Conformational Sampling with an Adaptive Coarse-Grained Elastic Network Model Using Short-Time All-Atom Molecular Dynamics. J. Chem. Theory Comput. 2022, 18, 2062–2074. 10.1021/acs.jctc.1c01074. [DOI] [PMC free article] [PubMed] [Google Scholar]
- Romo T. D.; Grossfield A. Validating and improving elastic network models with molecular dynamics simulations. Proteins 2011, 79, 23–34. 10.1002/prot.22855. [DOI] [PubMed] [Google Scholar]
- Ahmed A.; Villinger S.; Gohlke H. Large-scale comparison of protein essential dynamics from molecular dynamics simulations and coarse-grained normal mode analyses. Proteins 2010, 78, 3341–3352. 10.1002/prot.22841. [DOI] [PubMed] [Google Scholar]
- Thach T. T.; Shin D.; Han S.; Lee S. New conformations of linear polyubiquitin chains from crystallographic and solution-scattering studies expand the conformational space of polyubiquitin. Acta Crystallogr., Sect. D 2016, 72, 524–535. 10.1107/S2059798316001510. [DOI] [PubMed] [Google Scholar]
- Rohaim A.; Kawasaki M.; Kato R.; Dikic I.; Wakatsuki S. Structure of a compact conformation of linear diubiquitin. Acta Crystallogr., Sect. D 2012, 68, 102–108. 10.1107/S0907444911051195. [DOI] [PubMed] [Google Scholar]
- Komander D.; Reyes-Turcu F.; Licchesi J. D.; Odenwaelder P.; Wilkinson K. D.; Barford D. Molecular discrimination of structurally equivalent Lys 63-linked and linear polyubiquitin chains. EMBO Rep. 2009, 10, 466–473. 10.1038/embor.2009.55. [DOI] [PMC free article] [PubMed] [Google Scholar]
- Alessandri R.; Souza P. C. T.; Thallmair S.; Melo M. N.; de Vries A. H.; Marrink S. J. Pitfalls of the Martini Model. J. Chem. Theory Comput. 2019, 15, 5448–5460. 10.1021/acs.jctc.9b00473. [DOI] [PMC free article] [PubMed] [Google Scholar]
- David C. C.; Jacobs D. J. Principal component analysis: a method for determining the essential dynamics of proteins. Methods Mol. Biol. 2014, 1084, 193–226. 10.1007/978-1-62703-658-0_11. [DOI] [PMC free article] [PubMed] [Google Scholar]
- Pearson K. L.III. On lines and planes of closest fit to systems of points in space. Lond., Edinburgh, Dublin Philos. Mag. J. Sci. 1901, 2, 559–572. 10.1080/14786440109462720. [DOI] [Google Scholar]
- Kullback S.; Leibler R. A. On Information and Sufficiency. Ann. Math. Stat. 1951, 22, 79–86. 10.1214/aoms/1177729694. [DOI] [Google Scholar]
- Perez-Cruz F.In Kullback–Leibler Divergence Estimation of Continuous Distributions, IEEE International Symposium on Information Theory, 2008; pp 1666–1670.
- Sun Z.; Liu Q.; Qu G.; Feng Y.; Reetz M. T. Utility of B-Factors in Protein Science: Interpreting Rigidity, Flexibility, and Internal Motion and Engineering Thermostability. Chem. Rev. 2019, 119, 1626–1665. 10.1021/acs.chemrev.8b00290. [DOI] [PubMed] [Google Scholar]
- Kjølbye L. R.; Pereira G. P.; Bartocci A.; Pannuzzo M.; Albani S.; Marchetto A.; Jiménez-García B.; Martin J.; Rossetti G.; Cecchini M.; et al. Towards design of drugs and delivery systems with the Martini coarse-grained model. QRB Discovery 2022, 3, e19 10.1017/qrd.2022.16. [DOI] [PMC free article] [PubMed] [Google Scholar]
- Alessandri R.; Grunewald F.; Marrink S. J. The Martini Model in Materials Science. Adv. Mater. 2021, 33, 2008635 10.1002/adma.202008635. [DOI] [PMC free article] [PubMed] [Google Scholar]
- Davtyan A.; Schafer N. P.; Zheng W.; Clementi C.; Wolynes P. G.; Papoian G. A. AWSEM-MD: protein structure prediction using coarse-grained physical potentials and bioinformatically based local structure biasing. J. Phys. Chem. B 2012, 116, 8494–8503. 10.1021/jp212541y. [DOI] [PMC free article] [PubMed] [Google Scholar]
- Yang H.; Xiong Z.; Zonta F. Construction of a Deep Neural Network Energy Function for Protein Physics. J. Chem. Theory Comput. 2022, 18, 5649–5658. 10.1021/acs.jctc.2c00069. [DOI] [PMC free article] [PubMed] [Google Scholar]
- Bahar I.; Atilgan A. R.; Erman B. Direct evaluation of thermal fluctuations in proteins using a single-parameter harmonic potential. Folding Des. 1997, 2, 173–181. 10.1016/S1359-0278(97)00024-2. [DOI] [PubMed] [Google Scholar]
- Abraham M. J.; Murtola T.; Schulz R.; Páll S.; Smith J. C.; Hess B.; Lindahl E. GROMACS: High performance molecular simulations through multi-level parallelism from laptops to supercomputers. SoftwareX 2015, 1–2, 19–25. 10.1016/j.softx.2015.06.001. [DOI] [Google Scholar]
- Bussi G.; Donadio D.; Parrinello M. Canonical sampling through velocity rescaling. J. Chem. Phys. 2007, 126, 014101 10.1063/1.2408420. [DOI] [PubMed] [Google Scholar]
- Parrinello M.; Rahman A. Polymorphic transitions in single crystals: A new molecular dynamics method. J. Appl. Phys. 1981, 52, 7182–7190. 10.1063/1.328693. [DOI] [Google Scholar]
- Bottaro S.; Bengtsen T.; Lindorff-Larsen K. Integrating Molecular Simulation and Experimental Data: A Bayesian/Maximum Entropy Reweighting Approach. Methods Mol. Biol. 2020, 2112, 219–240. 10.1007/978-1-0716-0270-6_15. [DOI] [PubMed] [Google Scholar]
Associated Data
This section collects any data citations, data availability statements, or supplementary materials included in this article.