

Abstract
The development of dendritic cells (DCs), including antigen-presenting conventional DCs (cDCs) and cytokine-producing plasmacytoid DCs (pDCs), is controlled by the growth factor Flt3 ligand (Flt3L) and its receptor Flt3. We genetically dissected Flt3L-driven DCs differentiation using CRISPR/Cas9-based screening. Genome-wide screening identified multiple regulators of DC differentiation including subunits of TSC and GATOR1 complexes, which restricted progenitor growth but enabled DC differentiation by inhibiting mTOR signaling. An orthogonal screen identified transcriptional repressor Trim33 (TIF-1γ) as a regulator of DC differentiation. Conditional targeting in vivo revealed an essential role of Trim33 in the development of all DCs, but not of monocytes or granulocytes. In particular, deletion of Trim33 caused rapid loss of DC progenitors, pDCs and the cross-presenting cDC1 subset. Trim33-deficient Flt3+ progenitors upregulated pro-inflammatory and macrophage-specific genes but failed to induce DC differentiation program. Collectively, these data elucidate mechanisms that control Flt3L-driven differentiation of the entire DC lineage, and identify Trim33 as its essential regulator.
One sentence summary:
The transcriptional regulator Trim33 controls Flt3L-driven dendritic cell differentiation.
INTRODUCTION
Dendritic cells (DCs) link innate and adaptive immunity by recognizing pathogens through pattern recognition receptors such as toll-like receptors (TLRs) and orchestrating antigen (Ag)-specific T cell responses (1). DCs are represented by two main types, namely interferon-producing plasmacytoid DCs (pDCs) and Ag-presenting conventional DCs (cDCs). pDCs recognize pathogen-derived nucleic acids through endosomal TLRs (TLR7 and TLR9), and rapidly produce type I interferon (IFN) and other cytokines (2, 3). Conversely, cDCs have dendritic morphology, high levels of MHC class II and other components of Ag presentation machinery, and can efficiently prime naive Ag-specific T cells. cDCs are comprised of two main subsets: XCR1+ cDC1s capable of antigen cross-presentation to CD8+ T cells, and CD11b+ SIRPa+ cDC2s specialized in the presentation of exogenous antigen to CD4+ T cells (4).
All DCs are short-lived myeloid cells that are continuously produced in the bone marrow (BM) through a process driven by the cytokine Flt3 ligand (Flt3L). Its receptor Flt3 is expressed on and maintains the expansion of multipotent hematopoietic progenitors, but is also expressed on committed DC progenitors and all mature DCs (5, 6). Both pDCs and cDCs, and only these cells, can develop in the sole presence of Flt3L from BM progenitors in vitro (7–9). All DCs are reduced in the lymphoid organs of Flt3L- or Flt3-deficient animals (10, 11), whereas administration of Flt3L (12, 13) or its genetic activation through an oncogenic mutation (14) expands DC numbers. This pathway differs from the Flt3L-independent generation of other myeloid cells, yet its molecular basis is incompletely understood. Thus, it is unclear how Flt3L signaling is fine-tuned to drive two opposite processes, i.e. the expansion of multipotent progenitors and their differentiation into DCs. Furthermore, the majority of known transcription factors (TF) (3, 15, 16) control the specification of certain DC subsets such as pDCs or cDC1s, rather than the entire DC differentiation pathway.
Here, we performed an unbiased genetic screening for regulators of Flt3L-driven DC differentiation independently from Flt3L-driven progenitor proliferation. Genome-wide screening identified multiple molecular regulators of the process and revealed that inhibition of mTOR signaling by TSC1 and GATOR1 is a critical molecular switch from progenitor growth towards DC differentiation. An orthogonal screen also identified the transcriptional cofactor Trim33 as an essential regulator of DC differentiation, which we confirmed by conditional targeting of Trim33 in mice. These results provide a mechanistic basis of the common Flt3L-dependent differentiation pathway of DC differentiation and establish Trim33 as a key transcriptional regulator of this pathway.
RESULTS
Subhead 1: Genome-wide genetic analysis of Flt3L-driven cell differentiation
To dissect Flt3L-driven DC differentiation, we used HoxB8-FL cells that are conditionally immortalized with the estrogen-inducible HoxB8 oncogene and grow as undifferentiated progenitors in the presence of estrogen and Flt3L (17, 18). These cells are multipotent, and upon transfer into sublethally irradiated recipients can generate myeloid cells, B lymphocytes and all DC subsets including cDC1s, cDC2s and pDCs (17, 19). In culture, removal of estrogen in the presence of Flt3L induces HoxB8-FL cells to differentiate into a mixture of functional pDCs and cDCs within 7 days (20, 21). While the generation of both cDC1s and cDC2s has been reported with Flt3L alone (17, 19), our Flt3L-containing culture of HoxB8-FL cells produced only pDCs and immature cDC2s unless additional signals such as Notch ligands are provided (22). To better characterize cDCs and pDCs derived from HoxB8-FL cells (Fig. S1A), we analyzed their transcriptome by RNA sequencing (RNA-Seq) and open chromatin by assay for transposase-accessible chromatin (ATAC-Seq). An unbiased comparison by principal component analysis (PCA) of the RNA-Seq and ATAC-Seq profiles of HoxB8-derived pDCs and cDCs to those of primary immune cell types in the Immgen database (23, 24) revealed the closest affiliation with primary pDCs and cDCs, respectively (Fig. S2A,B). We then compared these profiles directly with those of primary splenic DCs (25). By PCA of RNA-Seq and ATAC-Seq profiles, HoxB8-FL-derived pDCs and cDCs corresponded to primary pDCs and cDC2s, respectively (Fig. S2C,D). However, when compared to subset-specific transcriptional and epigenetic signatures of primary cDC2s, Hoxb8-FL-derived cDCs were less well-resolved from pDCs and cDC1s (Fig. S2E,F). HoxB8-FL-derived pDCs shared the expression of the core TF (e.g. Irf8, Tcf4, Runx2), functional effectors (e.g. Tlr7, Tlr9) and lineage markers (e.g. Cd300c, Bst2, Ly6d) with their primary counterparts, and lacked only certain lymphoid marker genes such as Dntt (Fig. S3 and Data file S1). HoxB8-FL-derived cDCs also expressed the core TF and functional signature (e.g. MHC cl. II genes and surface TLRs), although the expression of cDC2-enriched TF (e.g. Irf4, Klf4) was less prominent and cDC1-enriched TF (e.g. Batf3, Zfp366) were very low (Fig. S3 and Data file S1). They lacked the expression of cDC2-enriched Notch target genes (e.g. Dtx1, Esam) and of cDC1-specific genes, consistent with the absence of Notch ligands and other tissue-derived signals that drive optimal cDC differentiation. Overall, the observed generation of pDCs and immature cDCs allows the analysis of Flt3L-driven DC differentiation using HoxB8-FL cells.
To explore the mechanism of Hoxb8-FL progenitor cell differentiation into DCs, we performed a CRISPR/Cas9-based dropout screen using a genome-wide library of single guide RNAs (sgRNAs). We generated a Cas9-expressing Hoxb8-FL clone with an intact differentiation capacity (Fig. S1B,C); its viability during differentiation decreased over time but was intact at early passages, allowing large-scale screening. HoxB8-FL-Cas9 cells were transduced with the “Brie” sgRNA library targeting ~19,600 mouse genes with 4 sgRNA per gene (26). Cells were transduced at MOI<0.5 to limit multiple integrations at an estimated coverage of ~400 primary transfectants per sgRNA (Fig. 1A). Transduced cells growing in an undifferentiated state (with Flt3L and estrogen) were selected with puromycin and expanded to yield the initial progenitor sample (progenitors_0). Additional expansion for 6 days yielded the reference sample of progenitors. The cells were then differentiated in Flt3L without estrogen for 7 days, and both total differentiated DCs and sorted pDC and cDC samples were collected. The library from each sample, as well as from the original plasmid DNA (pDNA) was amplified, sequenced and analyzed for sgRNA content (Data file S2). The distribution of targeting sgRNA counts became progressively broader in the progenitor and DC samples (Fig. S4A), and significant depletion and enrichment of targeting sgRNAs were observed both in progenitors compared to pDNA, and in DCs compared to progenitors (Fig. S4B,C).
Figure 1. Genome-wide screen in Hoxb8-FL cells identifies candidate regulators of DC differentiation.
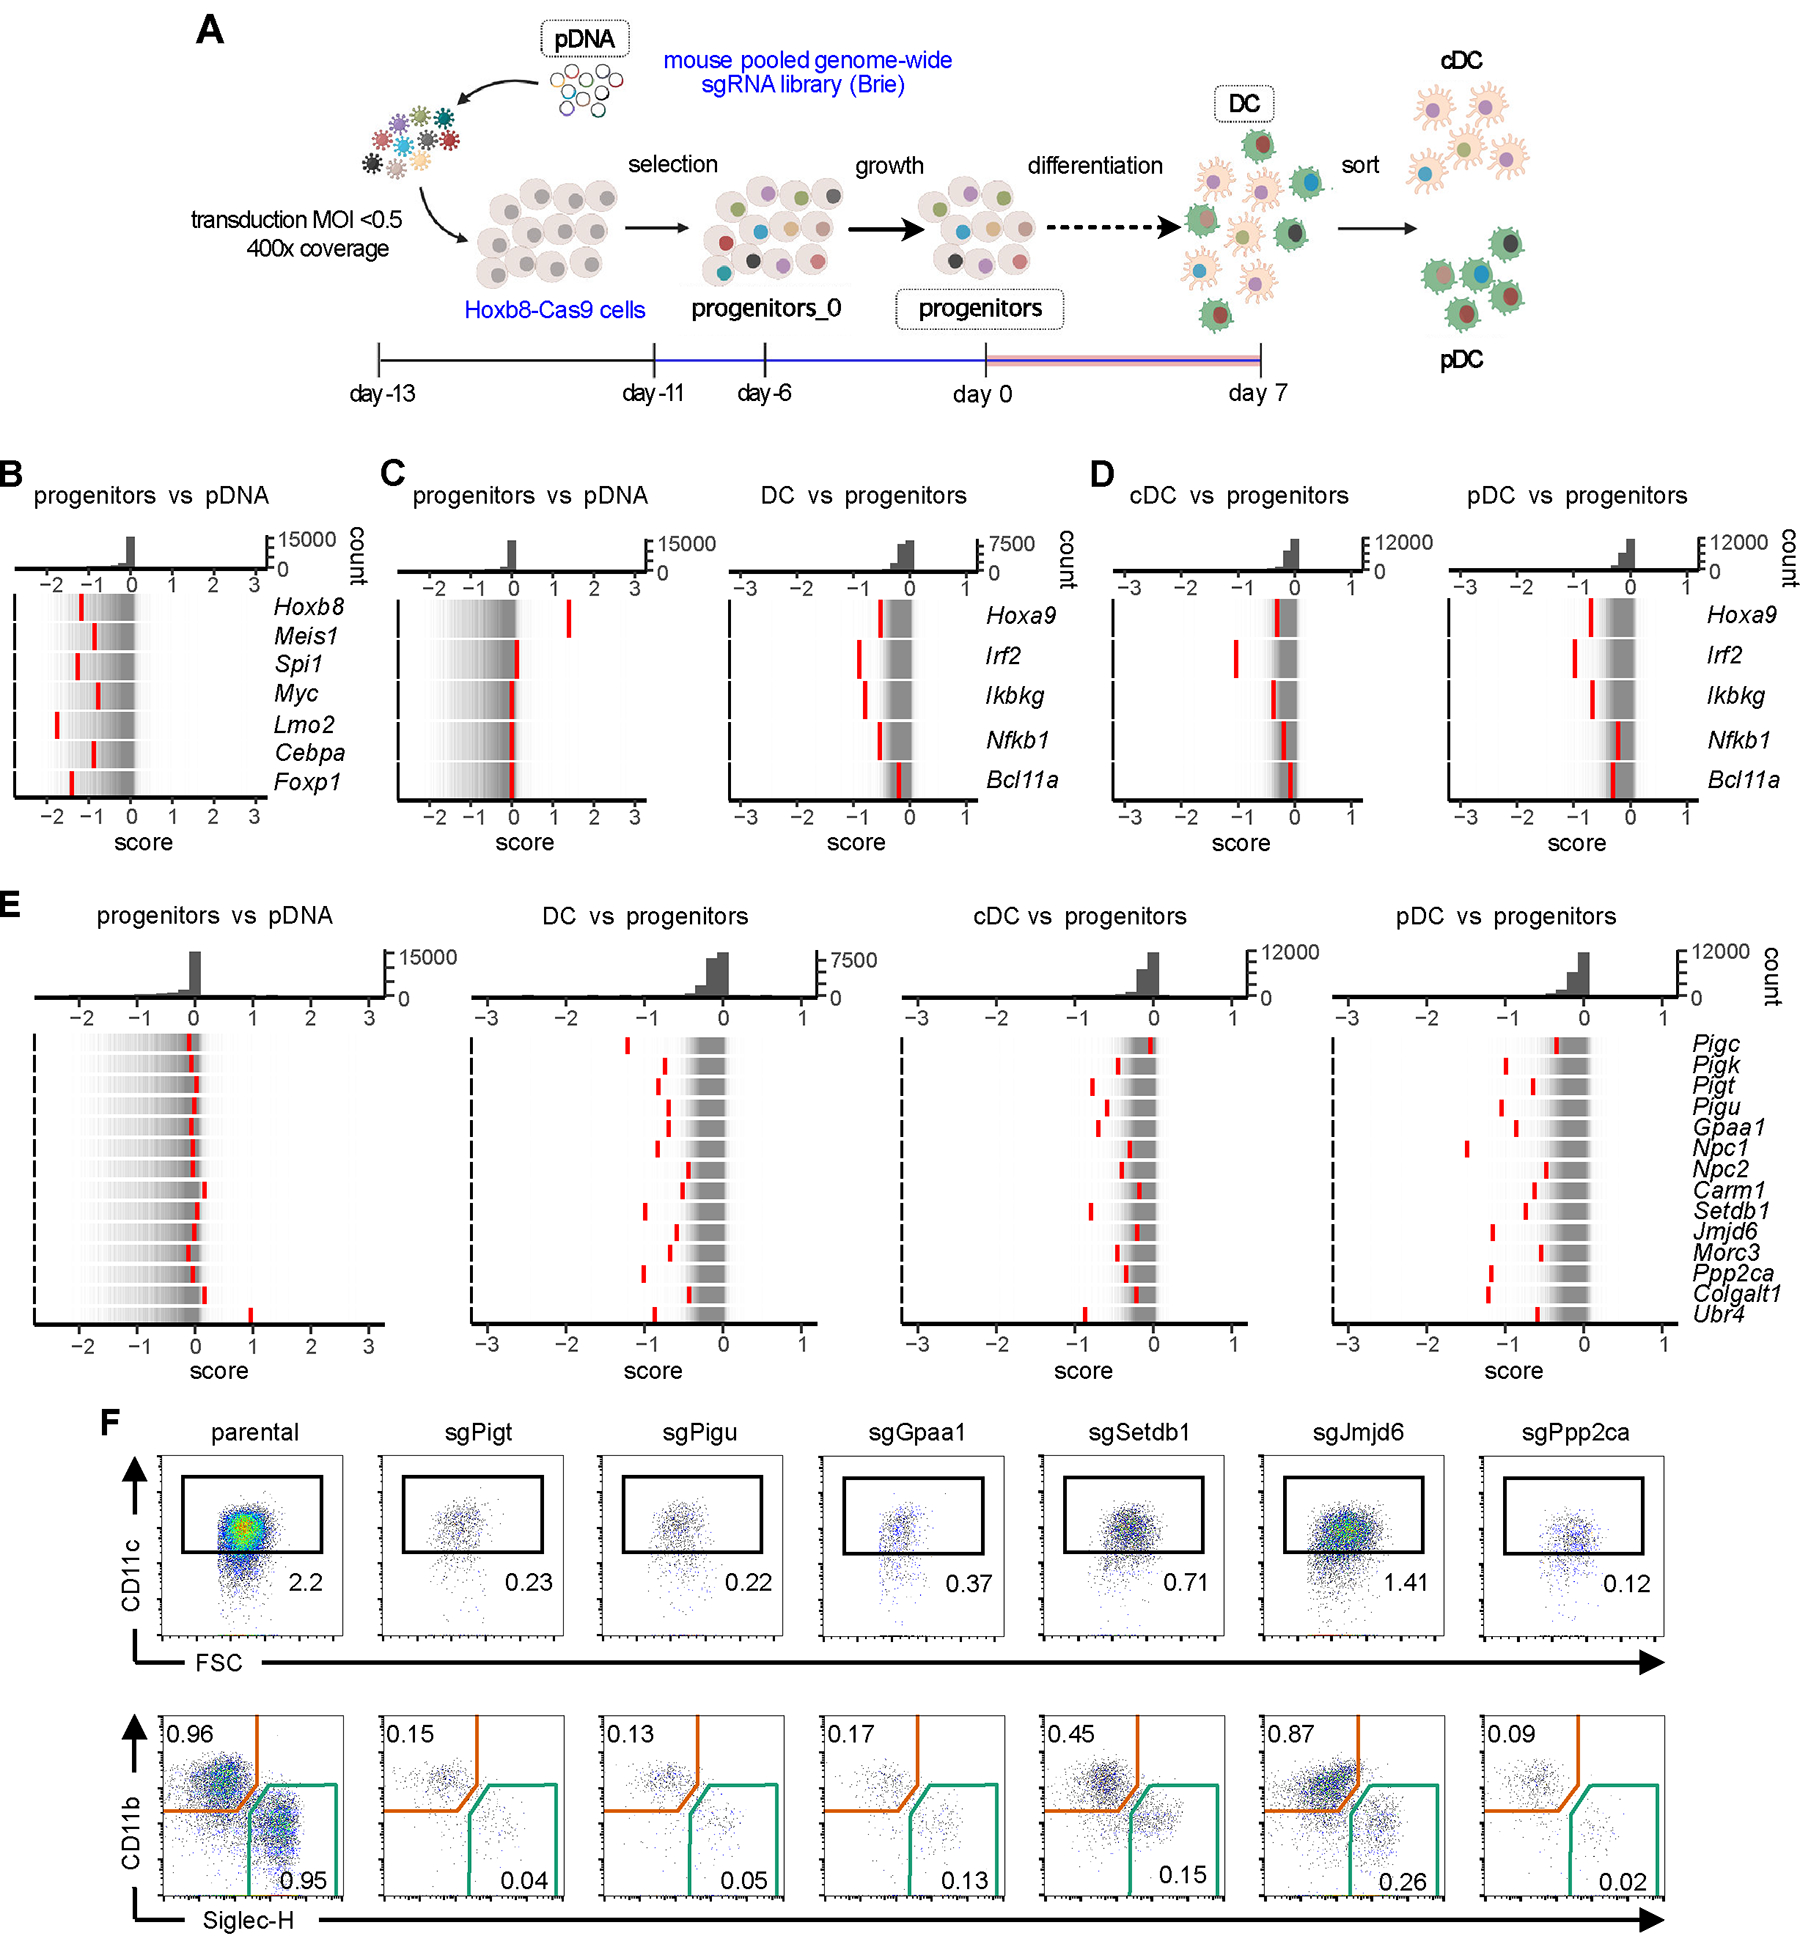
(A) Schematic of the screen, indicating the samples collected for sgRNA library analysis.
(B-E) Rug plots of gene distribution between indicated pairs of samples as measured by the CRISPTimeR score. Top panels show the distribution histogram of scores; bottom panels show individual genes (red bars) overlaid on the distribution of all genes (thin grey bars).
(B) CRISPTimeR score of select transcriptional regulators of progenitor growth in progenitors compared to pDNA.
(C-D) CRISPTimeR score of select transcriptional regulators of DC differentiation in total DCs (C) and in DC subsets (D) compared to progenitors.
(E) CRISPTimeR scores of candidate regulators of DC differentiation in total DCs and in DC subsets compared to progenitors.
(F) Differentiation capacity of Hoxb8-FL cells deficient for select candidate genes from panel E. Parental Hoxb8-FL-Cas9 cells or cells transduced with sgRNAs targeting indicated genes were differentiated into DCs and analyzed by flow cytometry as in Fig. S1. Upper row shows gated viable singlets with the CD11c+ DCs highlighted; lower row shows gated CD11c+ DCs with SiglecH+ pDCs and CD11b+ cDCs highlighted. Numbers indicate the fraction of cells in the gate among total singlets. Representative of two sgRNAs per gene. The low fraction of viable DCs among singlets reflects the diminishing DC output of Hoxb8-FL-Cas9 cells at late passages.
The samples were compared using the CRISPTimeR algorithm that identifies hits in dropout screens (27) (Data file S3). Depletion of multiple sgRNAs for a given gene yields a low CRISPTimeR score and identifies this gene as a positive regulator; conversely, sgRNA enrichment produces a high CRISPTimeR score corresponding to a negative regulator. As expected, genes with low CRISPTimeR score in progenitors vs pDNA were enriched for involvement in essential biological processes such as biosynthesis, translation and ribosome biogenesis (Fig. S4D). Furthermore, the vast majority of depleted genes were also depleted in a similar genome-wide dropout screen in undifferentiated HoxB8-FL cells (18). Indeed, they included the transforming oncogene Hoxb8 and key transcriptional regulators of hematopoietic progenitors such as Meis1, Lmo2, FoxP1, Cebpa and Myc (Fig. 1B). Importantly, they also included Spi1 encoding transcription factor PU.1, which activates Flt3 expression and controls multiple immune cell lineages including DCs (28). Among the few genes with higher CRISPTimeR score (i.e. negative regulators) were tumor suppressors Pten and Nf1; Crebbp, encoding the transcriptional coactivator CBP; and Tcf3, encoding the lymphoid transcription factor E2A that can serve as a context-dependent tumor suppressor (29) (Fig. S4E).
Next, we compared DC to progenitor samples, which should identify genes that regulate DC differentiation. Genes with neutral or positive CRISPTimeR scores in progenitors but low score in DCs included TF such as HoxA9, which facilitates Flt3L-driven DC development in vitro (30); Irf2, which promotes cDC2 development by restricting IFN-I signaling (31, 32); Nfkb1 and Ikbkg, components of the NF-κB pathway that controls DC differentiation (33); and Bcl11a, which is required in committed DC progenitors and pDCs (34, 35) (Fig. 1C). These genes had negative scores in both pDC and cDC samples (Fig. 1D), although Bcl11a showed stronger depletion in pDCs as expected. Some of the negative regulators of progenitor growth were also identified as such in DCs (Fig. S4F); among them was Pten, consistent with its negative role in cDC differentiation (36). Notably, the top gene that emerged as a negative regulator specifically in DCs was Bcor, encoding a TF that negatively controls Flt3L-driven DC differentiation (37). Thus, the screen identified multiple known regulators of DC differentiation independently of their role in progenitor proliferation.
Subhead 2: Identification of molecular regulators of DC differentiation
We explored the ability of the screen to identify additional regulators of DC differentiation. The genes with low CRISPTimeR scores in DCs (but normal scores in progenitors) included all five subunits of the glycosylphosphatidylinositol (GPI) transamidase complex (Pigc, Pigk, Pigt, Pigu and Gpaa1), which adds GPIs to newly synthesized proteins (38) (Fig. 1E). They also included Npc1 and Npc2, the subunits of the Niemann-Pick type C (NPC) protein complex that exports cholesterol from lysosomes to cytosol (39), consistent with the reduced cDC population in Npc1−/− mice (40). Additional low-scoring genes included Setdb1, a histone lysine methyltransferase required for hematopoietic cell differentiation (41); Jmjd6, a JmjC domain-containing enzyme with multiple functions (42); Ppp2ca, a catalytic subunit of Ser/Thr phosphatase 2A; and several others including Morc3, Colgalt1 and Ubr4 (Fig. 1E). All these genes had low scores in both pDCs and cDCs, suggesting their general role in DC differentiation (Fig. 1E). Targeting of these genes by individual sgRNAs in Hoxb8-FL cells resulted in defective DC differentiation, ranging from a near-complete block (GPI transamidase subunits, Ppp2ca) to a partial impairment (Setdb1, Jmjd6) (Fig. 1F).
To further confirm the relevance of the results to DC differentiation in vivo, we focused on coactivator-associated arginine methyltransferase 1 (CARM1), which methylates arginine residues in proteins and thereby controls multiple aspects of cellular physiology (43). Carm1 showed normal score in progenitors but low score in DCs, particularly in pDCs (Fig. 1E). We targeted Carm1 in HoxB8-FL cells using two different sgRNAs, which abolished CARM1 protein expression and methylation of its specific substrate PABP1 (44) (Fig. S5A). They also impaired Flt3L-driven HoxB8-FL differentiation into pDCs and cDCs (Fig. S5B,C), but not M-CSF-driven differentiation into CD206+ F4/80+ macrophages (Fig. S5D).
Carm1-deficient mice die at birth (45), but Carm1 is generally dispensable for hematopoietic cell differentiation in the adult under non-competitive conditions (46). To test the role of Carm1 in DC development in vivo in a sufficient number of animals, we transferred BM from mice with the deletion of Carm1 in hematopoietic cells (Carm1fl/fl Vav1-Cre, designated Carm1Δ) or from control Carm1fl/fl mice (CD45.2+) into CD45.1+ congenic recipients, and analyzed the resulting chimeras after 3–4.5 months. Flt3L-supplemented cultures of primary BM cells from Carm1Δ chimeras yielded significantly fewer pDCs (~4-fold) and cDC2s (~2-fold) (Fig. 2A,B). The spleens of Carm1Δ chimeras manifested significant ~2-fold reductions of pDCs and of the Esam+ Notch2-dependent cDC2s (47), whereas cDC1s were expanded (Fig. 2C,D). The effect was specific for the DC lineage because monocytes, granulocytes and B cells were unaffected and T cells showed a minor (<1.5-fold) decrease (Fig. 2D). We also examined the Cx3cr1+ DC subset that is developmentally related to pDCs and was recently designated as transitional DCs or tDCs (48–51). The fraction of tDCs in the spleens of Carm1Δ chimeras was significantly reduced (Fig. 2E,F). The results were replicated in a separate experiment, in which chimeras were analyzed 8 months after reconstitution (Fig. S6). The impaired differentiation of pDCs in Carm1Δ chimeras was further validated by a profound and specific impairment of pDC-dependent IFN-I production in vivo (Fig. S6D). Collectively, these data demonstrate that Carm1 is required for the optimal differentiation of pDCs, tDCs and cDC2s, validating this candidate in vivo.
Figure 2. Carm1 facilitates the differentiation of pDCs and cDC2s in vitro and in vivo.
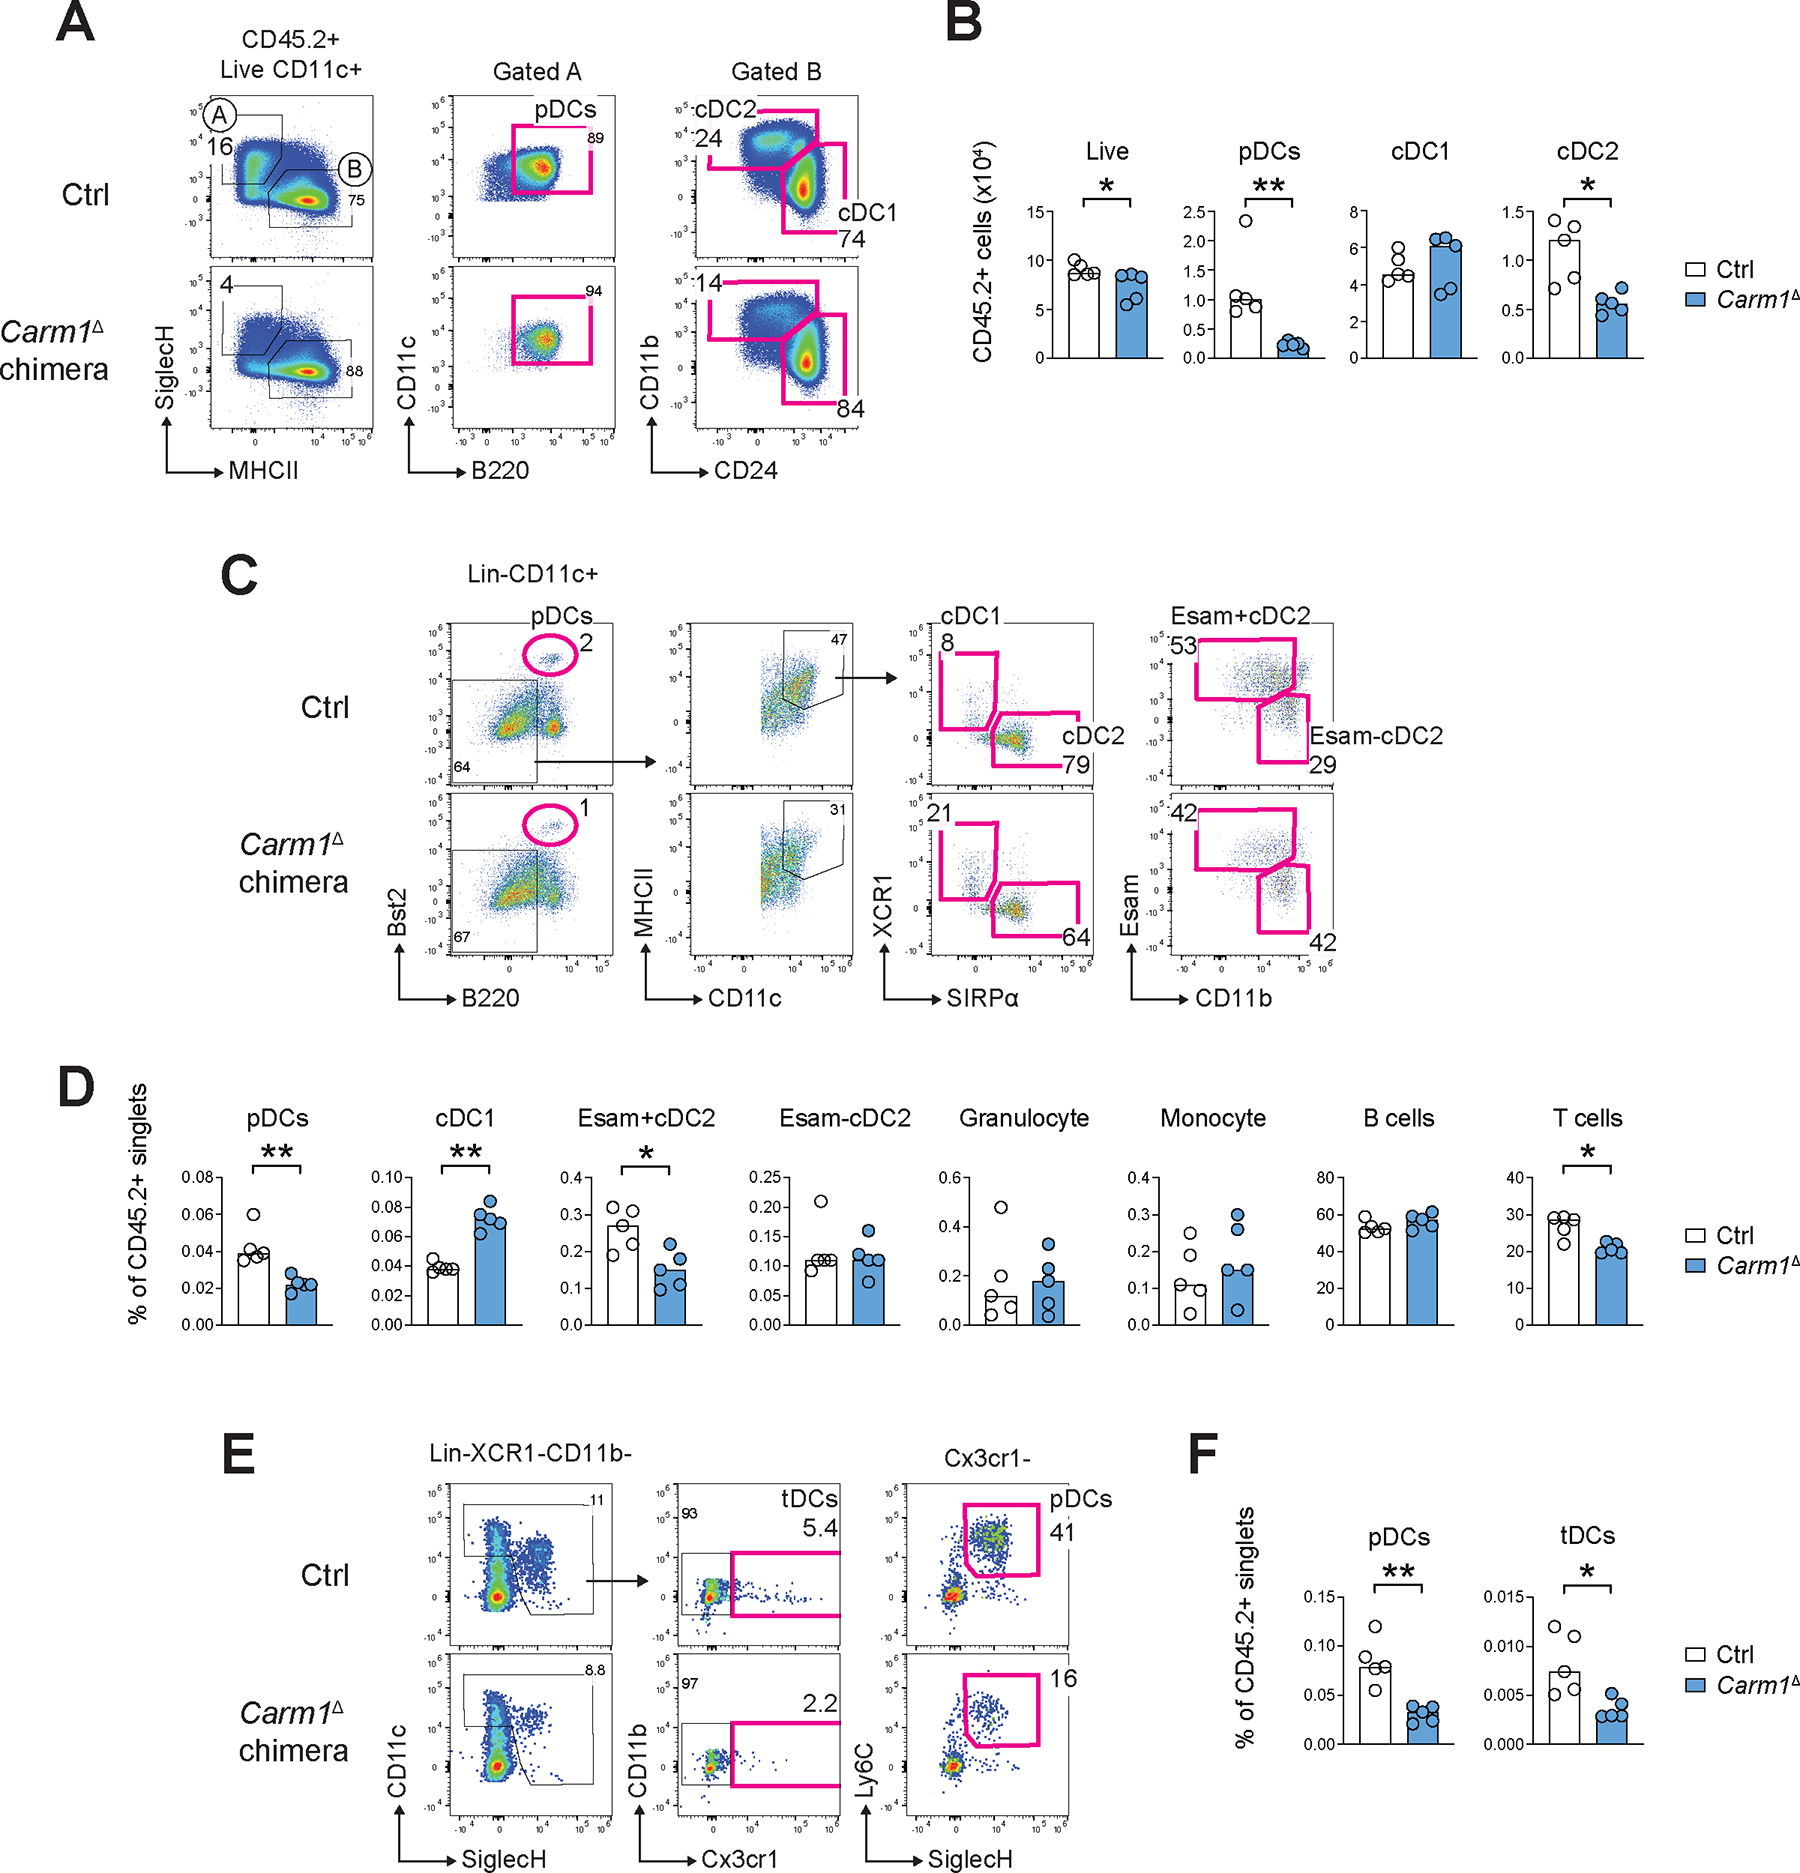
CD45.1+ recipient mice were reconstituted with CD45.2+ BM from mice with a pan-hematopoietic deletion of Carm1 (Carm1fl/fl Vav1-Cre, designated Carm1Δ) or Carm1fl/fl controls (Ctrl) and analyzed 3–4.5 month later. Donor reconstitution was >90%; all data represent gating on CD45.2+ donor cells.
(A-B) DC development in Flt3L-supplemented BM cultures. Shown are representative staining profiles of control or Carm1Δ cultures on day 7 of differentiation (A) and numbers of the resulting DC subsets per 106 seeded CD45.2+ BM cells (B).
(C-D) Primary DC populations in the spleen. Shown are representative staining profiles of control or Carm1Δ DCs (C) and fractions of DC subsets and other indicated cell types among CD45.2+ splenocytes (D).
(E-F) pDCs and tDCs in the spleens. Shown are representative staining profiles of control or Carm1Δ splenocytes highlighting Cx3cr1− pDCs and Cx3cr1+ tDCs (E), and fractions of these cell types among CD45.2+ splenocytes (F).
In all bar graphs, symbols represent cells from individual mice and bars represent median.
Statistical significance was determined by Mann-Whitney test (*, P < 0.05; **, P < 0.01).
Subhead 3: TSC- and GATOR1-mediated inhibition of mTOR signaling controls DC differentiation
The mammalian target of rapamycin (mTOR) signaling pathway coordinates cellular responses to nutrients and growth factors such as Flt3L, which signal through the PI3K/AKT pathway. The activation of mTOR is dampened by multiple negative regulators including the TSC and GATOR1 complexes (52, 53). Among the genes with the highest CRISPTimeR scores in progenitors were Tsc1 and Tsc2, encoding the two subunits of the TSC complex; as well as Nprl2, Nprl3 and Depdc5, encoding the three subunits of the GATOR1 complex (Fig. 3A). Conversely, genes encoding AKT1 and mTOR itself had low scores (Fig. 3A), highlighting a positive role of mTOR in Flt3L-driven proliferation of progenitors. Strikingly, the opposite was observed in all DC samples, in which TSC and GATOR1 components were among the lowest-scoring genes (Fig. 3B). Genes encoding additional negative regulators upstream (Strada and Flcn) and downstream (Foxo3) of mTOR signaling also showed relatively low scores in DCs. The requirement for TSC and GATOR1 was confirmed by the transduction of HoxB8-FL cells with individual sgRNAs targeting their subunits, which did not affect progenitor growth but essentially abolished the differentiation of all DCs (Fig. 3C). Time course analysis of differentiating TSC- or GATOR1-deficient HoxB8-FL cells showed that DC progenitors underwent massive apoptosis starting on day 4 (Fig. 3D), coinciding with the onset of terminal DC differentiation (20). Importantly, these results are consistent with the requirement for Tsc1 in DC differentiation in BM culture (54) and in vivo (55). Thus, TSC and GATOR1 complexes restrict Flt3L-driven progenitor growth but are specifically required for the survival of differentiating DCs.
Figure 3. TSC and GATOR1 complexes are required for DC differentiation.
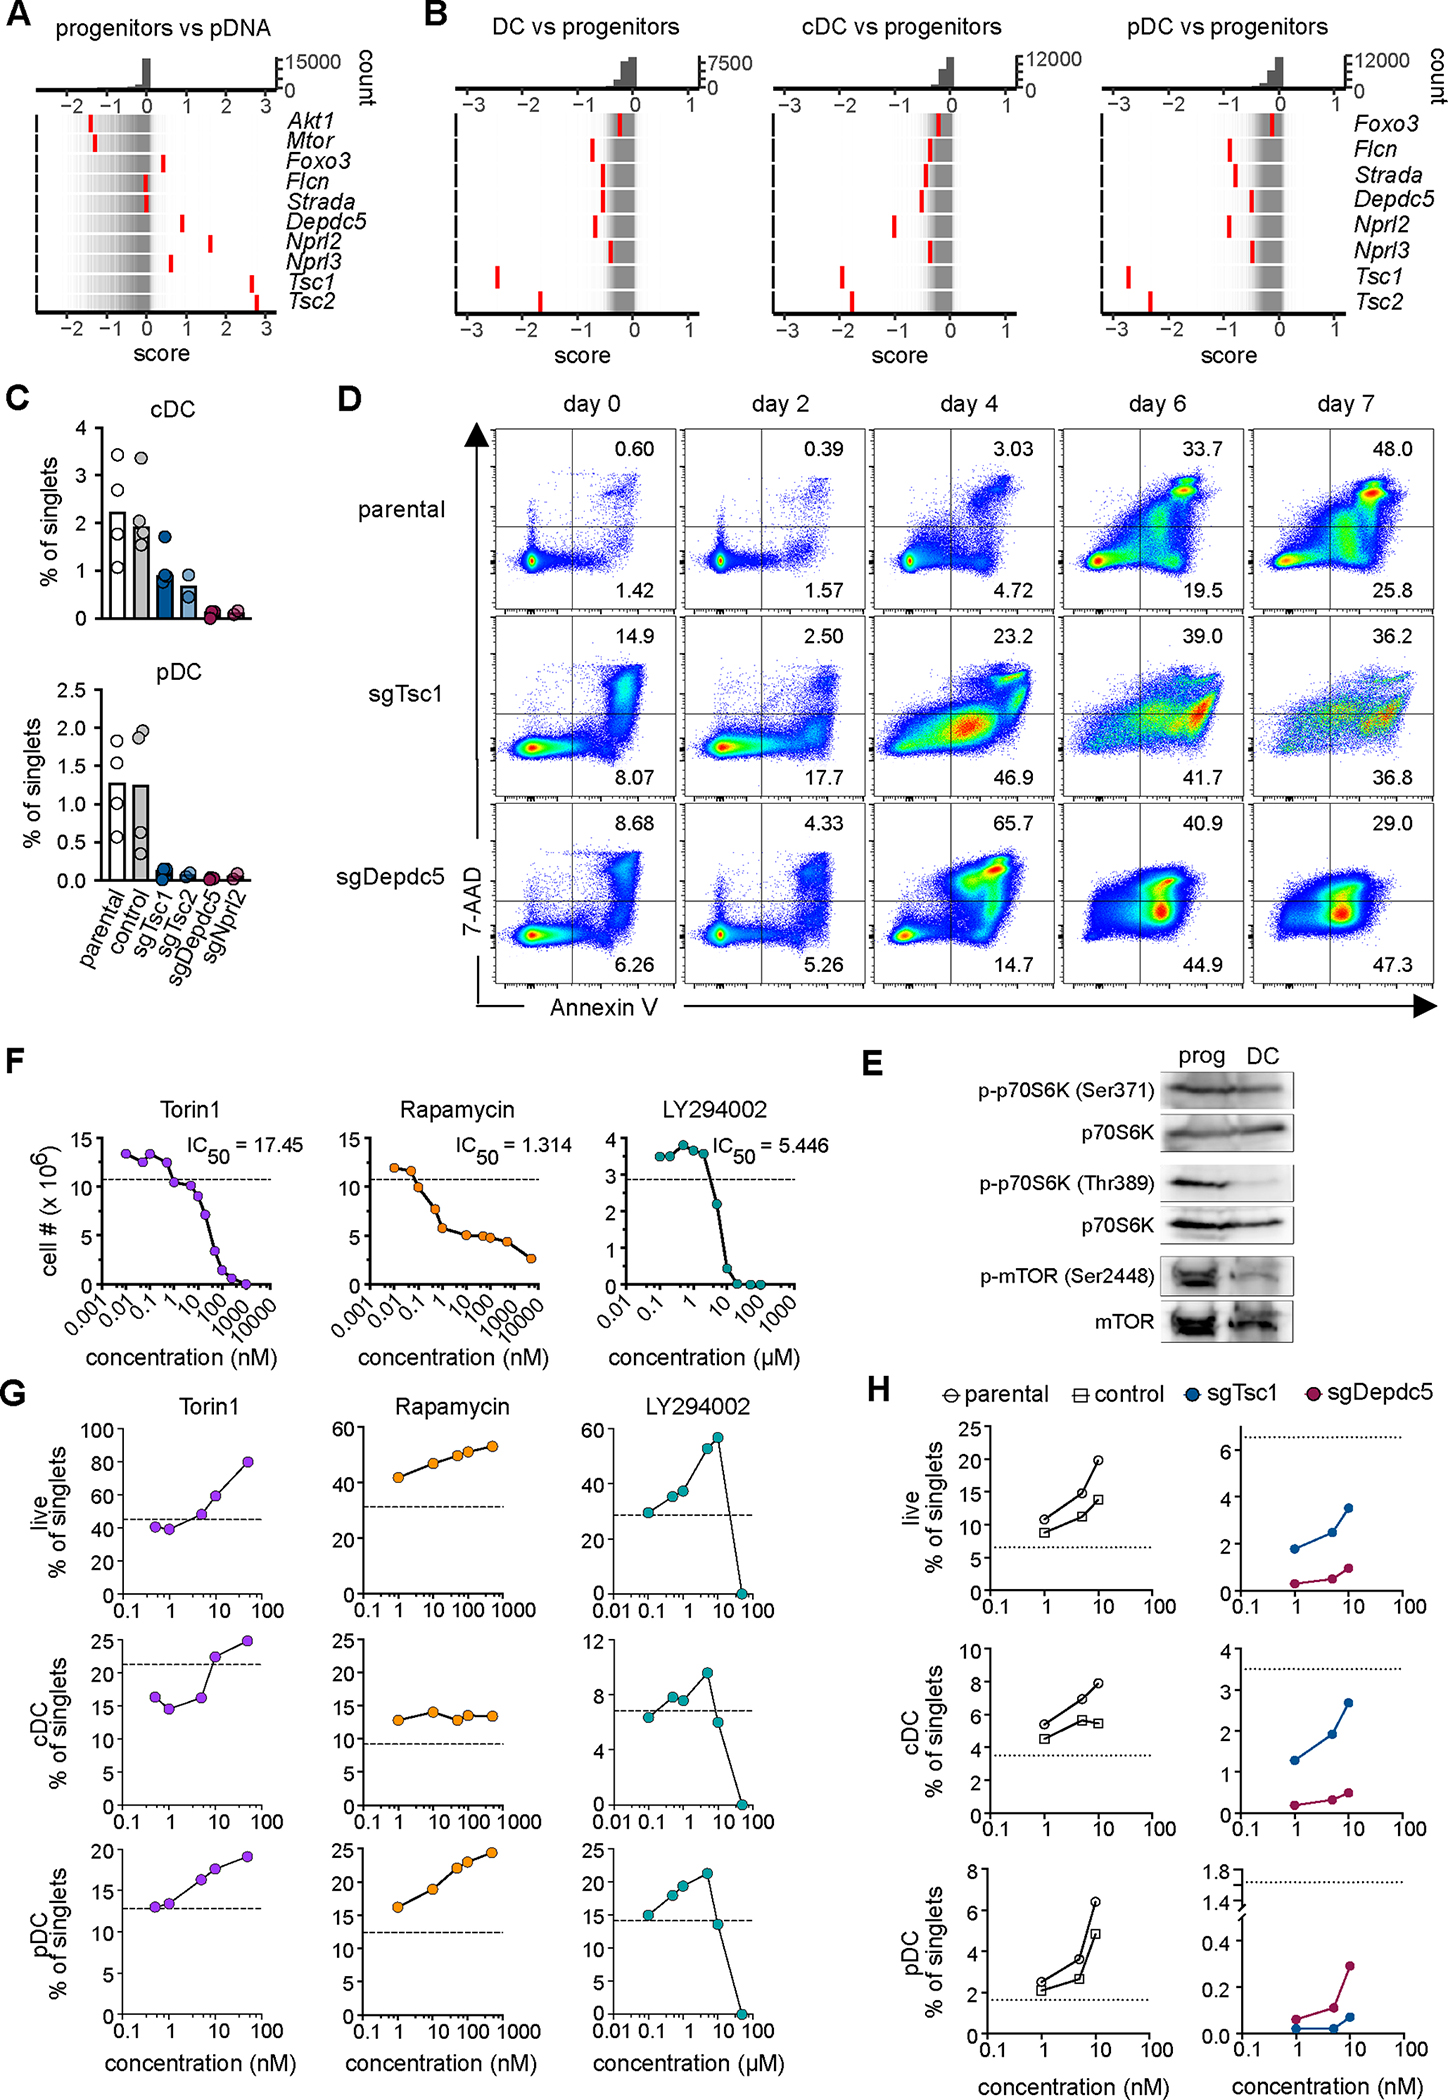
(A-B) Components of the mTOR signaling pathway identified in the genome-wide screen. Rug plots of gene distribution as measured by the CRISPTimeR score are presented as in Figure 1 for progenitors compared to pDNA (A) and DCs compared to progenitors (B).
(C) Differentiation of Hoxb8-FL cells transduced with control sgRNA or sgRNAs targeting TSC or GATOR1 subunits. Cells were analyzed as in Fig. S1A; shown are frequencies of DC subsets among single cells. Symbols represent separate experiments (n=2–4); bars represent the median.
(D) Apoptosis of differentiating Hoxb8-FL cells with targeted TSC or GATOR1 subunits as measured by staining with Annexin V and membrane permeability dye (7-AAD). Shown are plots gated on total single cells.
(E) Lysates of Hoxb8-FL cells grown as undifferentiated progenitors (prog.) or differentiated for 7 days were probed for p70S6K phosphorylated at Ser371 or Thr389 and for mTOR phosphorylated at Ser2448, along with total p70S6K and mTOR.
(F) The growth of undifferentiated Hoxb8-FL cells in the presence of mTOR inhibitors Torin1 or rapamycin, or of PI3K inhibitor LY294002. Shown are cell numbers on day 4 of growth; the 50% inhibitory concentration (IC50) and the cell number in an untreated culture (dashed line) are indicated. Representative of 2–4 experiments.
(G) The differentiation of Hoxb8-FL cells in the presence of mTOR inhibitors. The frequencies of viable cells, cDCs and pDCs among single cells were determined by flow cytometry on day 7. Dashed line indicates the values in untreated cultures. Representative of 2–4 experiments.
(H) Differentiation of Hoxb8-FL cells with targeted TSC or GATOR1 subunit in the presence of Torin1. Parental Hoxb8-FL cells or cells transduced with control or targeting sgRNAs were differentiated for 7 days and analyzed by flow cytometry. Shown are frequencies of live cells and DC subsets among single cells; dashed line indicates the values in untreated cultures.
Western blotting confirmed that the phosphorylation of p70S6 kinase (p70S6K), the substrate of mTOR signaling, as well as of mTOR itself was decreased in HoxB8-FL-derived DCs compared to progenitors (Fig. 3E). Consistent with high mTOR activity in progenitors, the mTOR pathway inhibitors Torin1 and rapamycin completely inhibited the growth of undifferentiated HoxB8-FL cells (Fig. 3F). In contrast, they did not inhibit and even increased the differentiation of HoxB8-FL cells into pDCs or cDCs in the same concentration range (Fig. 3G). The same was observed with the PI3K inhibitor LY294002, although it inhibited differentiation at higher concentrations. Treatment with Torin1 did not rescue the differentiation of TSC- or GATOR1-deficient cells, but improved their differentiation in a dose-dependent manner (Fig. 3H). Finally, we performed metabolic profiling of differentiating HoxB8-FL cells on days 0 (progenitors), 2, 4 and 7 (DCs) (Data file S4). PCA of the resulting metabolite levels showed the expected alignment of samples along their differentiation trajectory (Fig. S7A). Major metabolic pathways affected by differentiation included the tricarboxylic acid (TCA) cycle and amino acid metabolism, the key biosynthetic hubs activated by mTOR (Fig. S7B). TCA cycle intermediates such as citrate and oxoglutarate were profoundly reduced in DCs compared to progenitors (Fig. S7C). While multiple amino acids were upregulated in DCs, the key mTOR activator glutamine was reduced 2-fold (Fig. S7D). Another mTOR activator, arginine, was undetectable; however, its conversion product citrulline was strongly upregulated in DCs (Fig. S7D). Collectively, our results show that DC differentiation is accompanied by a shutdown of mTOR signaling; this shutdown is required for the process and is mediated by non-redundant activities of TSC and GATOR1 complexes.
Subhead 4: An orthogonal screen identifies Trim33 as a candidate regulator of DC differentiation
To focus on the transcriptional control of Flt3L-driven DC differentiation, we used an sgRNA library targeting ~1,700 TF at 10 sgRNA/gene (TF library, (27)). This TF library is based on a Cas9-expressing vector and could be transduced directly into the original HoxB8-FL cells, thus avoiding long-term Cas9 expression. The library was transduced at MOI<0.5, yielding an estimated coverage of ~500 primary transfectants per sgRNA (Fig. 4A). The transfectants were used in a similar two-stage screen for progenitor growth and then for DC differentiation (Fig. 4A), and samples were compared for the distribution of sgRNAs (Data file S5) and CRISPTimeR scores of individual genes (Data file S6). Similar to the genome-wide screen, the distribution of targeting sgRNA counts progressively broadened (Fig. S8A), and significant depletion and enrichment of targeting sgRNAs was observed both in the progenitor and in DC samples (Fig. S8B,C). The analysis of progenitors revealed low CRISPTimeR scores for the same transcription factors identified in the Brie library screen (Fig. 4B and 1B). The analysis of DC differentiation identified some hits from the Brie library screen (e.g. Hoxa9, Ikbkg) as well as Atf7ip, an essential cofactor of the Brie library hit Setdb1 (56) (Fig. 4C). It also identified additional known regulators of hematopoietic/lymphoid differentiation such as Rel (encoding the NF-κB subunit c-Rel) (57), Ikzf1 (encoding Ikaros) (58) and Zbtb1 (59) (Fig. 4C), yet missed some of the Brie library hits such as Irf2, Nfkb1 or Bcl11a. All hits showed low scores in both pDCs and cDCs (Fig. 4D), suggesting their general role in DC differentiation. Conversely, negative regulators of DC differentiation identified in the genome-wide screen (Crebbp, Tcf3, Bcor) were also identified in the TF screen (Fig. S8D).
Figure 4. An orthogonal screen for transcription factors identifies Trim33 as a regulator of DC differentiation.
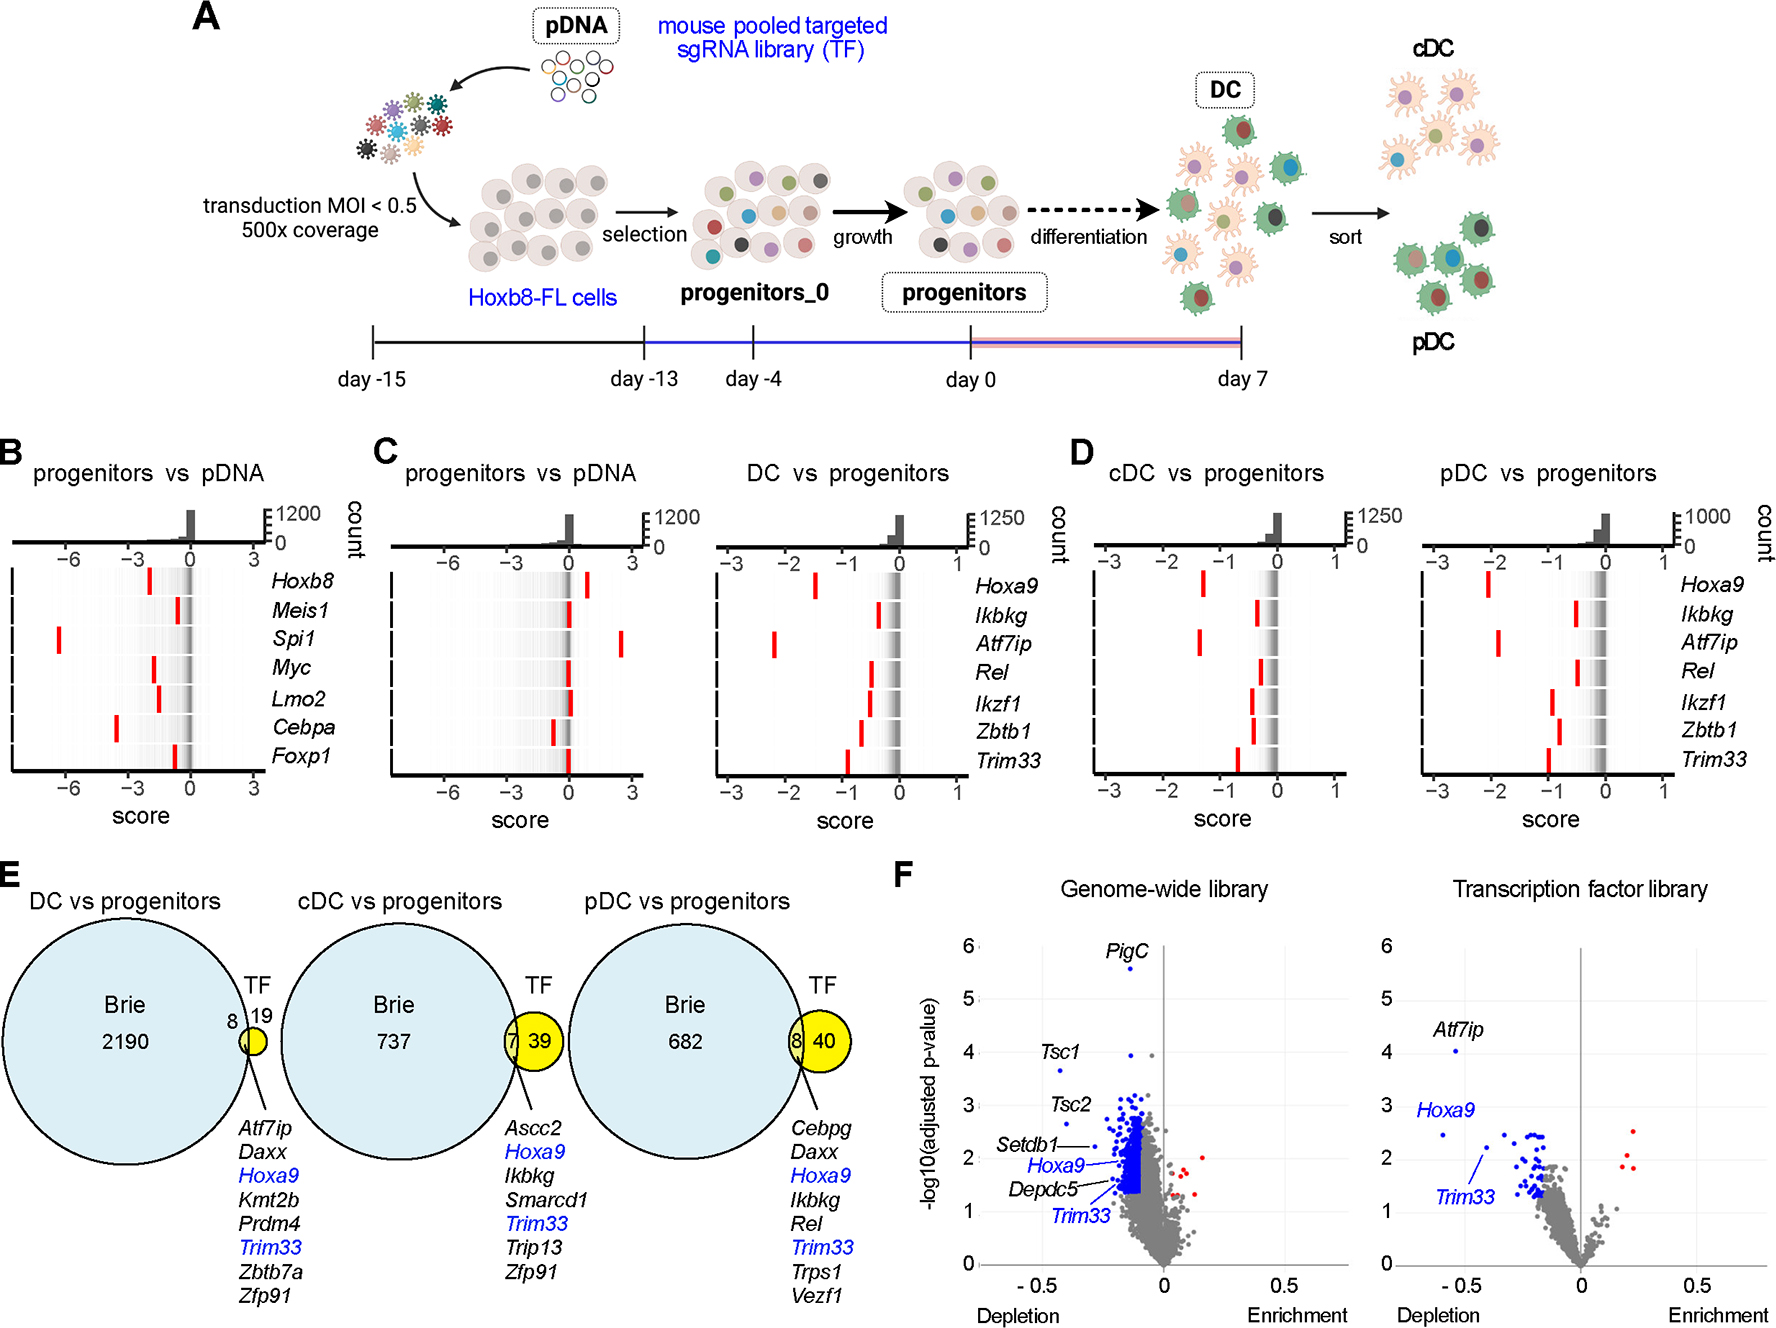
(A) Schematic of the screen, indicating the samples collected for sgRNA library analysis.
(B-D) Rug plots of gene distribution between indicated pairs of samples as measured by the CRISPTimeR score. Top panels show the distribution histogram of scores; bottom panels show individual genes (red bars) overlaid on the distribution of all genes (thin grey bars).
(B) CRISPTimeR score of select transcriptional regulators of progenitor growth in progenitors compared to pDNA.
(C-D) CRISPTimeR score of select transcriptional regulators of DC differentiation in total DCs (C) and in DC subsets (D) compared to progenitors.
(E) Venn diagrams of genes with significant depletion in the indicated samples from the genome-wide Brie (Fig. 1A) and transcription factor (TF, panel A) library screens. Genes identified in both screens are listed.
(F) Volcano plots of sgRNA differential representation vs probability in the total DC vs progenitor comparison in the two screens. Symbols represent individual genes; genes with significant sgRNA depletion or enrichment in DCs are highlighted in blue and red, respectively.
Conspicuously absent from the hits were two key regulators of pDC differentiation, Tcf4 (E2–2) and Irf8 (3, 16). Tcf4 encodes two transcriptional isoforms (long and short); both are expressed in pDCs, and the deletion of the long isoform alone in HoxB8-FL cells or in vivo causes only a partial reduction of pDC differentiation (20). All Tcf4-specific sgRNAs in both Brie and TF libraries targeted the first exon of the long isoform, preserving the short isoform and hence pDC differentiation. Next, we directly compared pDC vs cDC samples in the TF screen, and found Irf8 as the only significant gene with sgRNA depletion in pDCs (Fig. S8E). Notably, other depleted genes (albeit below statistical significance) included Tcf4, consistent with a partial but detectable effect of deleting the long isoform. They also included homologous E proteins Tcf3 and Tcf12, reflecting the important role of net E protein activity in pDC commitment (20). Collectively, the results suggest that both Brie and TF library screens could identify regulators of DC differentiation yet were prone to false negatives, a common feature of pooled CRISPR/Cas9 screens (60).
To reliably identify regulators of DC differentiation, we focused on the overlapping hits from both screens. Out of 27 high-confidence hits from the TF screen in the DC sample, 8 were also identified in the Brie screen (Fig. 4E and S8F), and only two of those (Hoxa9 and Trim33) were also identified in sorted pDC and cDC samples (Fig. 4E). In the TF library screen, Trim33 showed uniformly low scores in all DC samples (Fig. 4C,D) and was among the top TF screen hits by both probability and level of depletion (Fig. 4F). In the Brie screen, Trim33 showed relatively low (albeit significant) probability but high level of depletion (Fig. 4F). Trim33 encodes a tripartite motif family protein with a ubiquitin ligase domain and a PhD/bromodomain module mediating chromatin modification and target gene repression (61). Trim33 (also known as TIF1-γ) is expressed ubiquitously but selectively controls the differentiation of erythrocytes and normal and malignant B cells (62–64); conversely, it was reported as a negative regulator of myelopoiesis (65) while its role in DC differentiation has not been explored. Targeting by individual sgRNA confirmed that Trim33 is required for Flt3L-driven HoxB8-FL cell differentiation into pDCs and cDCs (Fig. S9A), but not for M-CSF-driven differentiation into macrophages (Fig. S9B). Thus, orthogonal screening followed by validation in HoxB8-FL cells identified Trim33 as a candidate regulator of Flt3L-driven DC differentiation.
Subhead 5: Trim33 is required for DC differentiation in vivo
Because germline deletion of Trim33 causes early embryonic lethality, we used a conditional null LoxP-flanked (“floxed”) Trim33 allele (Trim33fl, (66)) in conjunction with a ubiquitously expressed tamoxifen-inducible Cre recombinase (R26CreER). First, we cultured BM cells from naive Trim33fl/fl R26CreER/+ conditional knockout (CKO) mice or from control R26CreER/+ mice with Flt3L and 4-hydroxytamoxifen (4-OHT) to induce Cre recombination. CKO but not control cultures treated with 4-OHT from day 0 failed to generate any DCs (Fig. S9C,D). The addition of 4-OHT on day 3 of culture improved the output of CKO cultures (Fig. S9C,D), suggesting that Trim33 expression is critical at the early stages of progenitor differentiation. The few cells recovered from 4-OHT-treated CKO cultures largely retained the unrecombined Trim33fl allele (Fig. S9E), reflecting the failed differentiation of Trim33-deficient DCs.
Next, we administered tamoxifen (Tmx) three times to control or CKO mice to induce global deletion of Trim33 (Trim33Δ), and analyzed the induced mice 3–4 weeks later. We also established chimeras from naive CKO mice and treated them in parallel to induce Trim33 deletion in hematopoietic cells. Consistent with the data above, Flt3L cultures of BM from Trim33Δ mice or Trim33Δ chimeras yielded few live cells and virtually no DCs of any kind (Fig. 5A,B). As reported previously (62–64), CKO spleens showed extramedullary erythropoiesis and a profound loss of B cells (Fig. S10A–C). They also showed the expansion of granulocytes and of Ly-6Clow monocytes (Fig. S10D,E) along with the depletion of Ly-6Chi monocytes and all CD11c+ cells; in particular, pDCs and Ly-6C+ CD11clo tDCs (tDCLo) were significantly depleted (Fig. S10F,G). Skin-draining LN of Trim33Δ mice and chimeras showed a similar loss of B cells (Fig. S11A–C) yet no erythromyeloid expansion, facilitating the analysis of DCs. Trim33Δ LN showed a near-complete loss of migratory DCs (migDC1 or migDC2) and of resident cDC2s, a significant reduction of resident cDC1s, but a normal fraction of Langerhans cells (LC) migrating from the epidermis (Fig. 5C,D). They also showed a significant reduction of pDCs and tDCs, including the CD11clo and CD11chi tDC subsets (50) (Fig. S11D,E).
Figure 5. Deletion of Trim33 abolishes DC differentiation in vitro and in vivo.
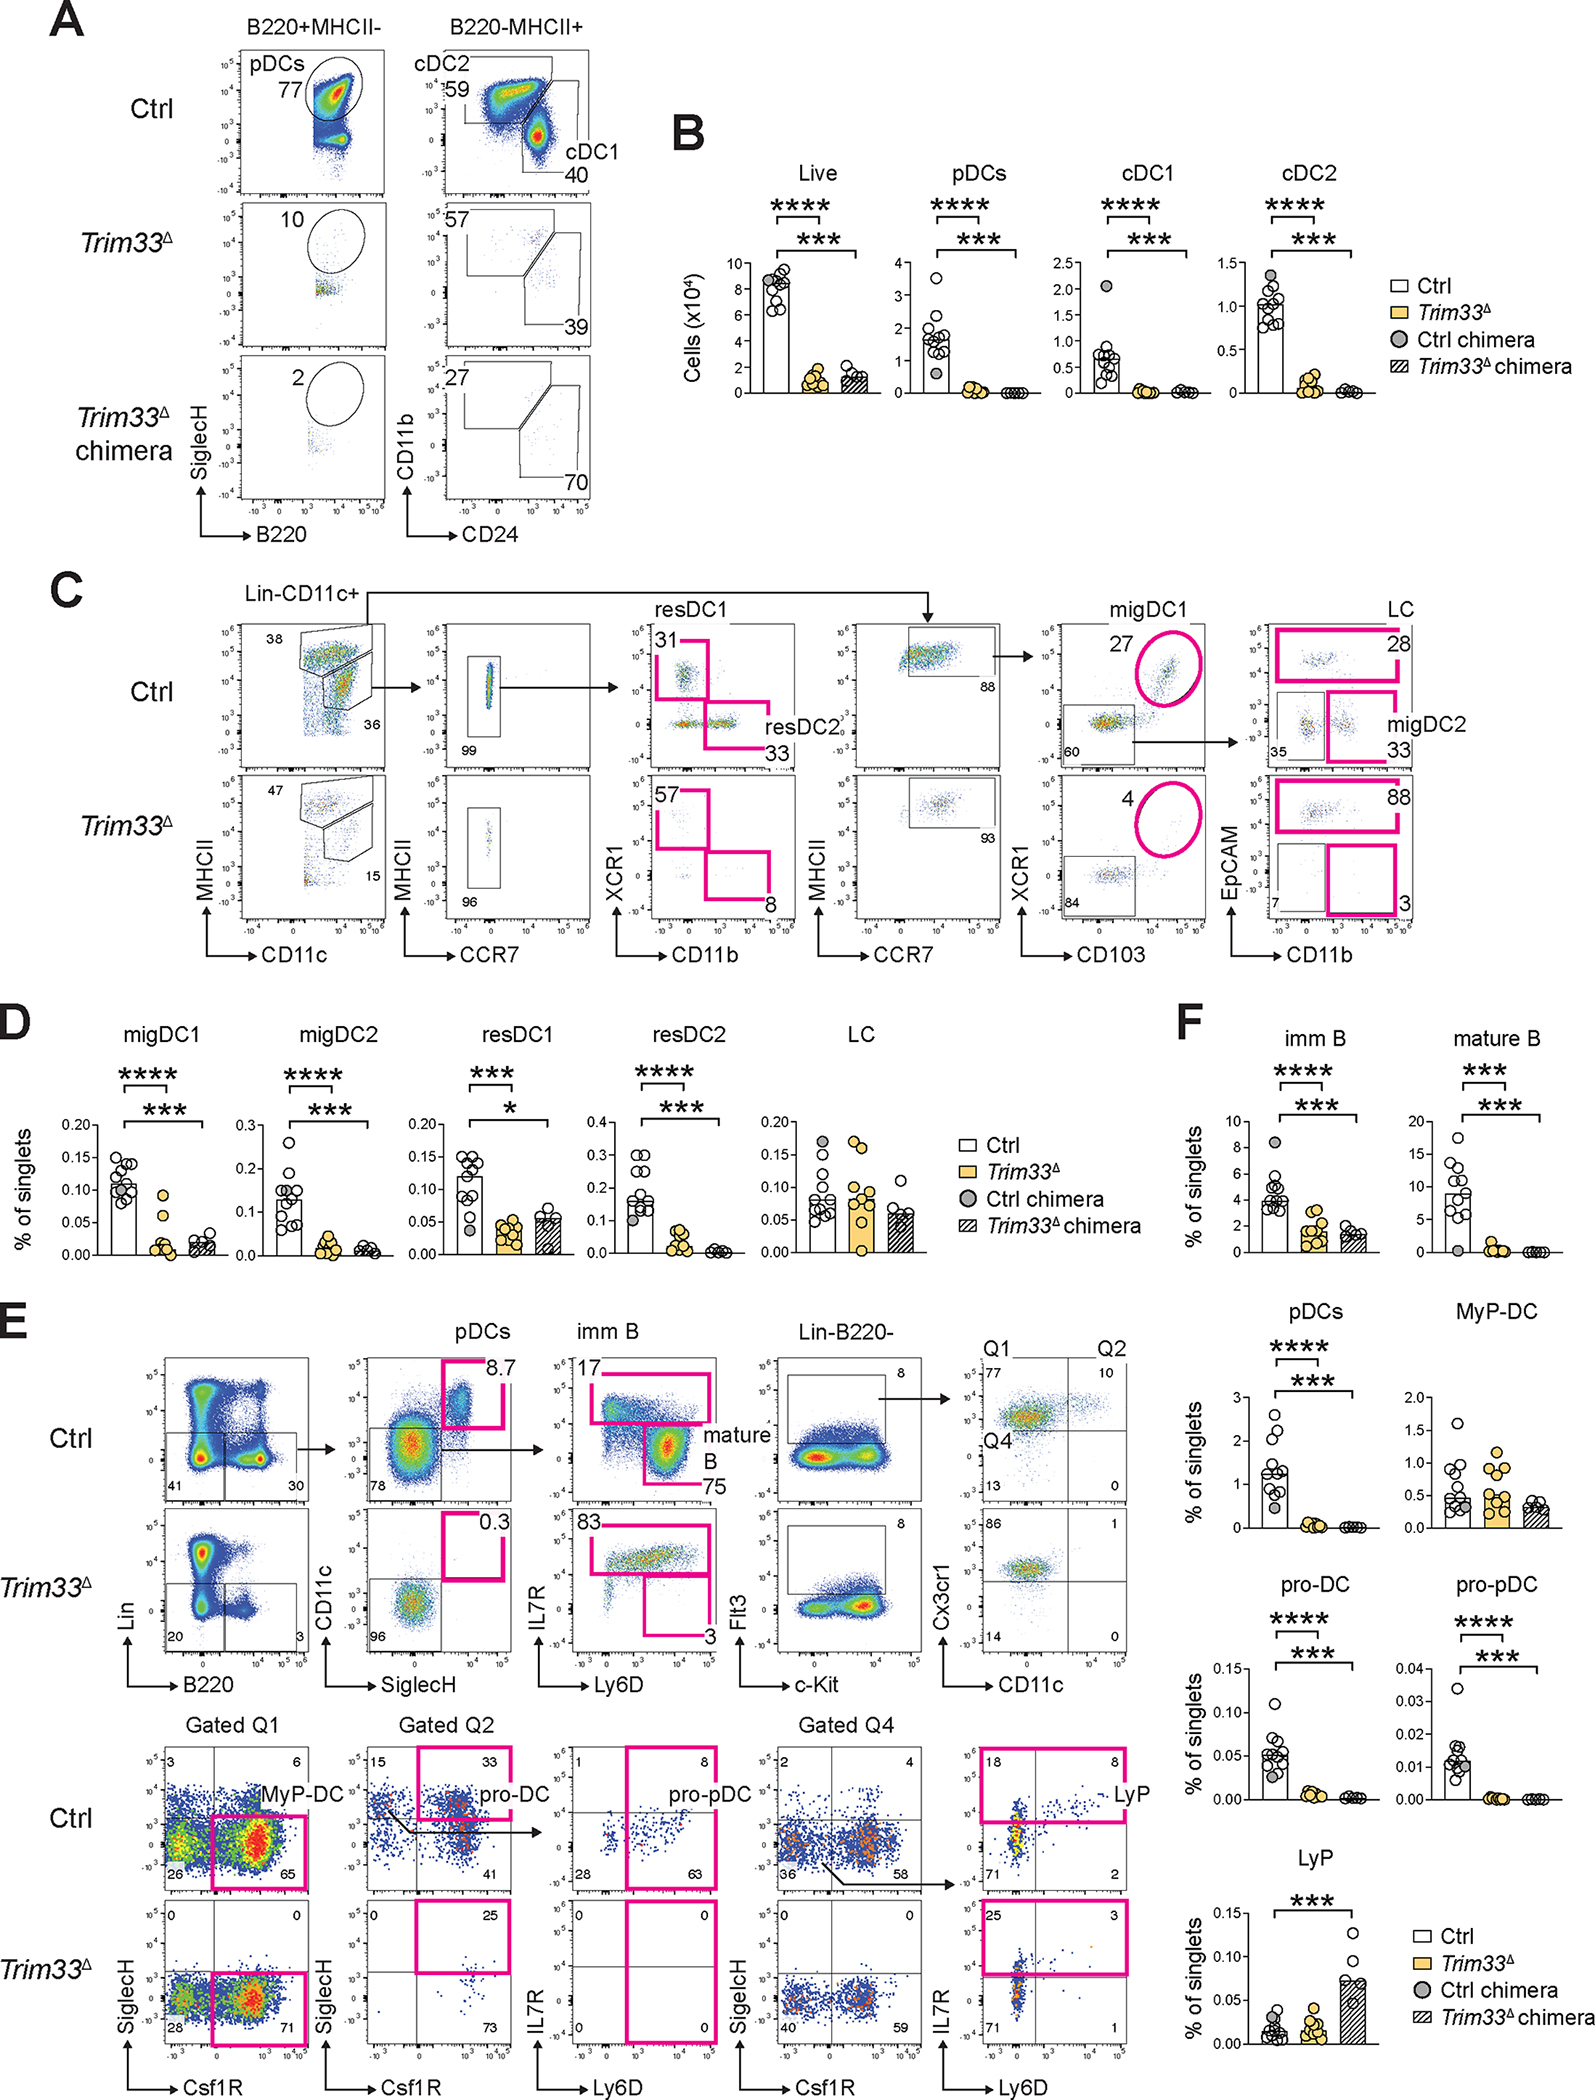
Trim33fl/fl R26CreER/+ conditional knockout mice or chimeras established from their BM were administered tamoxifen, and the resulting mice with global Trim33 deletion (Trim33Δ) or chimeras with pan-hematopoietic Trim33 deletion (Trim33Δ chimeras) were analyzed 3–4 weeks later. Control (Ctrl) R26CreER/+ mice and a reference chimera established from these mice (Ctrl chimera) were analyzed in parallel as a single control group.
(A-B) DC development in Flt3L-supplemented BM cultures. Shown are representative staining profiles of control, Trim33Δ or Trim33Δ chimera cultures on day 7 of differentiation (A) and numbers of the resulting DC subsets per 106 seeded BM cells (B).
(C-D) Primary DC populations in the skin-draining LN. Shown are representative staining profiles of control or Trim33Δ DCs (C) and fractions of DC subsets and other indicated cell types among total LN cells (D).
(E-F) Lymphoid and DC progenitors in the BM. Shown are representative staining profiles of control or Trim33Δ DC progenitors and immature cell types in the BM (E) and fractions of these cell types among total BM cells (F).
In all bar graphs, symbols represent cells from individual mice and bars represent median. Statistical significance was determined by Mann-Whitney test (*, P < 0.05; ***, P < 0.001; ****, P < 0.0001).
The BM of Trim33Δ mice and chimeras was moderately anemic yet normocellular (Fig. S12A,B) and contained a normal fraction of granulocytes, expanded fraction of Ly-6Clo monocytes and contracted B cell population (Fig. S12C,D). The latter reflected the ablation of mature IL-7R− Ly-6D+ B cells, while immature IL-7R+ Ly-6Dlo B cells were reduced only partially, and Flt3+ Cx3cr1− CSF1R− IL-7R+ lymphoid progenitors (LyP) were unaffected or increased (Fig. 5E,F). Conversely, all pDCs and all committed Flt3+ Cx3cr1+ CD11c+ DC progenitors including CSF1R+ SiglecH+ pro-DCs and CSF1R− SiglecH+ pro-pDCs (67) were lost, whereas the earliest Flt3+ Cx3cr1+ CD11c− CSF1R+ myeloid/DC progenitors (MyP-DCs) were retained (Fig. 5E,F). Similarly, the earliest committed progenitors of cDC1s (pre-DC1, (68)) were abolished by Trim33 deletion (Fig. S12E,F). Thus, inducible loss of Trim33 ablated mature B cell maintenance as described (64) yet spared early lymphopoiesis and granulopoiesis, and enhanced monocyte differentiation; in contrast, it abolished the development of all DCs and their progenitors.
To test early consequences of Trim33 deletion, we analyzed control or CKO mice one week after Tmx adiministration. Similar to the later timepoint, the resulting Trim33Δ BM failed to generate any DCs in Flt3L-supplemented BM cultures (Fig. 6A). Trim33Δ splenocytes showed a significant several-fold reduction of pDCs and a near-complete loss of cDC1s (Fig. 6B), both as a fraction of total cells and in absolute numbers (Fig. 6C). In contrast, Esam− cDC2s and B cells were modestly reduced, while Esam+ cDC2s and other myeloid cells were unaffected (Fig.6C). In the skin-draining LN of Trim33Δ mice, both resident and migratory cDC1s were significantly reduced; resident cDC2s were similarly reduced yet migratory cDC2s and LC were unaffected (Fig. 6D). The more pronounced loss of cDC1s compared to cDC2s suggested a stronger dependence of this subset on Trim33. The BM of Trim33Δ mice at this timepoint showed the same near-complete ablation of mature B cells, pDCs and DC progenitors (pro-DCs and pro-pDCs), a minor reduction of immature B cells and normal LyP (Fig. 6E,F). Thus, the loss of pDCs, cDC1s and their progenitors represents the most immediate consequence of Trim33 loss in adult mice.
Figure 6. The loss of DC differentiation is the earliest effect of Trim33 deletion.

Trim33fl/fl R26CreER/+ conditional knockout mice were administered tamoxifen, and the resulting mice with global deletion of Trim33 (Trim33Δ) were analyzed one week later along with control (Ctrl) R26CreER/+ mice.
(A) DC development in Flt3L-supplemented BM cultures. Shown are numbers of DC subsets per 106 seeded BM cells in control or Trim33Δ cultures on day 7.
(B-C) Primary DC populations in the spleen.
(B) Representative staining profiles of control or Trim33Δ splenic DCs.
(C) Fractions of DC subsets and other indicated cell types among total splenocytes (top row) and absolute numbers of DC subsets (bottom row).
(D) Primary DC populations in the skin-draining LN. Shown are fractions of DC subsets and other indicated cell types among total control or Trim33Δ LN cells.
(E-F) DC progenitors in the BM. Shown are representative staining profiles of control or Trim33Δ DC progenitors in the BM (E, see Fig. 5E for full gating scheme) and fractions of progenitors, pDCs and B cells among total BM cells (F).
In all bar graphs, symbols represent cells from individual mice and bars represent median. Statistical significance was determined by Mann-Whitney test (*, P < 0.05; **, P < 0.01).
Subhead 6: Trim33 controls DC differentiation and homeostasis in a cell-intrinsic manner
To test whether the observed essential role of Trim33 in DC differentiation is cell-intrinsic, we mixed CD45.2+ BM from control R26CreER/+ or Trim33fl/fl R26CreER/+ CKO mice 1:1 with the competitor CD45.1+ congenic BM and transferred them into irradiated CD45.1+ recipients. Three months after the transfer, mice were treated with Tmx and analyzed one week later. CD45.2+ donor-derived cells comprised >70% of DCs in Flt3L-supplemented BM cultures from control recipients, but were virtually absent from cultures from CKO recipients, which contained normal or expanded numbers of competitor-derived DCs (Fig. S13A). Accordingly, CKO donor-derived cells were nearly absent among pDCs and cDC1s, and were significantly reduced several-fold among cDC2s, myeloid cells and B cells (Fig. 7A,B). The same was observed in the LN, where CKO donor-derived cells were absent in resident and migratory cDC1s and significantly reduced several-fold among cDC2s, but not among LCs (Fig. 7C,D). Thus, cell-intrinsic Trim33 contributes to myelopoiesis and B cell development in competitive settings, but is absolutely required for pDC and cDC1 differentiation.
Figure 7. Trim33 is required for DC differentiation and homeostasis in a cell-intrinsic manner.
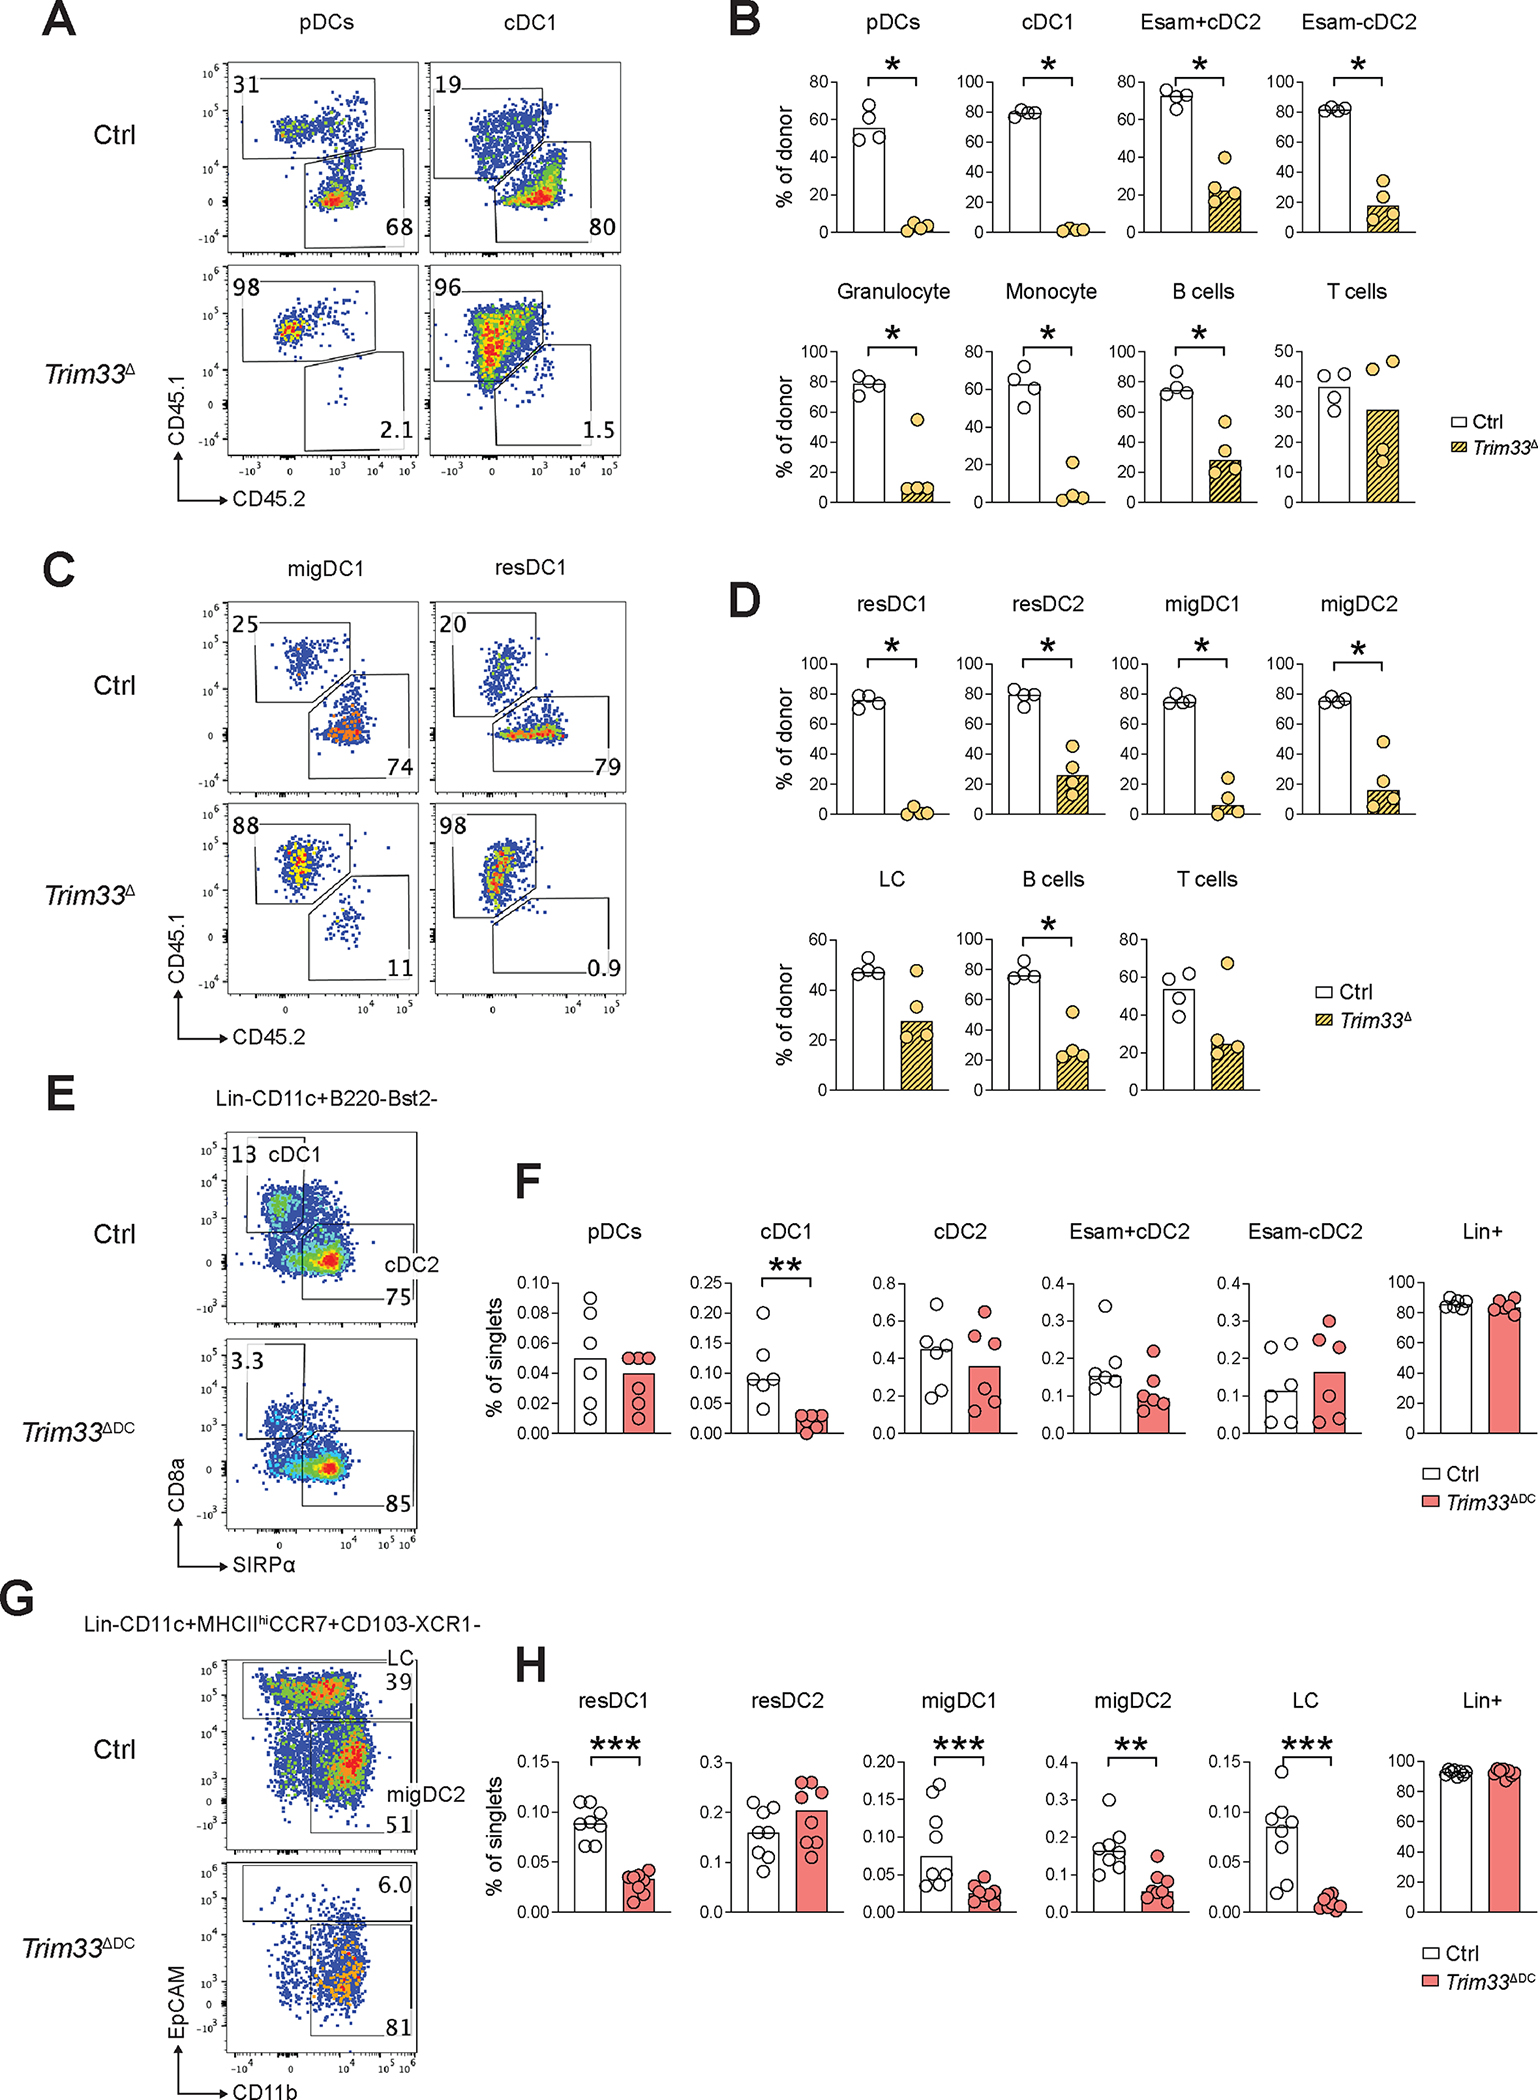
(A-D) Analysis of Trim33 deletion in mixed hematopoietic chimeras. BM from control R26CreER/+ or Trim33fl/fl R26CreER/+ conditional knockout mice was mixed with the competitor CD45.1 congenic BM and transferred into irradiated CD45.1 recipients. Three months later, mice were treated with tamoxifen to induce Trim33 deletion in donor cells (Trim33Δ) and analyzed one week later as described in Fig. 6.
(A-B) Donor contribution to DC populations in the spleen. Shown are representative staining profiles of donor-derived (CD45.2+) and competitor-derived (CD45.1+) cells among pDCs and cDC1s (A) and fractions of donor-derived cells within the indicated DC subsets and other indicated cell types (B).
(C-D) Donor contribution to DC populations in the skin-draining LN. Shown are representative staining profiles of donor-derived (CD45.2+) and competitor-derived (CD45.1+) cells among cDC1s (C) and fractions of donor-derived cells within the indicated DC subsets and other indicated cell types (D).
(E-H) Analysis of constitutive DC-specific Trim33 deletion in Trim33fl/fl Itgax-Cre conditional knockout mice (Trim33ΔDC) or Trim33fl/fl littermate controls (Ctrl). Cell populations were defined as shown in Fig. 5.
(E-F) Primary DC populations in the spleen. Shown are representative staining profiles of control or Trim33ΔDC splenic cDCs (E) and fractions of DC subsets and other indicated cell types among total splenocytes (F).
(G-H) Primary DC populations in the skin-draining LN. Shown are representative staining profiles of gated migratory DCs excluding cDC1s (CD11c+ MHCIIhi CCR7+ XCR1−) in control or Trim33ΔDC LN (G), and fractions of DC subsets and other indicated cell types among total LN cells (H).
In all bar graphs, symbols represent cells from individual mice and bars represent median. Statistical significance was determined by Mann-Whitney test (*, P < 0.05; **, P < 0.01; ***, P < 0.001).
We used the CD11c-Cre (Itgax-Cre) deleter strain to generate Trim33fl/fl Itgax-Cre mice with a constitutive DC-specific Trim33 deletion (Trim33ΔDC). Cre recombination in this strain occurs late during DC differentiation and is incomplete in pDCs but is efficient in mature cDCs and in CD11c+ tissue-resident cells such as LC and alveolar macrophages (AM) (69). Thus, unlike global inducible deletion, targeting with Itgax-Cre tests the maintenance of mature cDCs rather than initial DC specification. Accordingly, Flt3L-supplemented cultures of Trim33ΔDC mice produced near-normal numbers of pDCs and cDC2s, but significantly reduced numbers of cDC1-like cells (Fig. S13B). Spleens of Trim33ΔDC mice harbored normal fractions of pDCs and cDC2s, but significantly reduced cDC1s (Fig. 7E,F). Similarly, skin-draining LN contained a normal fraction of resident cDC2s but a 3-fold lower fraction of resident cDC1s, as well as significantly reduced migratory cDC1s and cDC2s (Fig. 7G,H). Finally, migratory LC were nearly absent from the LN (Fig. 7G,H), which reflected their absence from the epidermis (Fig. S13C). On the other hand, AM in the lung were present in normal numbers (Fig. S13D,E). The loss of LC after constitutive Trim33 deletion suggests its role in the embryonic specification and/or subsequent maintenance of these cells (70). In contrast, their normal presence after inducible Trim33 deletion (Fig. 5D and 6D) is consistent with the lack of BM progenitor input to LC (71). Collectively, these results reveal a requirement for Trim33 in the maintenance of mature DCs, particularly of cDC1s, LC and migratory DCs.
Subhead 7: Trim33 restricts aberrant gene expression programs during Flt3L-driven DC differentiation
To gain initial insights into the mechanism whereby Trim33 facilitates DC differentiation, we sought to characterize the transcriptome of Trim33-deficient DC progenitors. We sorted total Lin− Flt3+ progenitors from the BM of naive Trim33fl/fl R26CreER/+ CKO or control R26CreER/+ WT mice and differentiated them in vitro in the presence of Flt3L and 4-OHT. These conditions completely abolish DC development from total CKO BM (Fig. S9C,D), as confirmed for Lin− progenitors (Fig. S14A). To capture the earliest changes in the transcriptome of differentiating Trim33-deficient DC progenitors prior to their imminent demise, progenitor cultures were harvested after 3 days and analyzed by RNA-Seq. Consistent with the molecular function of Trim33 as a transcriptional repressor, CKO progenitors showed many upregulated genes and relatively few downregulated genes (n=666 and 144 at the 2-fold change threshold, respectively) (Fig. 8A and Data file S7). Importantly, upregulated genes included many direct targets of Trim33-mediated repression in macrophages, such as Flrt3, Atp1b3, Bcl2l11 and others (72, 73) (Fig. 8A,B). Atp1b3 and Bcl2l11 also represent two major targets of Trim33 binding and repression in B cell leukemia; the latter gene encodes a pro-apoptotic BCL2 family protein Bim, whose repression by Trim33 is essential for leukemia survival (64). Thus, Trim33 mediates its core transcriptional program in DC progenitors, including the repression of the pro-apoptotic factor Bim.
Figure 8. Trim33 prevents lineage-inappropriate gene expression during Flt3L-driven DC differentiation.
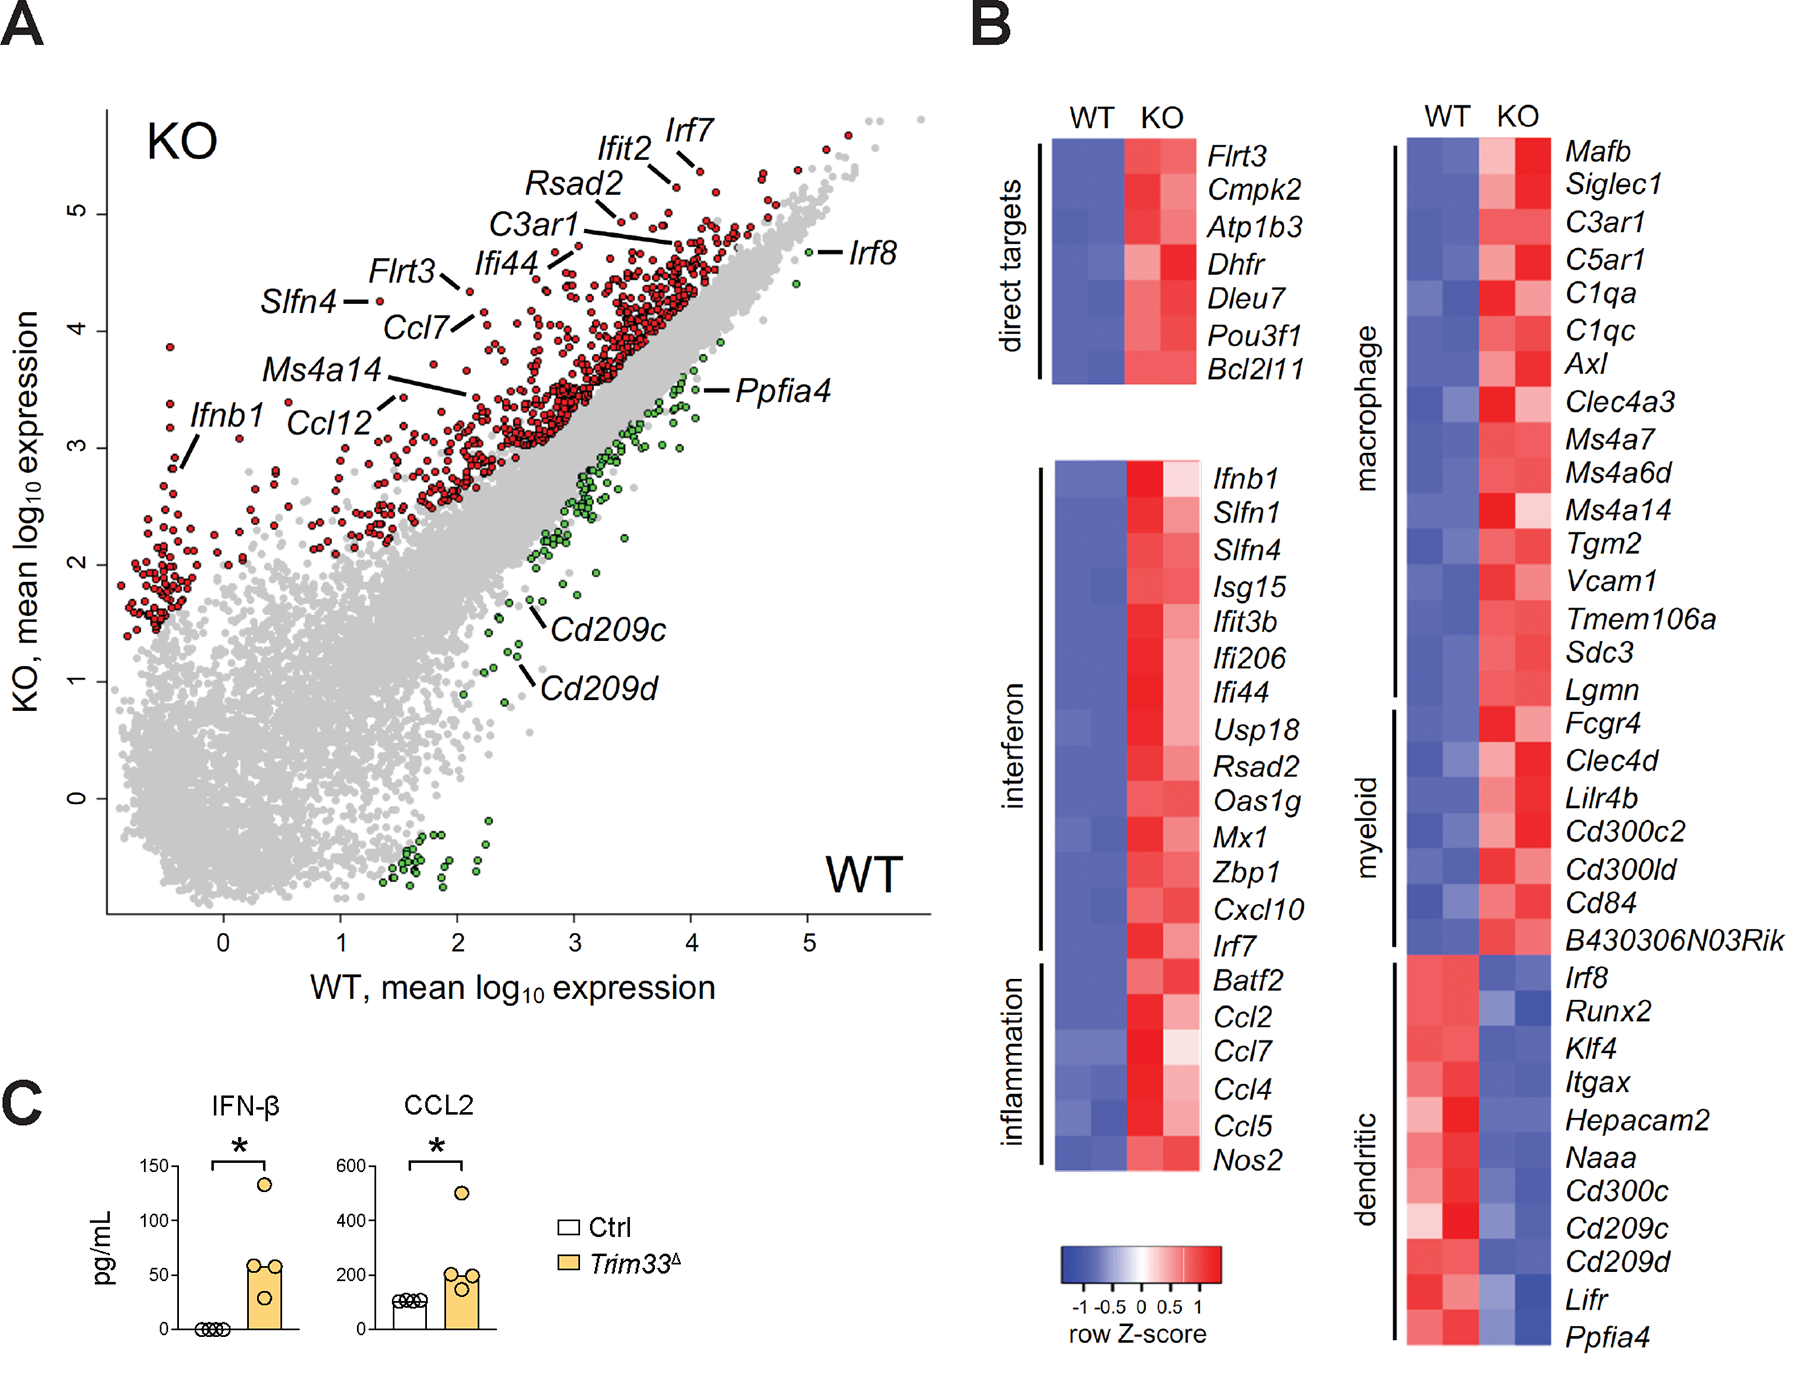
(A-B) Flt3+ BM progenitors from naive Trim33fl/fl R26CreER/+ conditional knockout (KO) mice or control R26CreER/+ wild-type (WT) mice were cultured with Flt3L and 4-OHT for 3 days and analyzed by RNA-Seq.
(A) Pairwise comparison of gene expression levels in WT vs KO samples (mean log10 of biological duplicates). Genes showing >2-fold overexpression with false discovery rate (FDR) <0.05 in WT or KO samples are highlighted in green or red, respectively; select gene names are indicated.
(B) Differential expression of select categories of genes in WT vs KO samples. Shown are heatmaps of relative expression levels in each sample for select genes representing direct targets of Trim33-mediated repression in macrophages; interferon-β and its target genes; inflammation-induced genes; and genes specific for macrophages, myeloid cells (macrophages and granulocytes), or DCs.
(C) The production of IFN-β and CCL2 by KO progenitors. Shown are concentrations of these proteins in culture supernatants of WT or KO progenitors cultured as above for 4 days. Symbols represent cultures from individual mice; bars represent median. Statistical significance was determined by Mann-Whitney test (*, P < 0.05).
Gene ontology analysis revealed a significant upregulation of pathways associated with virus infection (Fig. S14B), as evidenced by massive induction of canonical IFN-I-inducible genes (e.g. Slfn, Oas and Ifi gene families, Mx1, Isg15, Rsad2, Irf7, Cxcl10) in CKO progenitors (Fig. 8A,B). This was accompanied by the induction of Ifnb1 (Fig. 8A,B), itself a direct target of Trim33-mediated repression in macrophages (74, 75). Another induced gene set comprised inflammatory mediators such as Ccl genes (encoding CCL2, CCL7 and other CCL chemokines), Nos2 (encoding iNOS) and Batf2, encoding a TF that promotes the expression of these genes (76). The induction of IFN-β and CCL2 proteins was confirmed by ELISA in independent cultures of CKO progenitors (Fig. 8C). The blockade of IFN-I signaling failed to rescue the differentiation of CKO DCs (Fig. S14C), suggesting that additional (presumably cell-intrinsic) factors contribute to the phenotype. Notably, CKO progenitors showed upregulation of multiple genes associated with macrophage lineage, such as Siglec1 (encoding CD169), C1q genes and complement receptors, Ms4a family genes, Axl, Tgm2, Vcam1 and Mafb, encoding the TF that enforces macrophage over DC fate choice (77, 78) (Fig. 8B). The induction of pan-myeloid genes associated with monocyte/macrophage and granulocyte (but not DC) lineages, such as Fcgr4, Clec4d, Lilrb4 and Cd300c2, was also observed. Previous data on Trim33 binding to chromatin in macrophages (72, 73) show binding peaks at DC- and/or macrophage-specific enhancers of the Ccl gene cluster, Batf2 and Mafb, suggesting direct repression of these genes similar to Ifnb1 (Fig. S15). Conversely, initial upregulation of DC-specific genes was reduced in CKO progenitors, including Itgax (encoding CD11c), the cDC1-enriched Naaa and Hepacam2, and the pDC-enriched Cd300c, Cd209, Lifr and Ppfia4 (Fig. 8B). Importantly, this was accompanied by downregulation of genes encoding the critical cDC1/pDC-specifying TF Irf8, pDC-specific Runx2 and tDC/cDC2-enriched Klf4. Collectively, these results demonstrate a critical role of Trim33 in repressing aberrant gene expression programs such as IFN-I and inflammatory response and non-DC myeloid lineages, and facilitating the lineage-appropriate expression program during Flt3L-driven DC differentiation.
DISCUSSION
Studies over the last two decades elucidated the molecular control of DC subset specification and/or terminal differentiation in tissues. On the other hand, relatively little is known about the regulation of the entire Flt3L-driven pathway that gives rise to all DC subsets including pDCs and cDCs. One example of such common regulator is Spi1 (PU.1), which is required for the development of all DC subsets. However, it is also required in other myeloid cells and B lymphocytes, reflecting a broad upstream role in hematopoiesis via the activation of Flt3 expression (28). Conversely, the transcriptional corepressor Bcor negatively controls Flt3-driven DC development, but is required only during enforced Flt3L signaling but not in the steady state (37). The paucity of our understanding reflects the complexity of Flt3L/Flt3 signaling, which controls two seemingly opposite processes: the expansion of multipotent progenitors and the differentiation of DCs.
We interrogated Flt3L-driven DC differentiation separately from progenitor growth using the Flt3L-dependent progenitor cell line HoxB8-FL. This and similar continuous cell lines have been used for CRISPR/Cas9-mediated targeting of individual genes in DCs (19, 20, 79, 80), and their multipotency can in principle be used for genetic screening in vivo. Here we utilized HoxB8-FL for genome-scale dropout genetic screening in vitro, taking advantage of its switch from progenitor growth to DC differentiation by HoxB8 inactivation. Previously, HoxB8-FL cells revealed a specific role of bromodomain proteins in pDC differentiation, independently of their role in cell growth (20). HoxB8-FL cells differentiate into pDCs and cDCs that are herein shown to resemble their primary counterparts in their transcriptome and chromatin profile. HoxB8-FL-derived cDCs appear relatively immature and not fully resolved into cDC1 and/or cDC2; this is likely because they have not received the cytokine- and/or Notch2-mediated signals that guide terminal cDC differentiation (47, 81). However, the complexity and low cellular yield of cDC1-inducing conditions limit their use in genome-wide screening. Thus, unlike other methods such as SIS-Seq combined with CRISPR screening in FLT3L-supplemented BM cultures (37), our approach did not comprehensively interrogate DC subset specification. Accordingly, it missed specific regulators of cDC1s (e.g. Id2, Batf3, Mycl) and of cDC2 subsets or functional states (e.g. Ltbr, Klf4, Irf4) that were detected by SIS-Seq. However, in contrast to SIS-Seq, it does not pre-select target genes based on expression patterns, and thus interrogates the entire Flt3L-dependent DC differentiation pathway in an unbiased way.
Genome-wide screening of HoxB8-FL progenitor proliferation yielded the expected housekeeping genes and known regulators of hematopoietic progenitors including Spi1, consistent with its key upstream role in hematopoiesis. Conversely, the second stage of the genome-wide screen yielded multiple specific regulators of Flt3L-driven DC differentiation. These candidates regulate multiple cellular processes such as GPI anchor addition (the GPI transamidase complex subunits), cholesterol transport (the NPC complex subunits) or histone H3 lysine methylation (Setdb1), highlighting the complexity of DC differentiation process and providing a rich resource for its future studies. To illustrate the relevance of the screen’s results to DC differentiation, we selected Carm1, an unexpected hit given that it is generally dispensable for adult hematopoiesis (46). Our re-evaluation of Carm1-deficient hematopoietic cells revealed a reduction of pDCs and cDC2s, the two DC subsets interrogated in the screen, whereas cDC1s and myeloid cells in general were unaffected. CARM1 is a pleiotropic enzyme that methylates multiple substrates and can affect differentiation through co-activation of transcription and other mechanisms. Interestingly, CARM1 was shown to methylate MED12 in the Mediator transcriptional complex, and this activity requires JMJD6, another hit from the screen (82). Overall, this result provides an important validation of the screen by confirming the role of CARM1 in DC differentiation in vivo.
Notably, sgRNAs for several genes were enriched in progenitors and subsequently depleted in DCs, suggesting that these genes restrict proliferation but promote differentiation. Striking examples of this “switch” behavior were provided by subunits of the TSC and GATOR1 complexes, two key inhibitors of the mTOR signaling pathway. This was in contrast to PTEN, the inhibitor of the upstream PI3K pathway that restricted both the proliferation and the differentiation stages. These results suggest that TSC- and GATOR1-mediated inhibition of mTOR activity occurs at the onset of Flt3L-driven differentiation and is required for the survival of differentiating cells. Critically, these findings are consistent with the paradoxical role of TSC1 as a positive regulator of DC development in mice (55), in contrast to the negative regulation by PTEN (36). As such, they identify the TSC/GATOR1-dependent downregulation of mTOR signaling as a key molecular switch between Flt3L-controlled progenitor expansion and terminal differentiation. The molecular mechanism that induces TSC/GATOR1-dependent mTOR inhibition downstream of Flt3 is unknown at present. One candidate for this role is folliculin (encoded by Flcn), a context-dependent mTOR inhibitor (83) that was identified in our screen as a positive regulator of differentiation that appeared neutral for proliferation. Our data also suggest that the availability of key amino acids may contribute to the observed reduction of mTOR signaling. Whereas the role of these and other mechanisms remains to be elucidated, our results establish the switch in mTOR activity as a fundamental mechanism of Flt3-driven DC differentiation.
An orthogonal screen for transcription factors further refined the results of genome-wide screening, yielding additional regulators of Flt3L-driven DC differentiation such as Trim33. Subsequent inducible deletion of Trim33 in vivo abolished all major DC subsets (pDCs, tDCs, cDC1s and cDC2s) within 3–4 weeks, confirming Trim33 as an essential pan-DC regulator. Short-term deletion of Trim33 within one week caused a profound loss of pDCs and cDC1s, while largely sparing cDC2s. Moreover, constitutive targeting of Trim33 in mature DCs affected cDC1s but not cDC2s, emphasizing its preferential role in the maintenance of this subset. The strict dependence of pDCs and cDC1s on Trim33 is consistent with their equally strongest dependence on Flt3L signaling (36), and with the close developmental affiliation of the two subsets (67). Moreover, the simultaneous loss of all phenotypic committed DC progenitors including pro-DCs (67) is consistent with these cells giving rise to pDCs and cDC1s. The requirement for Trim33 was not strictly specific for DCs, as its loss also affected B cells and under competitive conditions, other cell types. However, B cell depletion primarily affected mature rather than developing B cells, and in non-competitive conditions was observed only after four weeks. In contrast, other Flt3+ progenitors (including lymphoid progenitors) as well as granulocytes and monocytes were unaffected or expanded, consistent with the repression of general myeloid differentiation by Trim33 (65, 72, 84). Thus, Trim33 has a pleiotropic role in hematopoiesis, but its requirement in DCs appears the most immediate, complete and affecting the earliest stages of differentiation.
In terms of the hierarchy of transcriptional regulation, Trim33 is likely to act downstream of PU.1, which is required not only in DCs and B cells, but also in all Flt3+ progenitors (85) and in monocytes. On the other hand, Trim33 may be upstream of IRF8, which is required in cDC1s but dispensable for pDC development due to compensation by IRF4 (86). The mechanism of the selective Trim33 activity in DCs appears to involve direct repression of pro-apoptotic regulators such as Bim, of the spontaneous IFN-I and inflammatory response, and of macrophage and general myeloid lineage programs. These mechanisms are likely to synergize: for example, Bim is known to promote DC apoptosis downstream of cytokine signals (87), and in particular downstream of IFN-I (88). Interestingly, the repression of IFN-I response and of Mafb was recently shown to underlie the activity of TF ETV3 and ETV6, which promote DC and repress macrophage differentiation (89). Conversely, both direct and indirect mechanisms may mediate the role of Trim33 in the induction of DC-specific TF including IRF8. Collectively, our approach identified important regulators of DC differentiation, which could not have been predicted on the basis of gene expression alone. Moreover, it established Trim33 as a key regulator of the entire DC lineage, highlighting the fundamental difference of Flt3L-driven DC development from that of other lineages.
MATERIALS AND METHODS
Study design.
The aim of the study was to elucidate molecular control of Flt3L-driven dendritic cell differentiation through unbiased genetic approaches. The study comprised three parts: i) in vitro CRISPR/Cas9-based droupout genetic screening of DC differentiation from HoxB8-FL cells; ii) in vitro validation of the inhibition of mTOR signaling as a requirement for HoxB8-FL differentiation; iii) in vivo validation of select screen hits by conditional gene targeting. All validation experiments were performed in biological replicates as indicated in the respective results. Animals were assigned to groups based on genotype, without randomisation or exclusion; the experimenters were not blinded to animal identity.
Mice.
All animal studies were performed according to the investigator’s protocol approved by the Institutional Animal Care and Use Committee of New York University School of Medicine. Both male and female mice were used in equal proportions. Mice with the deletion of Carm1 in hematopoietic cells have been generated by crossing the LoxP-flanked conditional allele of Carm1 (Carm1flox) with pan-hematopoietic Vav1-Cre transgenic deleter strain as described (46). The resulting Carm1fl/fl Vav1-Cre or littermate control Carm1fl/fl mice were used as BM donors for hematopoietic reconstitution. Total BM (2×10⁶ cells) were injected i.v. into lethally irradiated male 8-week CD45.1 congenic C57BL/6 mice. All resulting chimeras reached >80% donor chimerism. Two independent experiments were done, in which the chimeras were analyzed at 3–4.5 months (Fig. 2) or 8 months (Fig. S6) post-reconstitution.
Mice with the LoxP-flanked conditional allele of Trim33 (Trim33fl) (66) were crossed with mice carrying a ubiquitously expressed tamoxifen-inducible Cre recombinase-estrogen receptor (CreER) allele (Rosa26CreER) (90) to generate Trim33fl/fl Rosa26CreER/+ conditional knockout mice. Because CreER in the presence of tamoxifen may be toxic to cells, Rosa26CreER/+ mice with wild-type Trim33 allele were used as controls. To induce Cre recombination, mice or chimeras derived from them were treated with 5 mg of tamoxifen in sunflower oil by gavage daily for 3 consecutive days, and analyzed either 1 week or 3–4 weeks after the last treatment as indicated. Hematopoietic chimeras from naive Trim33fl/fl Rosa26CreER/+ mice were established as described above, and reached >90% donor chimerism. A single recipient of the BM from a control Rosa26CreER/+ mouse was established in parallel. The resulting chimeras at 7.5 months after reconstitution were treated with tamoxifen and analyzed after 3–4 weeks. Mixed chimeras from the BM of Trim33fl/fl Rosa26CreER/+ or control Rosa26CreER/+ mice were established as above. To establish mixed chimeras, donor BM from Trim33fl/fl Rosa26CreER/+ or control Rosa26CreER/+ mice was mixed 1:1 with the BM from CD45.1 congenic mice, and 2×10⁶ cells were used for reconstitution as above. The resulting chimeras at 3 months after reconstitution were treated with tamoxifen and analyzed after 1 week.
The Trim33fl mice were also crossed with mice carrying a constitutive dendritic cell-specific Cre recombinase allele (CD11c-Cre, (69)) to generate Trim33fl/fl CD11c-Cre conditional knockout mice. Because CD11c-Cre does not affect DC development or function, Cre-negative Trim33fl/fl littermates were used as controls. Genotyping for wild-type, conditional, and deleted Trim33 alleles was performed using a single three-primer PCR reaction.
Primary cell preparations.
Spleens were minced and digested with collagenase D (1 mg/ml) and DNase I (20 μg/ml) in full culture medium for 30–60 min at 37°C. BM was prepared by flushing femurs and tibias with PBS using a 27-gauge needle. The resulting suspensions, or intact lymph nodes, were pressed through a 70 μm nylon cell strainer and then subjected to red blood cell (RBC) lysis for 5 min at room temperature, followed by washing in PBS.
Flow cytometry.
Single-cell suspensions of cultured DCs (Flt3L-supplemented BM cultures) or primary cells (splenocytes, LN or BM) were prepared as described above and stained for multicolor analysis with the indicated fluorochrome- or biotin-conjugated antibodies. Lineage (Lin) cocktail included antibodies to TCRβ, CD3, CD19, NK1.1, and NKp46 (splenocytes); TCRβ, CD3, CD19, NK1.1, NKp46, and Ly6G (lymph nodes); or Ly6G and CD11b (BM). With the exception of Hoxb8-FL cells, staining of surface molecules with fluorescently labeled antibodies was performed for 20 min at 4°C in the dark. Hoxb8-FL cells were stained for 15 min at room temperature. For apoptosis assessment, Hoxb8-FL cells were stained using the FITC Annexin V Apoptosis Detection Kit with 7-AAD (BioLegend) according to the manufacturer’s instructions. Samples were acquired on Attune NxT (Invitrogen) using Attune NxT software and further analyzed with FlowJo software. Cell sorting was performed on the BD FACSAria II cell sorter (Becton Dickinson).
Cell culture and inhibitor treatments.
The FLT3L-secreting clone of the C57BL/6-derived B16 melanoma cell line (91) was used to produce FLT3L-containing supernatants and was cultured in DMEM supplemented with 10% FCS, 1% L-glutamine, 1% sodium pyruvate, 1% MEM-NEAA, and 1% penicillin/streptomycin. The murine progenitor Hoxb8-FL cell line was derived and cultured as described (17). In brief, the cells were grown in RPMI supplemented with 10% FCS, 10% supernatant from the Flt3L-producing B16 cell line, and 10 μM β-estradiol. The cells were induced to differentiate into DCs by washing and replating in RPMI supplemented with 10% charcoal-stripped FCS and 10% Flt3L supernatant. The resulting differentiated cells were collected by scraping on day 7 unless indicated otherwise. For chemical inhibition experiments, cells were cultured with indicated concentrations of Torin1 (Calbiochem), rapamycin (Calbiochem) or LY294002 (Cell Signaling Technology), all dissolved in DMSO. All inhibitors were added with fresh medium once at the start of treatment. The highest matching concentration of DMSO or medium alone were used as controls.
FLT3L-driven differentiation of primary BM cells.
To induce DC differentiation from BM cells, single-cell suspensions of total BM were plated in 24-well plates at a density of 2×10⁶ cells in 2 mL per well, cultured in full DMEM (10% FCS, 1% L-glutamine, 1% sodium pyruvate, 1% MEM-NEAA and 1% penicillin/streptomycin, 55 μM 2-mercaptoethanol) supplemented with 20% supernatant from the cultured B16-FLT3L cell line, and harvested 7 days later. To induce Cre recombination, 4-hydroxytamoxifen (4-OHT) was added on day 0 or day 3 to the final concentration of 500 nM.
To induce DC differentiation of Trim33-deficient progenitors, BM of naive Trim33fl/fl Rosa26CreER/+ or control Rosa26CreER/+ mice was enriched for Lin− cells by staining with biotinylated antibodies to B220, CD11b, TCRβ, Gr1, NK1.1, and Ter119, followed by staining with streptavidin-conjugated magnetic beads and negative selection on LD MACS cell separation columns. For RNA-Seq, the resulting cells were stained for Flt3 (CD135), Sca-1, c-Kit (CD117) and residual lineage markers, and Lin− Flt3+ cells were sorted, plated at 4×10⁴ cells/well into 96-well plates and cultured in full DMEM with Flt3L and 4-OHT for 3 days (for RNA-Seq). For the parallel phenotypic analysis, enriched Lin− cells were plated at 5×10⁵ cells/well into 24-well plates, cultured as described above for 7 days and stained for DC markers. Where indicated, anti-IFNAR1 antibody or an isotype control IgG were added at 20 μg/mL on days 0 and 3. For IFNβ/CCL2 ELISA, enriched Lin− cells were plated at 2×10⁵ cells/well into 96-well plates and cultured as described above for 4 days.
Generation of Hoxb8-Cas9 cell line.
To express Cas9 constitutively in Hoxb8-FL cells, we used lentiCas9-Blast vector that confers blasticidin resistance (92) (Addgene #52962). VSV-G pseudotyped lentiviral particles were produced using transient transfection in 293T cells. Undifferentiated Hoxb8-FL cells were spinoculated with the Cas9 vector and batch selected with blasticidin. The resulting population was cloned by limiting dilution and screened for the expression of Cas9 by Western blotting with anti-Cas9 antibody (Cell Signaling Technology). A clone with the highest expression of Cas9 and intact differentiation capacity was chosen for gene targeting.
Targeting of candidate genes in Hoxb8-FL cells.
Selected candidate genes identified in the screen were independently targeted using the CRISPR/Cas9 approach, using sgRNAs listed in Data file S8. SgRNAs targeting each gene (derived from the Brie or TF library) were cloned into the lentiGuide-Puro lentiviral vector (92) (Addgene #52963) that confers puromycin resistance. VSV-G pseudotyped lentiviral particles were produced using transient transfection in 293T cells. Undifferentiated Cas9-expressing Hoxb8-FL cells were spinoculated with each of the sgRNA-containing vectors and batch selected with puromycin for subsequent analysis.
Brie library lentivirus production and titration.
The mouse CRISPR knockout pooled library Brie (26) was purchased from Addgene (#73633) and amplified according to the depositor’s Library Amplification Protocol. The amplified library was sequenced according to depositor’s Sequencing Protocol to confirm the maintenance of representation. VSV-G pseudotyped lentiviral particles were produced using transient transfection in 293T cells and the lentiviral stock was concentrated using the Lenti-X™ Concentrator (Takara Bio) according to the manufacturer’s recommendations. Optimal transduction conditions for the screening were determined in order to achieve ~30% transduction efficiency, corresponding to a multiplicity of infection (MOI) of ~0.5. Briefly, undifferentiated Hoxb8-FL-Cas9 cells were plated in 6-well plates (5×10⁵ cells per well) and spinoculated with increasing volumes of the concentrated Brie lentivirus. The next day the cells were split 1:2 and replated, and 5 μg/mL puromycin was added to one well of each condition 24 h later. Wells with uninfected cells with or without puromycin served as controls. Cells were counted two days post selection to determine transduction efficiency by comparing survival with and without puromycin selection. The volume of virus that yielded ~ 30% transduction efficiency was used for the screening.
Brie library CRISPR screen.
Preliminary experiments established ~30% transduction efficiency of undifferentiated Hoxb8-FL-Cas9 cells with the Brie library, necessitating the transduction of 1.1×10⁸ cells to achieve a post-selection representation of ~400 cells per sgRNA. Hoxb8-FL-Cas9 cells were distributed to 6-well plates at 5×10⁵ cells per well, spinoculated with the pre-determined amount of virus, and 5 μg/mL puromycin was added 48 h later. Transduced cells were maintained in puromycin throughout the screen and were split every two days to prevent overconfluence. Samples of 5×10⁷ cells were obtained for sequencing 5 days (“progenitors_0”) and 11 days (“progenitors”) post selection. On day 11, 1.8×10⁸ cells were induced to differentiate into DCs, yielded ~8×10⁸ cells at ~80% viability on day 7. Of these, a bulk sample of 108 differentiated cells was harvested for sequencing (“DC”), and 4.5×10⁷ cells were sorted to obtain 4.6×10⁶ CD11c+ CD11b+ B220− cDCs and 3×10⁶ CD11c+ CD11b− B220+ pDCs.
gDNA was extracted using the QIAamp Blood Maxi/Midi kit (QIAGEN), and libraries were prepared and purified with AMPure XP-PCR Purification kit (Beckman) according to the depositor’s Sequencing Protocol (Addgene #73633). DNA was amplified in parallel PCR reactions (10 μg/reaction) as follows: for “progenitors_0” and “progenitors” samples, 170–190 μg DNA; for the “DC” sample, 380 μg; for sorted cDC and pDC samples, 7–9 μg. Paired-end sequencing for 50 cycles was performed using Illumina HiSeq4000 sequencer, and the results were analyzed as described in Supplemental Methods.
Transcription factor library CRISPR screen.
The lentiviral library was generated as previously described (27). In order to achieve a representation of ~500 cells per sgRNA in the library post-selection, 1.2×10⁸ undifferentiated Hoxb8-FL cells were distributed to 6-well plates with 5×10⁵ cells per well. Cells were spinoculated with the pre-determined amount of virus and 100 ng/mL zeocin was added 48 h later. Transduced cells were maintained in zeocin throughout the screen and were split every two days to prevent overconfluence. Samples of 1.5×10⁷ cells were obtained 9 days post selection (progenitors_0) and 13 days post selection on the day of differentiation induction (progenitors). A bulk sample of 5×10⁷ differentiated cells (DC) was obtained at the end of differentiation and prior to sorting. Hoxb8-FL-derived DCs were sorted as follows: CD11c+ CD11b+ B220− for cDCs (6.5×10⁶) and CD11c+ CD11b− B220+ for pDCs (7.3×10⁶). All sample cell pellets were stored at −80°C until genomic DNA (gDNA) isolation.
Cells were resuspended in 3 mL NK Lysis Buffer (50 mM Tris, 50 mM EDTA, 1% SDS, pH 8), and 100 μg/mL Proteinase K to every 15 ×106 cells (>500x coverage) and incubated at 55°C overnight. 50 μg/mL RNAse A was added to the lysed sample and then incubated at 37°C for 30 min. Samples were chilled on ice before the addition of 1 mL of pre-chilled 7.5 M ammonium acetate to precipitate proteins, DNA was extracted by isopropanol, washed, dried and resuspended in water. For “progenitors_0” and “progenitors” samples, 54 μg DNA corresponding to 500x coverage of the library were amplified in 5 parallel PCR1 reactions using 10.8 μg per reaction. For the “DC” sample, 24 PCR1 reactions were similarly setup for the amplification of ~250 μg of DNA corresponding to >1000x coverage of the library. For sorted cDC and pDC samples library coverage was lower (~ 240x) due to cell numbers. Two PCR1 reactions were setup for each sorted subset for the amplification of ~24–26 μg gDNA. PCR1 and subsequent PCR2 reactions for the addition of Illumina barcodes were performed as previously described (27). All samples were pooled in equimolar ratio and purified with QIAquick PCR Purification Kit (Qiagen). The purified sample was run on a 2% gel and the correct size band (250–270 bp) was extracted and purified with QIAquick Gel Extraction Kit (Qiagen). Libraries were sequenced on Illumina NextSeq Mid sequencer for 150 cycles single-end, and the results were analyzed as described in Supplemental Methods.
Western blot.
Cell pellets of Hoxb8-FL-derived DCs were lysed on ice for 30 min in RIPA lysis buffer (50 mM Tris-HCl pH 8.0, 150 mM NaCl, 1% Triton X-100, 0.1% SDS, and 0.5% sodium deoxycholate) supplemented with Halt™ Protease Inhibitor Cocktail (Thermo Scientific) and boiled for 10 min in the presence of 4x SDS sample loading buffer. For mTOR signaling pathway-related antibodies, cell pellets of Hoxb8-FL cells at different stages of differentiation were directly lysed in SDS sample loading buffer and boiled for 10 min. Lysates from equal cell numbers were analyzed by SDS-PAGE followed by western blotting with total protein (for phosphorylated proteins) or β-actin used as loading control.
Quantification and statistical analysis.
All numerical results are presented as median with individual values shown in graphs. Normal distribution of data was not assumed, and statistical significance of differences between experimental groups was determined by nonparametric Mann–Whitney test. All statistical calculations were performed using Prism (GraphPad). Statistical analysis of expression and chromatin profiling and of CRISPR screen results, was done in R (v3.1.1 or v3.5.3) as described in Supplemental Methods.
Supplementary Material
Data file S7. Differential gene expression in Trim33-deficient DC progenitors.
Data file S6. Differential representation of all genes between samples in the transcription factor screen.
Data file S1. Gene expression in HoxB8-FL-derived DCs and primary splenic DCs.
Data file S4. Metabolomic analysis of HoxB8-FL cell differentiation by mass spectrometry.
Data file S2. Individual targeting sgRNAs with differential representation between samples in the genome-wide screen.
Data file S8. Materials and reagents.
Data file S3. Differential representation of all genes between samples in the genome-wide screen.
Data file S5. Individual targeting sgRNAs with differential representation between samples in the transcription factor screen.
Supplementary Methods
Figure S1. Phenotypic differentiation of HoxB8-FL cells.
Figure S2. Transcriptome and chromatin profiles of DC subsets derived from HoxB8-FL cells.
Figure S3. The expression of core subset-specific genes in HoxB8-FL-derived DCs
Figure S4. Additional characterization of the genome-wide Brie library screen in Hoxb8-FL cells.
Figure S5. The role of Carm1 in the differentiation of HoxB8-FL cells.
Figure S6. DC differentiation from Carm1-deficient hematopoietic cells.
Figure S7. Characterization of mTOR signaling during DC differentiation of Hoxb8-FL cells.
Figure S8. Additional characterization of the transcription factor library screen in Hoxb8-FL cells.
Figure S9. Deletion of Trim33 abolishes DC differentiation in vitro.
Figure S10. Characterization of splenocytes after global long-term deletion of Trim33
Figure S11. Characterization of lymph node cells after global long-term deletion of Trim33
Figure S12. Characterization of bone marrow cells after global long-term deletion of Trim33
Figure S13. Cell-intrinsic deletion of Trim33 impairs DC differentiation.
Figure S14. Additional characterization of DC differentiation from Trim33-deficient Flt3+ progenitors
Figure S15. The binding of Trim33 to select target genes in macrophages
Acknowledgements:
We acknowledge the use of resources provided by NYU Metabolomics Laboratory, NYU Genome Technology Center (GTC), NYU Applied Bioinformatics Facility Laboratories (ABL) and the NYU High Performance Computing Facility (HPCF). GTC and ABL are Shared Resources partially supported by NIH grant P30CA016087 at the Laura and Isaac Perlmutter Cancer Center.
Funding:
Supported by the NIH grants AI072571 and AI154864 (B.R) and GM126421 (M.T.B.), the Dr. Bernard Levine postdoctoral fellowship program in immunology (I.T.), and the Damon Runyon postdoctoral fellowship DRG 2408–20 (N.M.A.).
Footnotes
Competing interests: B.R. is an advisor for Related Sciences and a co-founder of Danger Bio, which are not related to this work. Other authors declare no competing interests.
Data and materials availability:
RNA-Seq, ATAC-Seq and sgRNA-Seq datasets have been deposited in the Gene Expression Omnibus repository under accession no. GSE202585. Tabulated data underlying the figures and uncropped gel images are provided in Data files S9 and S10. All materials used in the manuscript are available from the above-referenced commercial sources or from co-authors following the initial request to the corresponding author (B.R.) and the completion of a material transfer agreement. All other data needed to support the conclusions of the paper are present in the paper or the Supplementary Materials.
References
- 1.Steinman RM, Decisions about dendritic cells: past, present, and future. Annu Rev Immunol 30, 1–22 (2012). [DOI] [PubMed] [Google Scholar]
- 2.Swiecki M, Colonna M, The multifaceted biology of plasmacytoid dendritic cells. Nat Rev Immunol 15, 471–485 (2015). [DOI] [PMC free article] [PubMed] [Google Scholar]
- 3.Reizis B, Plasmacytoid Dendritic Cells: Development, Regulation, and Function. Immunity 50, 37–50 (2019). [DOI] [PMC free article] [PubMed] [Google Scholar]
- 4.Guilliams M, Ginhoux F, Jakubzick C, Naik SH, Onai N, Schraml BU, Segura E, Tussiwand R, Yona S, Dendritic cells, monocytes and macrophages: a unified nomenclature based on ontogeny. Nat Rev Immunol 14, 571–578 (2014). [DOI] [PMC free article] [PubMed] [Google Scholar]
- 5.Merad M, Sathe P, Helft J, Miller J, Mortha A, The dendritic cell lineage: ontogeny and function of dendritic cells and their subsets in the steady state and the inflamed setting. Annu Rev Immunol 31, 563–604 (2013). [DOI] [PMC free article] [PubMed] [Google Scholar]
- 6.Mildner A, Jung S, Development and function of dendritic cell subsets. Immunity 40, 642–656 (2014). [DOI] [PubMed] [Google Scholar]
- 7.Naik SH, Proietto AI, Wilson NS, Dakic A, Schnorrer P, Fuchsberger M, Lahoud MH, O’Keeffe M, Shao QX, Chen WF, Villadangos JA, Shortman K, Wu L, Cutting edge: generation of splenic CD8+ and CD8- dendritic cell equivalents in Fms-like tyrosine kinase 3 ligand bone marrow cultures. J Immunol 174, 6592–6597 (2005). [DOI] [PubMed] [Google Scholar]
- 8.Naik SH, Sathe P, Park HY, Metcalf D, Proietto AI, Dakic A, Carotta S, O’Keeffe M, Bahlo M, Papenfuss A, Kwak JY, Wu L, Shortman K, Development of plasmacytoid and conventional dendritic cell subtypes from single precursor cells derived in vitro and in vivo. Nature immunology 8, 1217–1226 (2007). [DOI] [PubMed] [Google Scholar]
- 9.Onai N, Obata-Onai A, Schmid MA, Ohteki T, Jarrossay D, Manz MG, Identification of clonogenic common Flt3+M-CSFR+ plasmacytoid and conventional dendritic cell progenitors in mouse bone marrow. Nature immunology 8, 1207–1216 (2007). [DOI] [PubMed] [Google Scholar]
- 10.McKenna HJ, Stocking KL, Miller RE, Brasel K, De Smedt T, Maraskovsky E, Maliszewski CR, Lynch DH, Smith J, Pulendran B, Roux ER, Teepe M, Lyman SD, Peschon JJ, Mice lacking flt3 ligand have deficient hematopoiesis affecting hematopoietic progenitor cells, dendritic cells, and natural killer cells. Blood 95, 3489–3497 (2000). [PubMed] [Google Scholar]
- 11.Waskow C, Liu K, Darrasse-Jeze G, Guermonprez P, Ginhoux F, Merad M, Shengelia T, Yao K, Nussenzweig M, The receptor tyrosine kinase Flt3 is required for dendritic cell development in peripheral lymphoid tissues. Nature immunology 9, 676–683 (2008). [DOI] [PMC free article] [PubMed] [Google Scholar]
- 12.Maraskovsky E, Brasel K, Teepe M, Roux ER, Lyman SD, Shortman K, McKenna HJ, Dramatic increase in the numbers of functionally mature dendritic cells in Flt3 ligand-treated mice: multiple dendritic cell subpopulations identified. J Exp Med 184, 1953–1962 (1996). [DOI] [PMC free article] [PubMed] [Google Scholar]
- 13.Vollstedt S, O’Keeffe M, Odermatt B, Beat R, Glanzmann B, Riesen M, Shortman K, Suter M, Treatment of neonatal mice with Flt3 ligand leads to changes in dendritic cell subpopulations associated with enhanced IL-12 and IFN-alpha production. Eur J Immunol 34, 1849–1860 (2004). [DOI] [PubMed] [Google Scholar]
- 14.Lau CM, Nish SA, Yogev N, Waisman A, Reiner SL, Reizis B, Leukemia-associated activating mutation of Flt3 expands dendritic cells and alters T cell responses. J Exp Med 213, 415–431 (2016). [DOI] [PMC free article] [PubMed] [Google Scholar]
- 15.Nutt SL, Chopin M, Transcriptional Networks Driving Dendritic Cell Differentiation and Function. Immunity 52, 942–956 (2020). [DOI] [PubMed] [Google Scholar]
- 16.Murphy TL, Grajales-Reyes GE, Wu X, Tussiwand R, Briseno CG, Iwata A, Kretzer NM, Durai V, Murphy KM, Transcriptional Control of Dendritic Cell Development. Annu Rev Immunol 34, 93–119 (2016). [DOI] [PMC free article] [PubMed] [Google Scholar]
- 17.Redecke V, Wu R, Zhou J, Finkelstein D, Chaturvedi V, High AA, Hacker H, Hematopoietic progenitor cell lines with myeloid and lymphoid potential. Nat Methods 10, 795–803 (2013). [DOI] [PMC free article] [PubMed] [Google Scholar]
- 18.Kucinski I, Wilson NK, Hannah R, Kinston SJ, Cauchy P, Lenaerts A, Grosschedl R, Gottgens B, Interactions between lineage-associated transcription factors govern haematopoietic progenitor states. EMBO J 39, e104983 (2020). [DOI] [PMC free article] [PubMed] [Google Scholar]
- 19.Xu H, Look T, Prithiviraj S, Lennartz D, Caceres MD, Gotz K, Wanek P, Hacker H, Kramann R, Sere K, Zenke M, CRISPR/Cas9 editing in conditionally immortalized HoxB8 cells for studying gene regulation in mouse dendritic cells. Eur J Immunol 52, 1859–1862 (2022). [DOI] [PubMed] [Google Scholar]
- 20.Grajkowska LT, Ceribelli M, Lau CM, Warren ME, Tiniakou I, Nakandakari Higa S, Bunin A, Haecker H, Mirny LA, Staudt LM, Reizis B, Isoform-Specific Expression and Feedback Regulation of E Protein TCF4 Control Dendritic Cell Lineage Specification. Immunity 46, 65–77 (2017). [DOI] [PMC free article] [PubMed] [Google Scholar]
- 21.Bunin A, Sisirak V, Ghosh HS, Grajkowska LT, Hou ZE, Miron M, Yang C, Ceribelli M, Uetani N, Chaperot L, Plumas J, Hendriks W, Tremblay ML, Hacker H, Staudt LM, Green PH, Bhagat G, Reizis B, Protein Tyrosine Phosphatase PTPRS Is an Inhibitory Receptor on Human and Murine Plasmacytoid Dendritic Cells. Immunity 43, 277–288 (2015). [DOI] [PMC free article] [PubMed] [Google Scholar]
- 22.Kirkling ME, Cytlak U, Lau CM, Lewis KL, Resteu A, Khodadadi-Jamayran A, Siebel CW, Salmon H, Merad M, Tsirigos A, Collin M, Bigley V, Reizis B, Notch Signaling Facilitates In Vitro Generation of Cross-Presenting Classical Dendritic Cells. Cell reports 23, 3658–3672 e3656 (2018). [DOI] [PMC free article] [PubMed] [Google Scholar]
- 23.Heng TS, Painter MW, Immunological Genome Project C, The Immunological Genome Project: networks of gene expression in immune cells. Nat. Immunol. 9, 1091–1094 (2008). [DOI] [PubMed] [Google Scholar]
- 24.Yoshida H, Lareau CA, Ramirez RN, Rose SA, Maier B, Wroblewska A, Desland F, Chudnovskiy A, Mortha A, Dominguez C, Tellier J, Kim E, Dwyer D, Shinton S, Nabekura T, Qi Y, Yu B, Robinette M, Kim KW, Wagers A, Rhoads A, Nutt SL, Brown BD, Mostafavi S, Buenrostro JD, Benoist C, Immunological Genome P, The cis-Regulatory Atlas of the Mouse Immune System. Cell 176, 897–912 e820 (2019). [DOI] [PMC free article] [PubMed] [Google Scholar]
- 25.Lau CM, Tiniakou I, Perez OA, Kirkling ME, Yap GS, Hock H, Reizis B, Transcription factor Etv6 regulates functional differentiation of cross-presenting classical dendritic cells. J Exp Med 215, 2265–2278 (2018). [DOI] [PMC free article] [PubMed] [Google Scholar]
- 26.Doench JG, Fusi N, Sullender M, Hegde M, Vaimberg EW, Donovan KF, Smith I, Tothova Z, Wilen C, Orchard R, Virgin HW, Listgarten J, Root DE, Optimized sgRNA design to maximize activity and minimize off-target effects of CRISPR-Cas9. Nat Biotechnol 34, 184–191 (2016). [DOI] [PMC free article] [PubMed] [Google Scholar]
- 27.Garipler G, Lu C, Morrissey A, Lopez-Zepeda LS, Pei Y, Vidal SE, Zen Petisco Fiore AP, Aydin B, Stadtfeld M, Ohler U, Mahony S, Sanjana NE, Mazzoni EO, The BTB transcription factors ZBTB11 and ZFP131 maintain pluripotency by repressing pro-differentiation genes. Cell reports 38, 110524 (2022). [DOI] [PMC free article] [PubMed] [Google Scholar]
- 28.Carotta S, Dakic A, D’Amico A, Pang SH, Greig KT, Nutt SL, Wu L, The transcription factor PU.1 controls dendritic cell development and Flt3 cytokine receptor expression in a dose-dependent manner. Immunity 32, 628–641 (2010). [DOI] [PubMed] [Google Scholar]
- 29.Quong MW, Romanow WJ, Murre C, E protein function in lymphocyte development. Annu Rev Immunol 20, 301–322 (2002). [DOI] [PubMed] [Google Scholar]
- 30.Bleyl TM, Impact of the Transcription Factor HoxA9 on Toll-like Receptor-Mediated Innate Immune Responses and Development of Dendritic Cells and Macrophages (Thesis). Philipps-Universität Marburg, (2018). [Google Scholar]
- 31.Ichikawa E, Hida S, Omatsu Y, Shimoyama S, Takahara K, Miyagawa S, Inaba K, Taki S, Defective development of splenic and epidermal CD4+ dendritic cells in mice deficient for IFN regulatory factor-2. Proc Natl Acad Sci U S A 101, 3909–3914 (2004). [DOI] [PMC free article] [PubMed] [Google Scholar]
- 32.Honda K, Mizutani T, Taniguchi T, Negative regulation of IFN-alpha/beta signaling by IFN regulatory factor 2 for homeostatic development of dendritic cells. Proc Natl Acad Sci U S A 101, 2416–2421 (2004). [DOI] [PMC free article] [PubMed] [Google Scholar]
- 33.Ouaaz F, Arron J, Zheng Y, Choi Y, Beg AA, Dendritic cell development and survival require distinct NF-κB subunits. Immunity 16, 257–270 (2002). [DOI] [PubMed] [Google Scholar]
- 34.Wu X, Satpathy AT, Kc W, Liu P, Murphy TL, Murphy KM, Bcl11a controls Flt3 expression in early hematopoietic progenitors and is required for pDC development in vivo. PLoS One 8, e64800 (2013). [DOI] [PMC free article] [PubMed] [Google Scholar]
- 35.Ippolito GC, Dekker JD, Wang YH, Lee BK, Shaffer AL 3rd, Lin J, Wall JK, Lee BS, Staudt LM, Liu YJ, Iyer VR, Tucker HO, Dendritic cell fate is determined by BCL11A. Proc Natl Acad Sci U S A 111, E998–1006 (2014). [DOI] [PMC free article] [PubMed] [Google Scholar]
- 36.Sathaliyawala T, O’Gorman WE, Greter M, Bogunovic M, Konjufca V, Hou ZE, Nolan GP, Miller MJ, Merad M, Reizis B, Mammalian target of rapamycin controls dendritic cell development downstream of Flt3 ligand signaling. Immunity 33, 597–606 (2010). [DOI] [PMC free article] [PubMed] [Google Scholar]
- 37.Tian L, Tomei S, Schreuder J, Weber TS, Amann-Zalcenstein D, Lin DS, Tran J, Audiger C, Chu M, Jarratt A, Willson T, Hilton A, Pang ES, Patton T, Kelly M, Su S, Gouil Q, Diakumis P, Bahlo M, Sargeant T, Kats LM, Hodgkin PD, O’Keeffe M, Ng AP, Ritchie ME, Naik SH, Clonal multi-omics reveals Bcor as a negative regulator of emergency dendritic cell development. Immunity 54, 1338–1351 e1339 (2021). [DOI] [PubMed] [Google Scholar]
- 38.Yu S, Guo Z, Johnson C, Gu G, Wu Q, Recent progress in synthetic and biological studies of GPI anchors and GPI-anchored proteins. Current opinion in chemical biology 17, 1006–1013 (2013). [DOI] [PMC free article] [PubMed] [Google Scholar]
- 39.Pfeffer SR, NPC intracellular cholesterol transporter 1 (NPC1)-mediated cholesterol export from lysosomes. J Biol Chem 294, 1706–1709 (2019). [DOI] [PMC free article] [PubMed] [Google Scholar]
- 40.Bosch B, Berger AC, Khandelwal S, Heipertz EL, Scharf B, Santambrogio L, Roche PA, Disruption of multivesicular body vesicles does not affect major histocompatibility complex (MHC) class II-peptide complex formation and antigen presentation by dendritic cells. J Biol Chem 288, 24286–24292 (2013). [DOI] [PMC free article] [PubMed] [Google Scholar]
- 41.Koide S, Oshima M, Takubo K, Yamazaki S, Nitta E, Saraya A, Aoyama K, Kato Y, Miyagi S, Nakajima-Takagi Y, Chiba T, Matsui H, Arai F, Suzuki Y, Kimura H, Nakauchi H, Suda T, Shinkai Y, Iwama A, Setdb1 maintains hematopoietic stem and progenitor cells by restricting the ectopic activation of nonhematopoietic genes. Blood 128, 638–649 (2016). [DOI] [PubMed] [Google Scholar]
- 42.Kwok J, O’Shea M, Hume DA, Lengeling A, Jmjd6, a JmjC dioxygenase with many interaction partners and pleiotropic functions. Frontiers in genetics 8, 32 (2017). [DOI] [PMC free article] [PubMed] [Google Scholar]
- 43.Guccione E, Richard S, The regulation, functions and clinical relevance of arginine methylation. Nature reviews Molecular cell biology 20, 642–657 (2019). [DOI] [PubMed] [Google Scholar]
- 44.Lee J, Bedford MT, PABP1 identified as an arginine methyltransferase substrate using high-density protein arrays. EMBO Rep 3, 268–273 (2002). [DOI] [PMC free article] [PubMed] [Google Scholar]
- 45.Yadav N, Lee J, Kim J, Shen J, Hu MC, Aldaz CM, Bedford MT, Specific protein methylation defects and gene expression perturbations in coactivator-associated arginine methyltransferase 1-deficient mice. Proc Natl Acad Sci U S A 100, 6464–6468 (2003). [DOI] [PMC free article] [PubMed] [Google Scholar]
- 46.Greenblatt SM, Man N, Hamard PJ, Asai T, Karl D, Martinez C, Bilbao D, Stathias V, Jermakowicz AM, Duffort S, Tadi M, Blumenthal E, Newman S, Vu L, Xu Y, Liu F, Schurer SC, McCabe MT, Kruger RG, Xu M, Yang FC, Tenen DG, Watts J, Vega F, Nimer SD, CARM1 Is Essential for Myeloid Leukemogenesis but Dispensable for Normal Hematopoiesis. Cancer Cell 33, 1111–1127 e1115 (2018). [DOI] [PMC free article] [PubMed] [Google Scholar]
- 47.Lewis KL, Caton ML, Bogunovic M, Greter M, Grajkowska LT, Ng D, Klinakis A, Charo IF, Jung S, Gommerman JL, Ivanov II, Liu K, Merad M, Reizis B, Notch2 receptor signaling controls functional differentiation of dendritic cells in the spleen and intestine. Immunity 35, 780–791 (2011). [DOI] [PMC free article] [PubMed] [Google Scholar]
- 48.Bar-On L, Birnberg T, Lewis KL, Edelson BT, Bruder D, Hildner K, Buer J, Murphy KM, Reizis B, Jung S, CX3CR1+ CD8alpha+ dendritic cells are a steady-state population related to plasmacytoid dendritic cells. Proc Natl Acad Sci U S A 107, 14745–14750 (2010). [DOI] [PMC free article] [PubMed] [Google Scholar]
- 49.Leylek R, Alcantara-Hernandez M, Lanzar Z, Ludtke A, Perez OA, Reizis B, Idoyaga J, Integrated Cross-Species Analysis Identifies a Conserved Transitional Dendritic Cell Population. Cell reports 29, 3736–3750 e3738 (2019). [DOI] [PMC free article] [PubMed] [Google Scholar]
- 50.Sulczewski FB, Maqueda-Alfaro RA, Alcantara-Hernandez M, Perez OA, Saravanan S, Yun TJ, Seong D, Arroyo Hornero R, Raquer-McKay HM, Esteva E, Lanzar ZR, Leylek RA, Adams NM, Das A, Rahman AH, Gottfried-Blackmore A, Reizis B, Idoyaga J, Transitional dendritic cells are distinct from conventional DC2 precursors and mediate proinflammatory antiviral responses. Nature immunology 24, 1265–1280 (2023). [DOI] [PMC free article] [PubMed] [Google Scholar]
- 51.Rodrigues PF, Kouklas A, Cvijetic G, Bouladoux N, Mitrovic M, Desai JV, Lima-Junior DS, Lionakis MS, Belkaid Y, Ivanek R, Tussiwand R, pDC-like cells are pre-DC2 and require KLF4 to control homeostatic CD4 T cells. Sci Immunol 8, eadd4132 (2023). [DOI] [PMC free article] [PubMed] [Google Scholar]
- 52.Kim J, Guan K-L, mTOR as a central hub of nutrient signalling and cell growth. Nature cell biology 21, 63–71 (2019). [DOI] [PubMed] [Google Scholar]
- 53.Liu GY, Sabatini DM, mTOR at the nexus of nutrition, growth, ageing and disease. Nature reviews Molecular cell biology 21, 183–203 (2020). [DOI] [PMC free article] [PubMed] [Google Scholar]
- 54.Pan H, O’Brien TF, Wright G, Yang J, Shin J, Wright KL, Zhong XP, Critical role of the tumor suppressor tuberous sclerosis complex 1 in dendritic cell activation of CD4 T cells by promoting MHC class II expression via IRF4 and CIITA. J Immunol 191, 699–707 (2013). [DOI] [PMC free article] [PubMed] [Google Scholar]
- 55.Wang Y, Huang G, Zeng H, Yang K, Lamb RF, Chi H, Tuberous sclerosis 1 (Tsc1)-dependent metabolic checkpoint controls development of dendritic cells. Proc Natl Acad Sci U S A 110, E4894–4903 (2013). [DOI] [PMC free article] [PubMed] [Google Scholar]
- 56.Timms RT, Tchasovnikarova IA, Antrobus R, Dougan G, Lehner PJ, ATF7IP-Mediated Stabilization of the Histone Methyltransferase SETDB1 Is Essential for Heterochromatin Formation by the HUSH Complex. Cell reports 17, 653–659 (2016). [DOI] [PMC free article] [PubMed] [Google Scholar]
- 57.Gilmore TD, Gerondakis S, The c-Rel transcription factor in development and disease. Genes & cancer 2, 695–711 (2011). [DOI] [PMC free article] [PubMed] [Google Scholar]
- 58.Georgopoulos K, Haematopoietic cell-fate decisions, chromatin regulation and ikaros. Nature Reviews Immunology 2, 162–174 (2002). [DOI] [PubMed] [Google Scholar]
- 59.Siggs OM, Li X, Xia Y, Beutler B, ZBTB1 is a determinant of lymphoid development. J Exp Med 209, 19–27 (2012). [DOI] [PMC free article] [PubMed] [Google Scholar]
- 60.Dede M, Hart T, Recovering false negatives in CRISPR fitness screens with JLOE. Nucleic Acids Res 51, 1637–1651 (2023). [DOI] [PMC free article] [PubMed] [Google Scholar]
- 61.Herquel B, Ouararhni K, Davidson I, The TIF1alpha-related TRIM cofactors couple chromatin modifications to transcriptional regulation, signaling and tumor suppression. Transcription 2, 231–236 (2011). [DOI] [PMC free article] [PubMed] [Google Scholar]
- 62.Kusy S, Gault N, Ferri F, Lewandowski D, Barroca V, Jaracz-Ros A, Losson R, Romeo PH, Adult hematopoiesis is regulated by TIF1gamma, a repressor of TAL1 and PU.1 transcriptional activity. Cell stem cell 8, 412–425 (2011). [DOI] [PubMed] [Google Scholar]
- 63.Bai X, Trowbridge JJ, Riley E, Lee JA, DiBiase A, Kaartinen VM, Orkin SH, Zon LI, TiF1-gamma plays an essential role in murine hematopoiesis and regulates transcriptional elongation of erythroid genes. Dev Biol 373, 422–430 (2013). [DOI] [PMC free article] [PubMed] [Google Scholar]
- 64.Wang E, Kawaoka S, Roe JS, Shi J, Hohmann AF, Xu Y, Bhagwat AS, Suzuki Y, Kinney JB, Vakoc CR, The transcriptional cofactor TRIM33 prevents apoptosis in B lymphoblastic leukemia by deactivating a single enhancer. eLife 4, e06377 (2015). [DOI] [PMC free article] [PubMed] [Google Scholar]
- 65.Aucagne R, Droin N, Paggetti J, Lagrange B, Largeot A, Hammann A, Bataille A, Martin L, Yan KP, Fenaux P, Losson R, Solary E, Bastie JN, Delva L, Transcription intermediary factor 1gamma is a tumor suppressor in mouse and human chronic myelomonocytic leukemia. J Clin Invest 121, 2361–2370 (2011). [DOI] [PMC free article] [PubMed] [Google Scholar]
- 66.Kim J, Kaartinen V, Generation of mice with a conditional allele for Trim33. Genesis 46, 329–333 (2008). [DOI] [PMC free article] [PubMed] [Google Scholar]
- 67.Feng J, Pucella JN, Jang G, Alcantara-Hernandez M, Upadhaya S, Adams NM, Khodadadi-Jamayran A, Lau CM, Stoeckius M, Hao S, Smibert P, Tsirigos A, Idoyaga J, Reizis B, Clonal lineage tracing reveals shared origin of conventional and plasmacytoid dendritic cells. Immunity 55, 405–422 e411 (2022). [DOI] [PMC free article] [PubMed] [Google Scholar]
- 68.Durai V, Bagadia P, Granja JM, Satpathy AT, Kulkarni DH, Davidson J. T. t., Wu R, Patel SJ, Iwata A, Liu TT, Huang X, Briseno CG, Grajales-Reyes GE, Wohner M, Tagoh H, Kee BL, Newberry RD, Busslinger M, Chang HY, Murphy TL, Murphy KM, Cryptic activation of an Irf8 enhancer governs cDC1 fate specification. Nature immunology 20, 1161–1173 (2019). [DOI] [PMC free article] [PubMed] [Google Scholar]
- 69.Caton ML, Smith-Raska MR, Reizis B, Notch-RBP-J signaling controls the homeostasis of CD8- dendritic cells in the spleen. J Exp Med 204, 1653–1664 (2007). [DOI] [PMC free article] [PubMed] [Google Scholar]
- 70.Hoeffel G, Wang Y, Greter M, See P, Teo P, Malleret B, Leboeuf M, Low D, Oller G, Almeida F, Choy SH, Grisotto M, Renia L, Conway SJ, Stanley ER, Chan JK, Ng LG, Samokhvalov IM, Merad M, Ginhoux F, Adult Langerhans cells derive predominantly from embryonic fetal liver monocytes with a minor contribution of yolk sac-derived macrophages. J. Exp. Med. 209, 1167–1181 (2012). [DOI] [PMC free article] [PubMed] [Google Scholar]
- 71.Sawai CM, Babovic S, Upadhaya S, Knapp DJ, Lavin Y, Lau CM, Goloborodko A, Feng J, Fujisaki J, Ding L, Mirny LA, Merad M, Eaves CJ, Reizis B, Hematopoietic Stem Cells Are the Major Source of Multilineage Hematopoiesis in Adult Animals. Immunity 45, 597–609 (2016). [DOI] [PMC free article] [PubMed] [Google Scholar]
- 72.Gallouet A-S, Ferri F, Petit V, Parcelier A, Lewandowski D, Gault N, Barroca V, Le Gras S, Soler E, Grosveld F, Macrophage production and activation are dependent on TRIM33. Oncotarget 8, 5111 (2017). [DOI] [PMC free article] [PubMed] [Google Scholar]
- 73.Ferri F, Petit V, Barroca V, Romeo PH, Interplay between FACT subunit SPT16 and TRIM33 can remodel chromatin at macrophage distal regulatory elements. Epigenetics Chromatin 12, 46 (2019). [DOI] [PMC free article] [PubMed] [Google Scholar]
- 74.Ferri F, Parcelier A, Petit V, Gallouet AS, Lewandowski D, Dalloz M, van den Heuvel A, Kolovos P, Soler E, Squadrito ML, De Palma M, Davidson I, Rousselet G, Romeo PH, TRIM33 switches off Ifnb1 gene transcription during the late phase of macrophage activation. Nat Commun 6, 8900 (2015). [DOI] [PMC free article] [PubMed] [Google Scholar]
- 75.Assouvie A, Rotival M, Hamroune J, Busso D, Romeo PH, Quintana-Murci L, Rousselet G, A genetic variant controls interferon-beta gene expression in human myeloid cells by preventing C/EBP-beta binding on a conserved enhancer. Plos Genet 16, e1009090 (2020). [DOI] [PMC free article] [PubMed] [Google Scholar]
- 76.Roy S, Guler R, Parihar SP, Schmeier S, Kaczkowski B, Nishimura H, Shin JW, Negishi Y, Ozturk M, Hurdayal R, Kubosaki A, Kimura Y, de Hoon MJ, Hayashizaki Y, Brombacher F, Suzuki H, Batf2/Irf1 induces inflammatory responses in classically activated macrophages, lipopolysaccharides, and mycobacterial infection. J Immunol 194, 6035–6044 (2015). [DOI] [PubMed] [Google Scholar]
- 77.Bakri Y, Sarrazin S, Mayer UP, Tillmanns S, Nerlov C, Boned A, Sieweke MH, Balance of MafB and PU. 1 specifies alternative macrophage or dendritic cell fate. Blood 105, 2707–2716 (2005). [DOI] [PubMed] [Google Scholar]
- 78.Goudot C, Coillard A, Villani AC, Gueguen P, Cros A, Sarkizova S, Tang-Huau TL, Bohec M, Baulande S, Hacohen N, Amigorena S, Segura E, Aryl Hydrocarbon Receptor Controls Monocyte Differentiation into Dendritic Cells versus Macrophages. Immunity 47, 582–596 e586 (2017). [DOI] [PubMed] [Google Scholar]
- 79.Leithner A, Renkawitz J, De Vries I, Hauschild R, Hacker H, Sixt M, Fast and efficient genetic engineering of hematopoietic precursor cells for the study of dendritic cell migration. Eur J Immunol 48, 1074–1077 (2018). [DOI] [PubMed] [Google Scholar]
- 80.Hammerschmidt SI, Werth K, Rothe M, Galla M, Permanyer M, Patzer GE, Bubke A, Frenk DN, Selich A, Lange L, Schambach A, Bosnjak B, Forster R, CRISPR/Cas9 Immunoengineering of Hoxb8-Immortalized Progenitor Cells for Revealing CCR7-Mediated Dendritic Cell Signaling and Migration Mechanisms in vivo. Front Immunol 9, 1949 (2018). [DOI] [PMC free article] [PubMed] [Google Scholar]
- 81.Kabashima K, Banks TA, Ansel KM, Lu TT, Ware CF, Cyster JG, Intrinsic lymphotoxin-beta receptor requirement for homeostasis of lymphoid tissue dendritic cells. Immunity 22, 439–450 (2005). [DOI] [PubMed] [Google Scholar]
- 82.Gao W.-w., Xiao R.-q., Zhang W.-j., Hu Y.-r., Peng B.-l., Li W.-j., He Y.-h., Shen H.-f., Ding J.-c., Huang Q.-x., JMJD6 licenses ERα-dependent enhancer and coding gene activation by modulating the recruitment of the CARM1/MED12 co-activator complex. Molecular cell 70, 340–357. e348 (2018). [DOI] [PMC free article] [PubMed] [Google Scholar]
- 83.Ramírez-Reyes JM, Cuesta R, Pause A, Folliculin: a regulator of transcription through AMPK and mTOR signaling pathways. Frontiers in Cell and Developmental Biology 9, 961 (2021). [DOI] [PMC free article] [PubMed] [Google Scholar]
- 84.Chrétien M-L, Legouge C, Martin RZ, Hammann A, Trad M, Aucagne R, Largeot A, Bastie J-N, Delva L, Quéré R, Trim33/Tif1γ is involved in late stages of granulomonopoiesis in mice. Experimental hematology 44, 727–739. e726 (2016). [DOI] [PubMed] [Google Scholar]
- 85.Pang SHM, de Graaf CA, Hilton DJ, Huntington ND, Carotta S, Wu L, Nutt SL, PU.1 Is Required for the Developmental Progression of Multipotent Progenitors to Common Lymphoid Progenitors. Front Immunol 9, 1264 (2018). [DOI] [PMC free article] [PubMed] [Google Scholar]
- 86.Sichien D, Scott CL, Martens L, Vanderkerken M, Van Gassen S, Plantinga M, Joeris T, De Prijck S, Vanhoutte L, Vanheerswynghels M, Van Isterdael G, Toussaint W, Madeira FB, Vergote K, Agace WW, Clausen BE, Hammad H, Dalod M, Saeys Y, Lambrecht BN, Guilliams M, IRF8 Transcription Factor Controls Survival and Function of Terminally Differentiated Conventional and Plasmacytoid Dendritic Cells, Respectively. Immunity 45, 626–640 (2016). [DOI] [PubMed] [Google Scholar]
- 87.Wan CK, Oh J, Li P, West EE, Wong EA, Andraski AB, Spolski R, Yu ZX, He J, Kelsall BL, Leonard WJ, The cytokines IL-21 and GM-CSF have opposing regulatory roles in the apoptosis of conventional dendritic cells. Immunity 38, 514–527 (2013). [DOI] [PMC free article] [PubMed] [Google Scholar]
- 88.Fuertes Marraco SA, Scott CL, Bouillet P, Ives A, Masina S, Vremec D, Jansen ES, O’Reilly LA, Schneider P, Fasel N, Shortman K, Strasser A, Acha-Orbea H, Type I interferon drives dendritic cell apoptosis via multiple BH3-only proteins following activation by PolyIC in vivo. PLoS One 6, e20189 (2011). [DOI] [PMC free article] [PubMed] [Google Scholar]
- 89.Villar J, Cros A, De Juan A, Alaoui L, Bonte PE, Lau CM, Tiniakou I, Reizis B, Segura E, ETV3 and ETV6 enable monocyte differentiation into dendritic cells by repressing macrophage fate commitment. Nature immunology 24, 84–95 (2023). [DOI] [PMC free article] [PubMed] [Google Scholar]
- 90.de Luca C, Kowalski TJ, Zhang Y, Elmquist JK, Lee C, Kilimann MW, Ludwig T, Liu SM, Chua SC Jr., Complete rescue of obesity, diabetes, and infertility in db/db mice by neuron-specific LEPR-B transgenes. J Clin Invest 115, 3484–3493 (2005). [DOI] [PMC free article] [PubMed] [Google Scholar]
- 91.Mach N, Gillessen S, Wilson SB, Sheehan C, Mihm M, Dranoff G, Differences in dendritic cells stimulated in vivo by tumors engineered to secrete granulocyte-macrophage colony-stimulating factor or Flt3-ligand. Cancer Res 60, 3239–3246 (2000). [PubMed] [Google Scholar]
- 92.Sanjana NE, Shalem O, Zhang F, Improved vectors and genome-wide libraries for CRISPR screening. Nat Methods 11, 783–784 (2014). [DOI] [PMC free article] [PubMed] [Google Scholar]
- 93.Joung J, Konermann S, Gootenberg JS, Abudayyeh OO, Platt RJ, Brigham MD, Sanjana NE, Zhang F, Genome-scale CRISPR-Cas9 knockout and transcriptional activation screening. Nat Protoc 12, 828–863 (2017). [DOI] [PMC free article] [PubMed] [Google Scholar]
- 94.Buenrostro JD, Wu B, Chang HY, Greenleaf WJ, ATAC-seq: A Method for Assaying Chromatin Accessibility Genome-Wide. Current protocols in molecular biology / edited by Ausubel Frederick M. ... [et al.] 109, 21 29 21–29 (2015). [DOI] [PMC free article] [PubMed] [Google Scholar]
- 95.Pacold ME, Brimacombe KR, Chan SH, Rohde JM, Lewis CA, Swier LJ, Possemato R, Chen WW, Sullivan LB, Fiske BP, Cho S, Freinkman E, Birsoy K, Abu-Remaileh M, Shaul YD, Liu CM, Zhou M, Koh MJ, Chung H, Davidson SM, Luengo A, Wang AQ, Xu X, Yasgar A, Liu L, Rai G, Westover KD, Vander Heiden MG, Shen M, Gray NS, Boxer MB, Sabatini DM, A PHGDH inhibitor reveals coordination of serine synthesis and one-carbon unit fate. Nat Chem Biol 12, 452–458 (2016). [DOI] [PMC free article] [PubMed] [Google Scholar]
- 96.Chen WW, Freinkman E, Wang T, Birsoy K, Sabatini DM, Absolute Quantification of Matrix Metabolites Reveals the Dynamics of Mitochondrial Metabolism. Cell 166, 1324–1337 e1311 (2016). [DOI] [PMC free article] [PubMed] [Google Scholar]
- 97.Lou F, Sun Y, Wang H, Protocol for Flow Cytometric Detection of Immune Cell Infiltration in the Epidermis and Dermis of a Psoriasis Mouse Model. STAR Protoc 1, 100115 (2020). [DOI] [PMC free article] [PubMed] [Google Scholar]
Associated Data
This section collects any data citations, data availability statements, or supplementary materials included in this article.
Supplementary Materials
Data file S7. Differential gene expression in Trim33-deficient DC progenitors.
Data file S6. Differential representation of all genes between samples in the transcription factor screen.
Data file S1. Gene expression in HoxB8-FL-derived DCs and primary splenic DCs.
Data file S4. Metabolomic analysis of HoxB8-FL cell differentiation by mass spectrometry.
Data file S2. Individual targeting sgRNAs with differential representation between samples in the genome-wide screen.
Data file S8. Materials and reagents.
Data file S3. Differential representation of all genes between samples in the genome-wide screen.
Data file S5. Individual targeting sgRNAs with differential representation between samples in the transcription factor screen.
Supplementary Methods
Figure S1. Phenotypic differentiation of HoxB8-FL cells.
Figure S2. Transcriptome and chromatin profiles of DC subsets derived from HoxB8-FL cells.
Figure S3. The expression of core subset-specific genes in HoxB8-FL-derived DCs
Figure S4. Additional characterization of the genome-wide Brie library screen in Hoxb8-FL cells.
Figure S5. The role of Carm1 in the differentiation of HoxB8-FL cells.
Figure S6. DC differentiation from Carm1-deficient hematopoietic cells.
Figure S7. Characterization of mTOR signaling during DC differentiation of Hoxb8-FL cells.
Figure S8. Additional characterization of the transcription factor library screen in Hoxb8-FL cells.
Figure S9. Deletion of Trim33 abolishes DC differentiation in vitro.
Figure S10. Characterization of splenocytes after global long-term deletion of Trim33
Figure S11. Characterization of lymph node cells after global long-term deletion of Trim33
Figure S12. Characterization of bone marrow cells after global long-term deletion of Trim33
Figure S13. Cell-intrinsic deletion of Trim33 impairs DC differentiation.
Figure S14. Additional characterization of DC differentiation from Trim33-deficient Flt3+ progenitors
Figure S15. The binding of Trim33 to select target genes in macrophages
Data Availability Statement
RNA-Seq, ATAC-Seq and sgRNA-Seq datasets have been deposited in the Gene Expression Omnibus repository under accession no. GSE202585. Tabulated data underlying the figures and uncropped gel images are provided in Data files S9 and S10. All materials used in the manuscript are available from the above-referenced commercial sources or from co-authors following the initial request to the corresponding author (B.R.) and the completion of a material transfer agreement. All other data needed to support the conclusions of the paper are present in the paper or the Supplementary Materials.